Nanex Research

Nanex ~ 12-Mar-2013 ~ Berkshire's Mugging
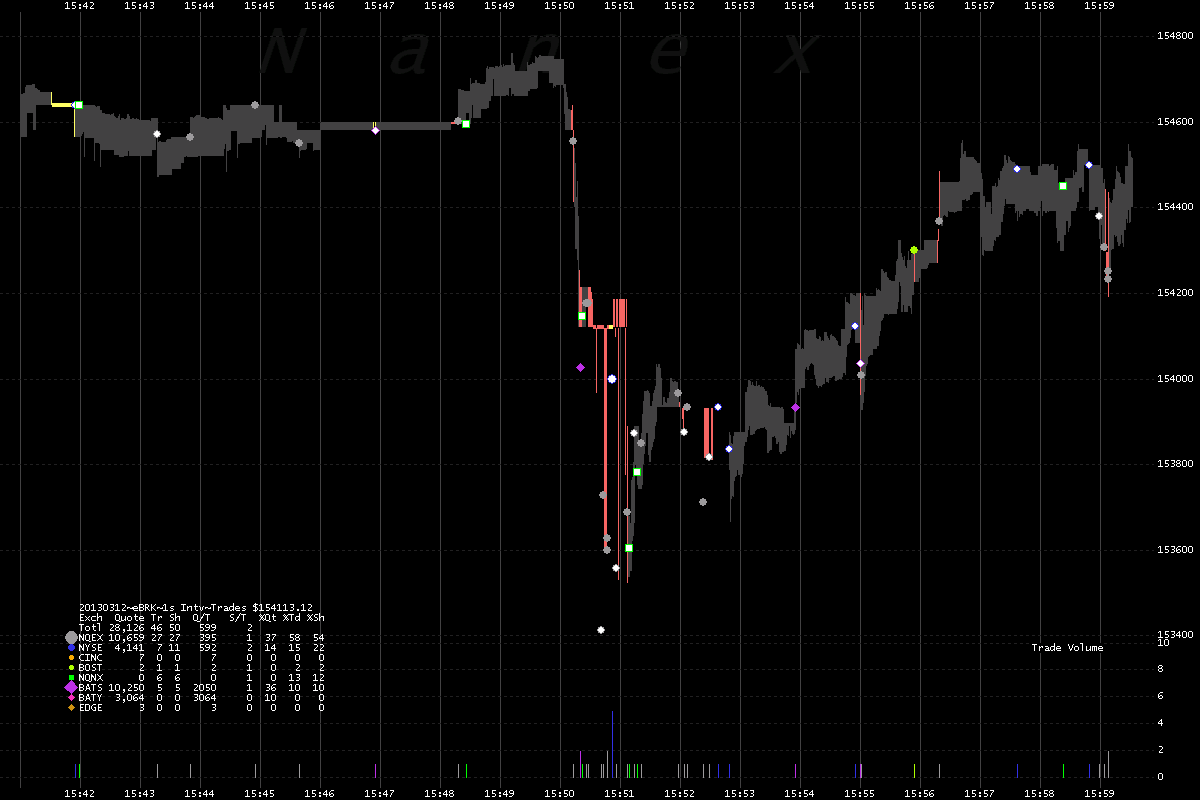
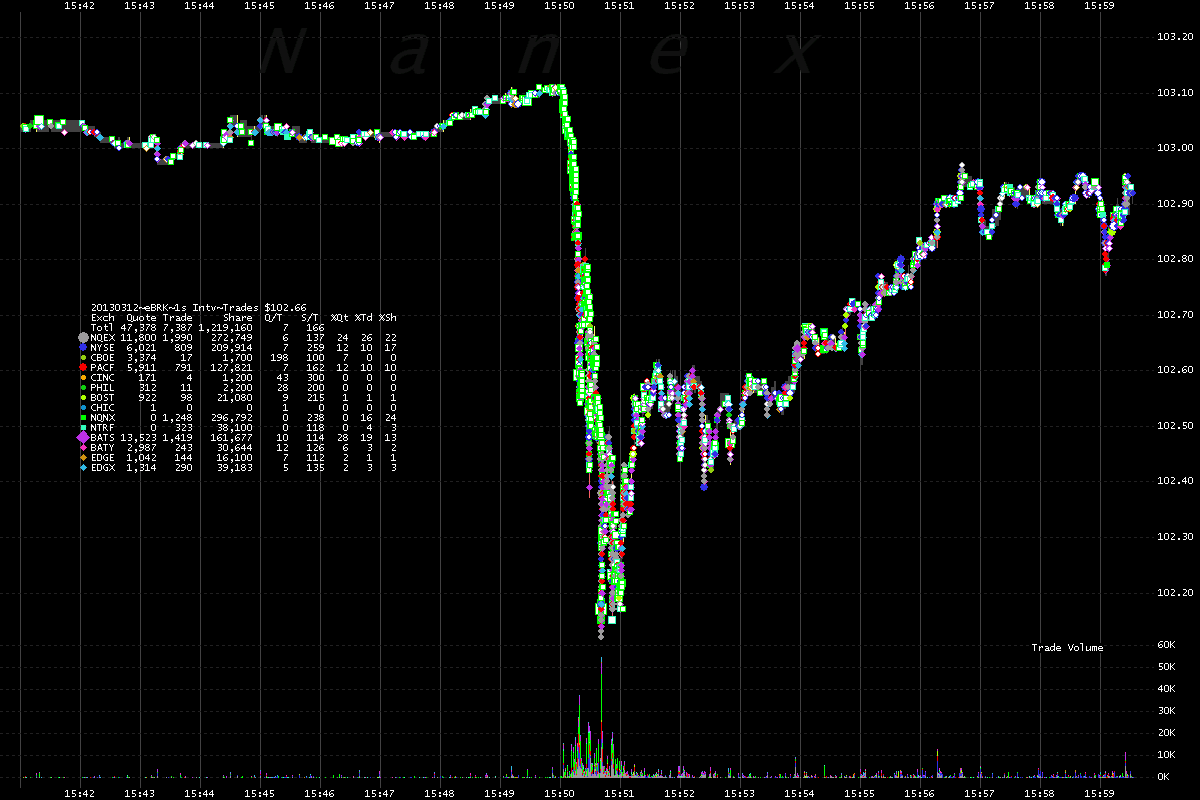
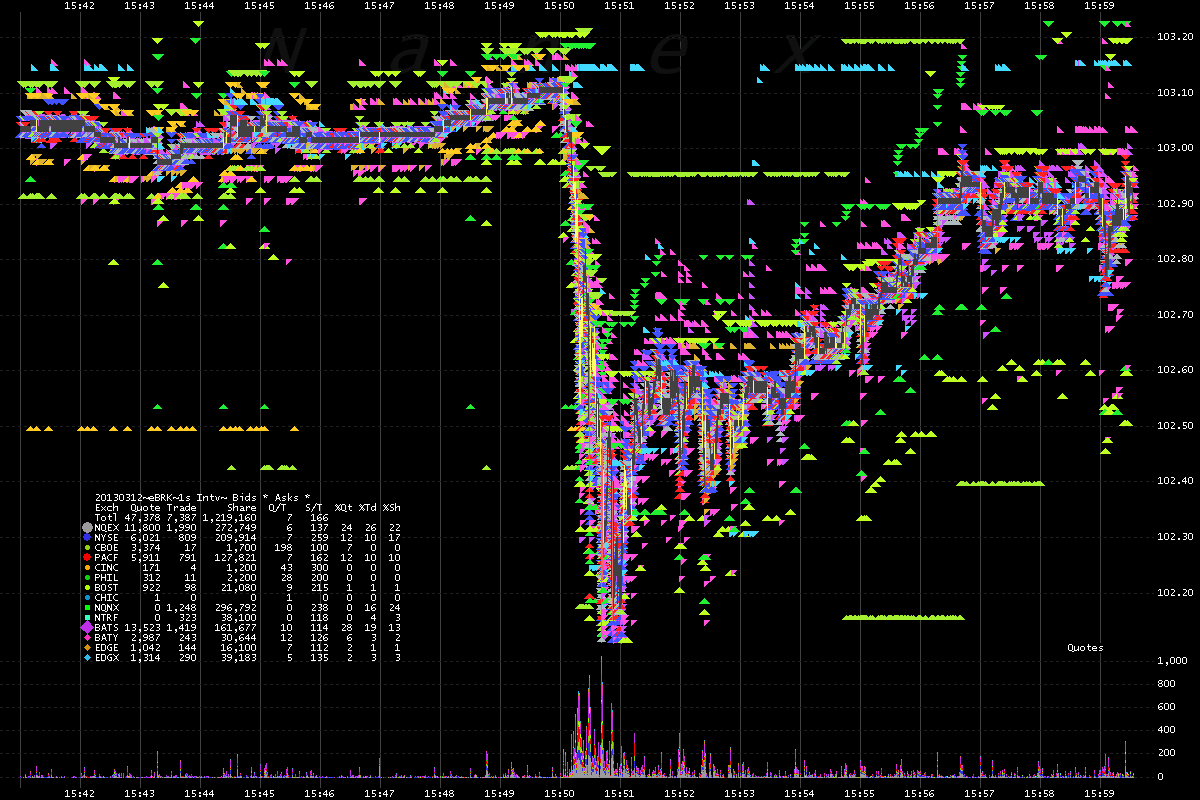
On March 12, 2013 at 15:50, the price of Berkshire Hathaway Class A and Class B fluctuated. Apparently from information (Quote Spam) overload. We may write more tomorrow, charts only for now.
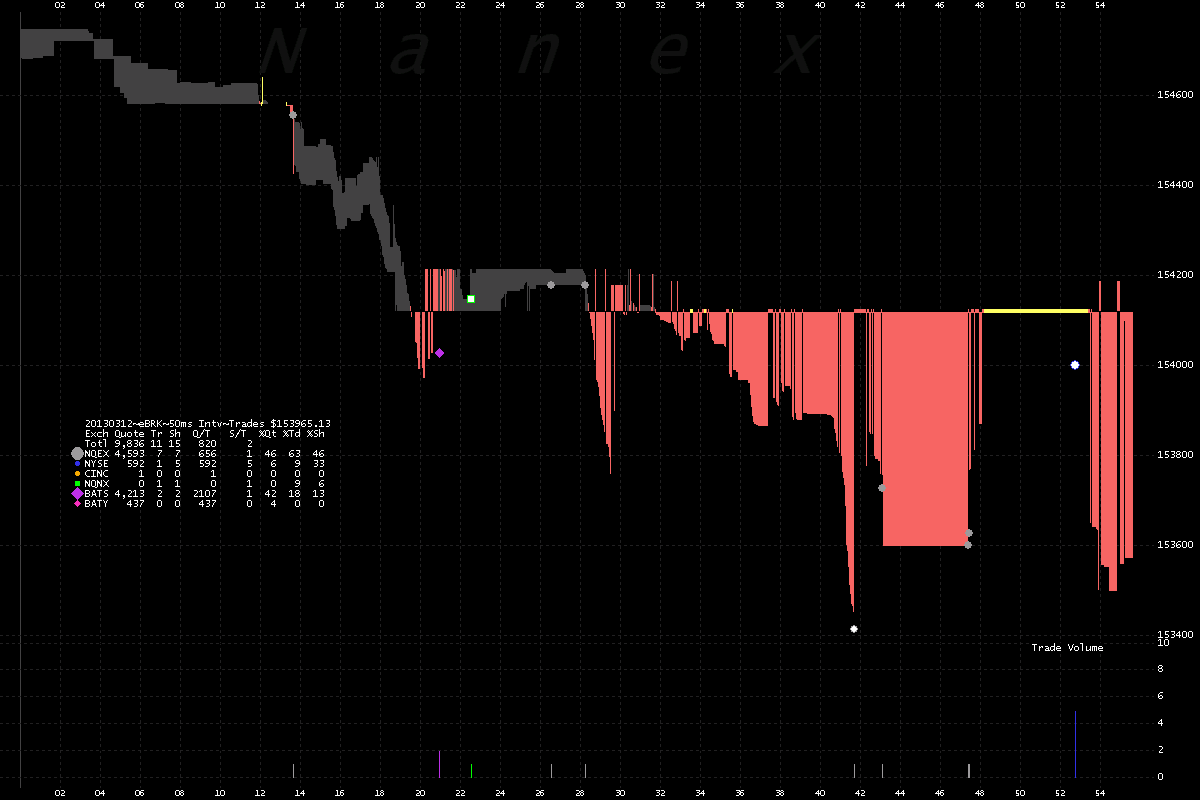
1. BRK.A showing trades color coded by exchange along with the NBBO shaded red
if crossed (bid > ask), yellow if locked (bid = ask), or gray if normal.
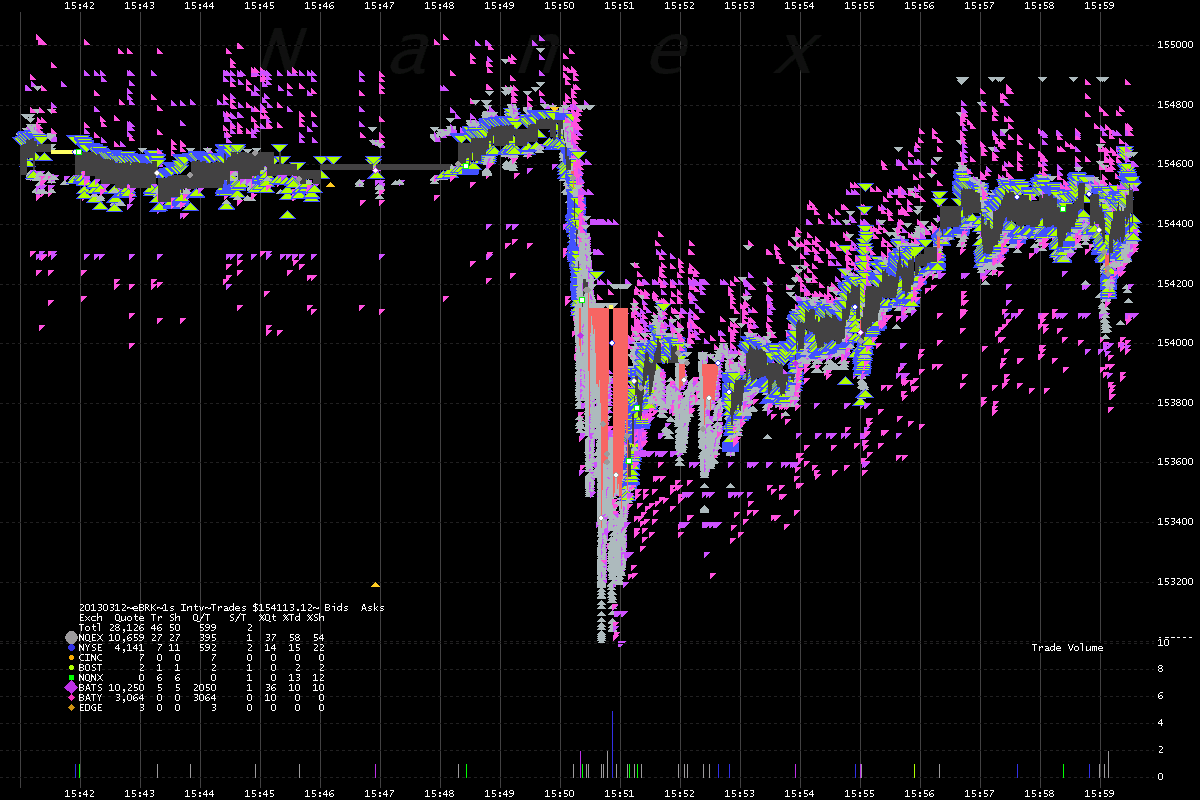
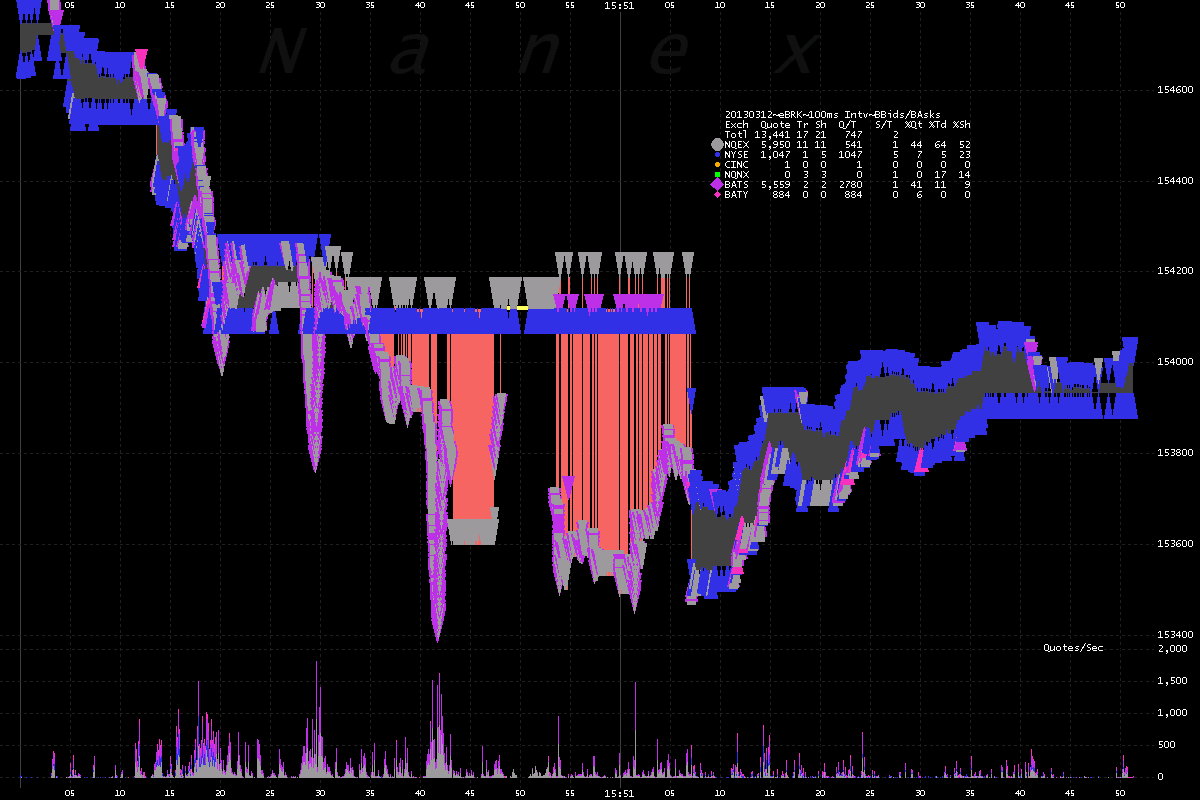
2. BRK.A showing bids and asks color coded by exchange. There are 599 Quotes
for every trade.
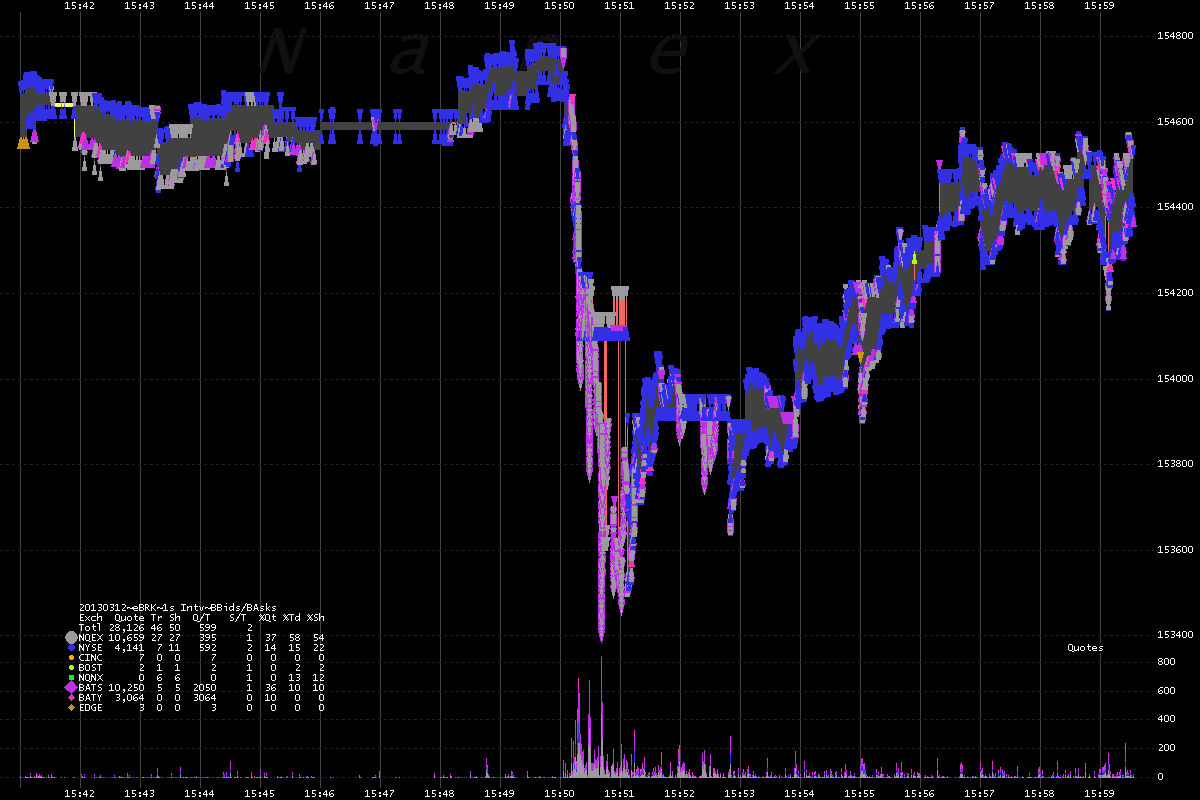
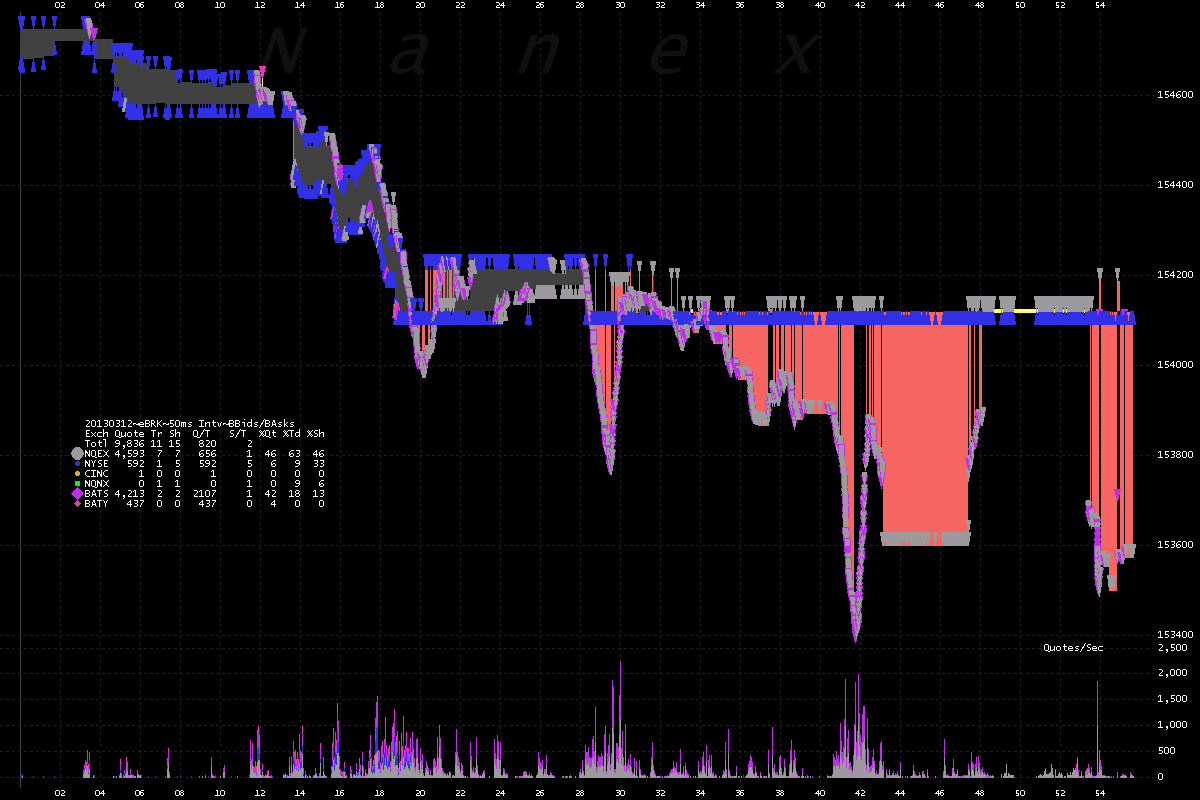
3. BRK.A showing best bids and asks color coded by exchange. The price moved
so fast, NYSE's quote hit a LRP, which caused a crossed market.
4. BRK.A showing trades color coded by exchange. This is a zoomed in view of
Chart 1, showing about 2 minutes of time.
See all that red ? That is not normal. It indicates a crossed market - meaning the best
bid price exceeds the best ask price. When this happens, algos can be unpredictable.
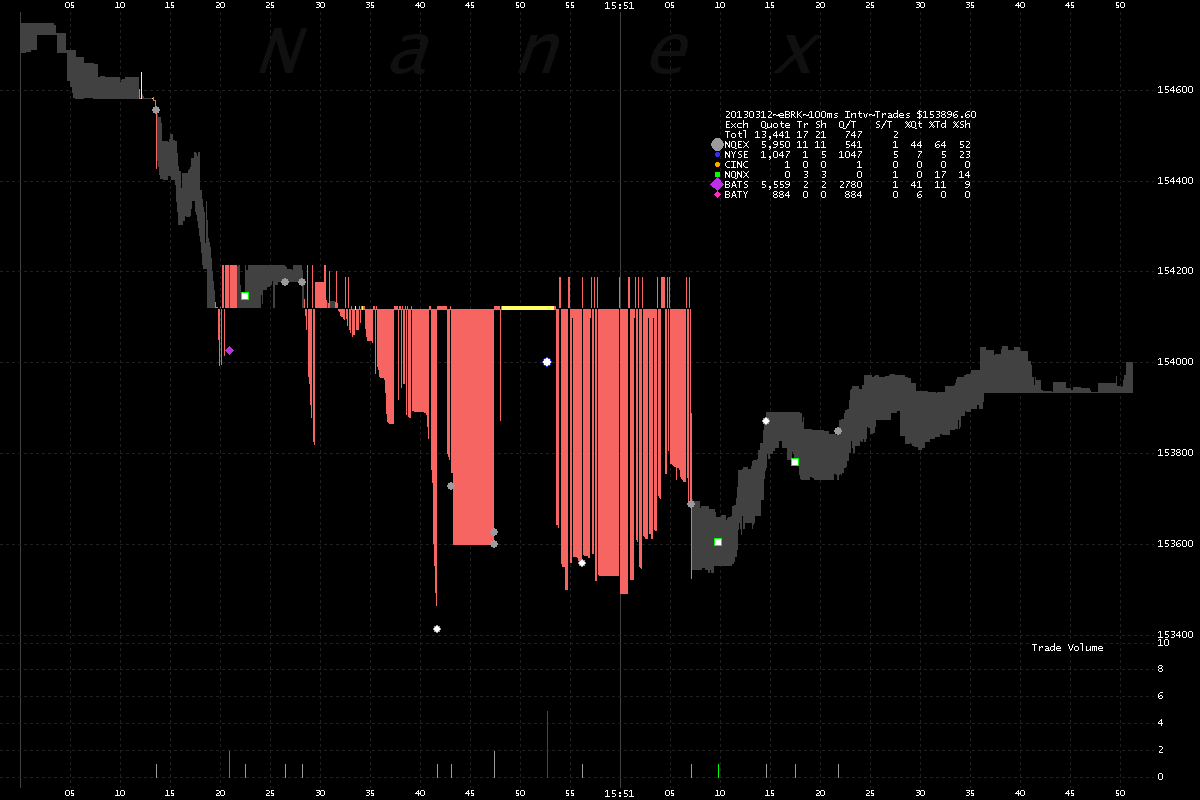
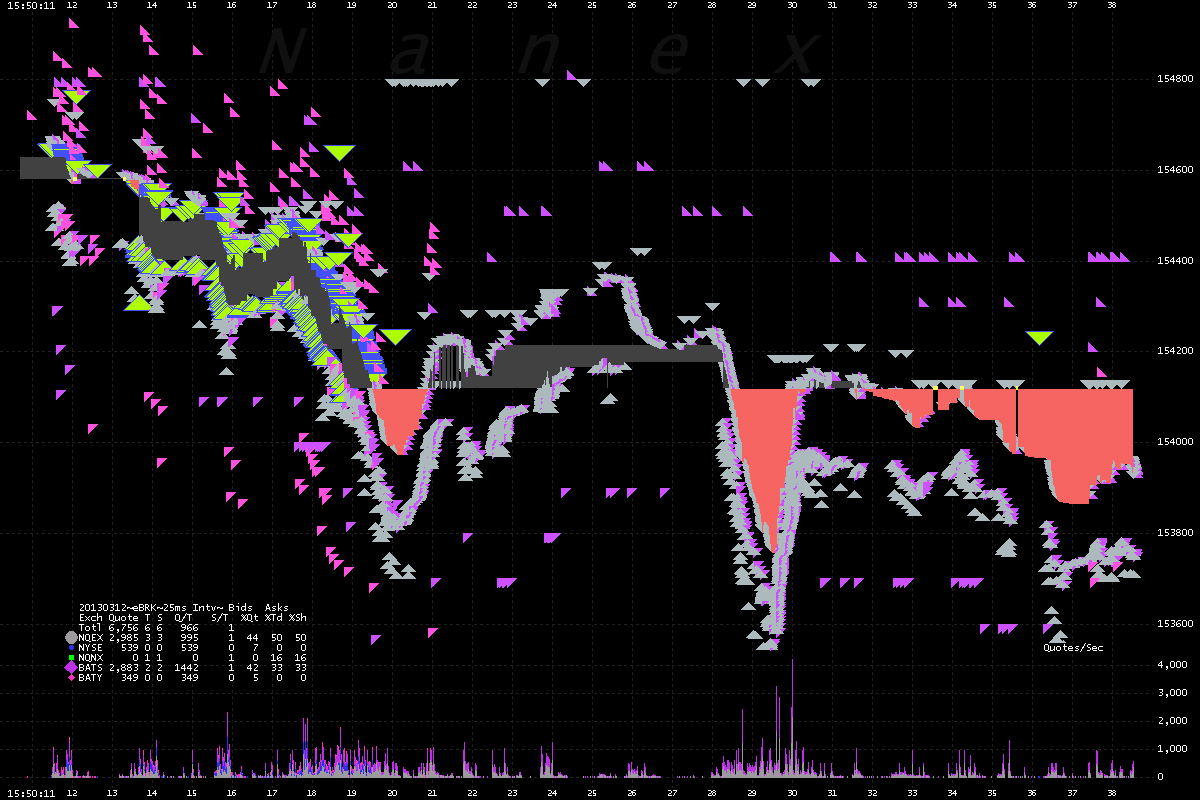
5. BRK.A. Zooming in from Chart 4 above. Showing about 1 minute of time starting
at 15:50.
6. BRK.A showing trades color coded by exchange. This is a zoomed in view of
Chart 3, showing about 2 minutes of time.
7. BRK.A. Zooming in from Chart 6 above. Showing about 1 minute of time starting
at 15:50.
8. BRK.A showing all bids and asks color coded by exchange. The green filled
triangles represent slow market quotes (caused when NYSE hits a LRP).
9. BRK.B showing trades color coded by exchange.
10. BRK.B showing bids and asks color coded by exchange.
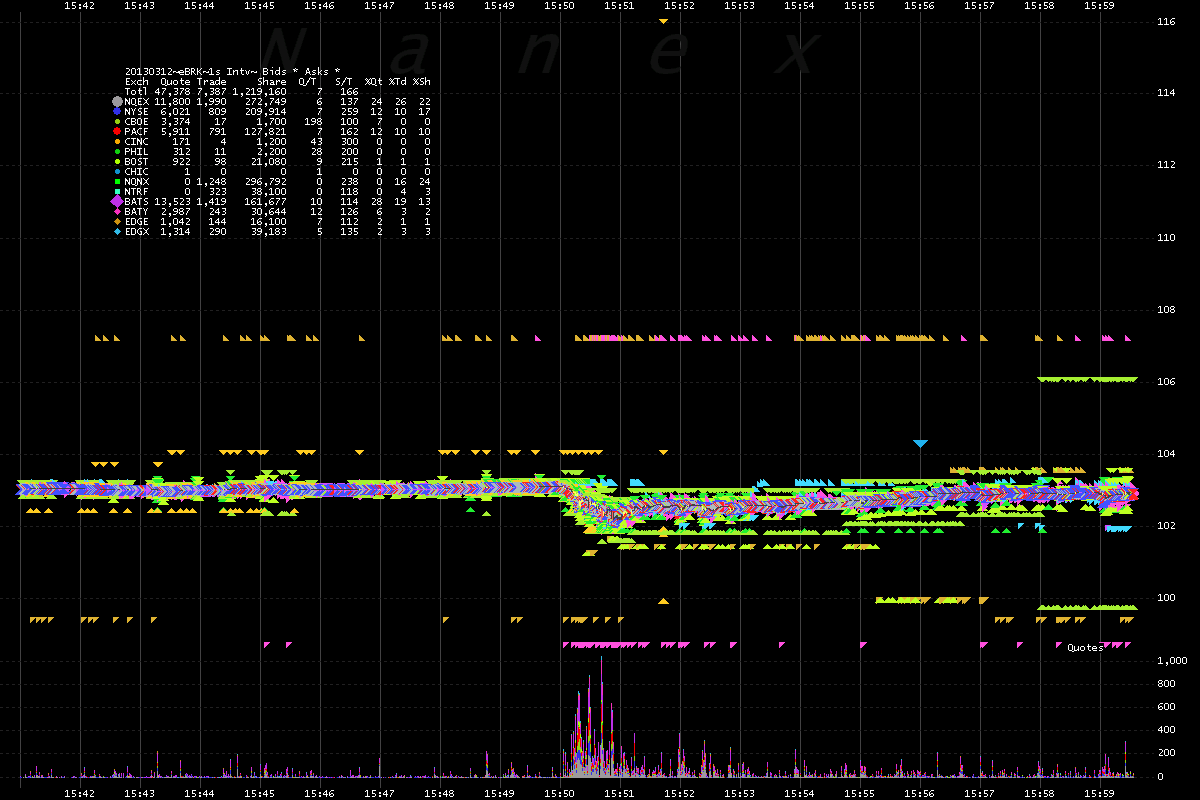
11. BRK.B - same as chart above but scaled out in price to show the wide bids
and asks (some would call these stub quotes).
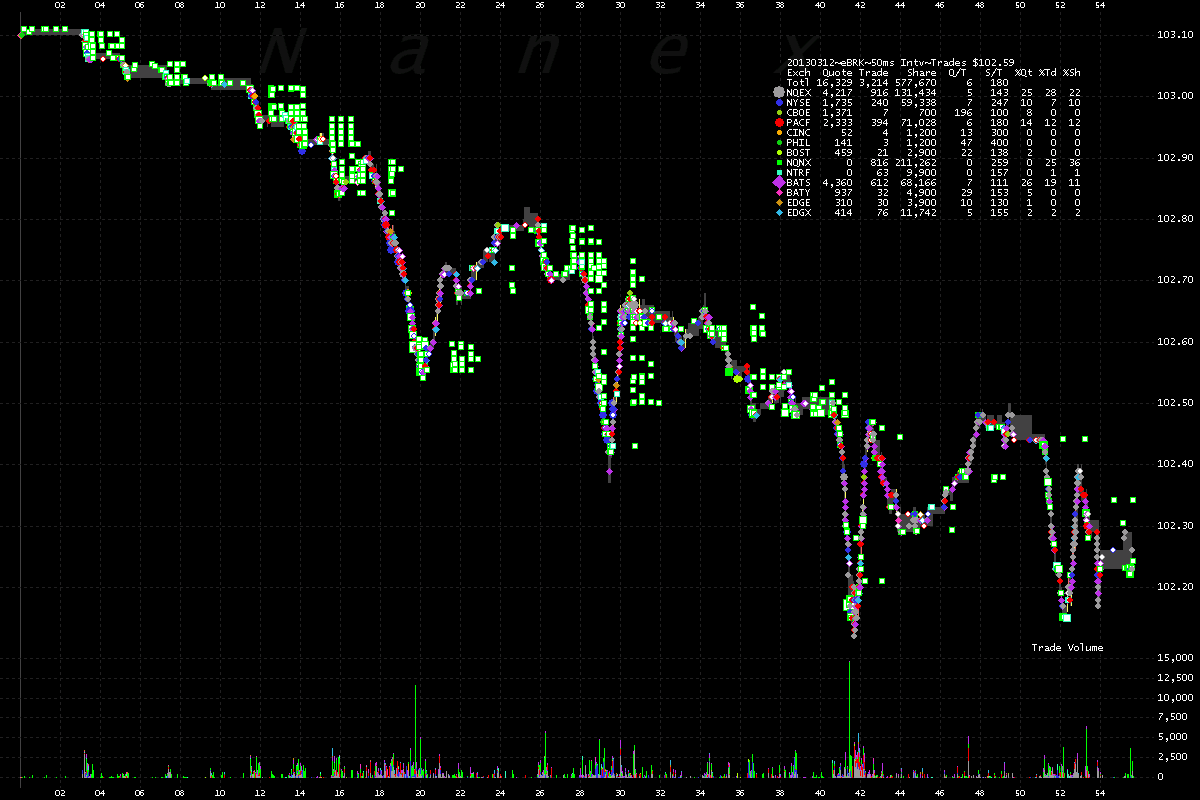
12. BRK.B - zoomed in view of chart 9.
Note how the green dots consistently appear late - these trades reported by dark pools.
Nanex Research
Inquiries: pr@nanex.net


