Nanex Research

Nanex ~ 25-Mar-2013 ~ eMini Algo Disaster on 14-Jan-2008
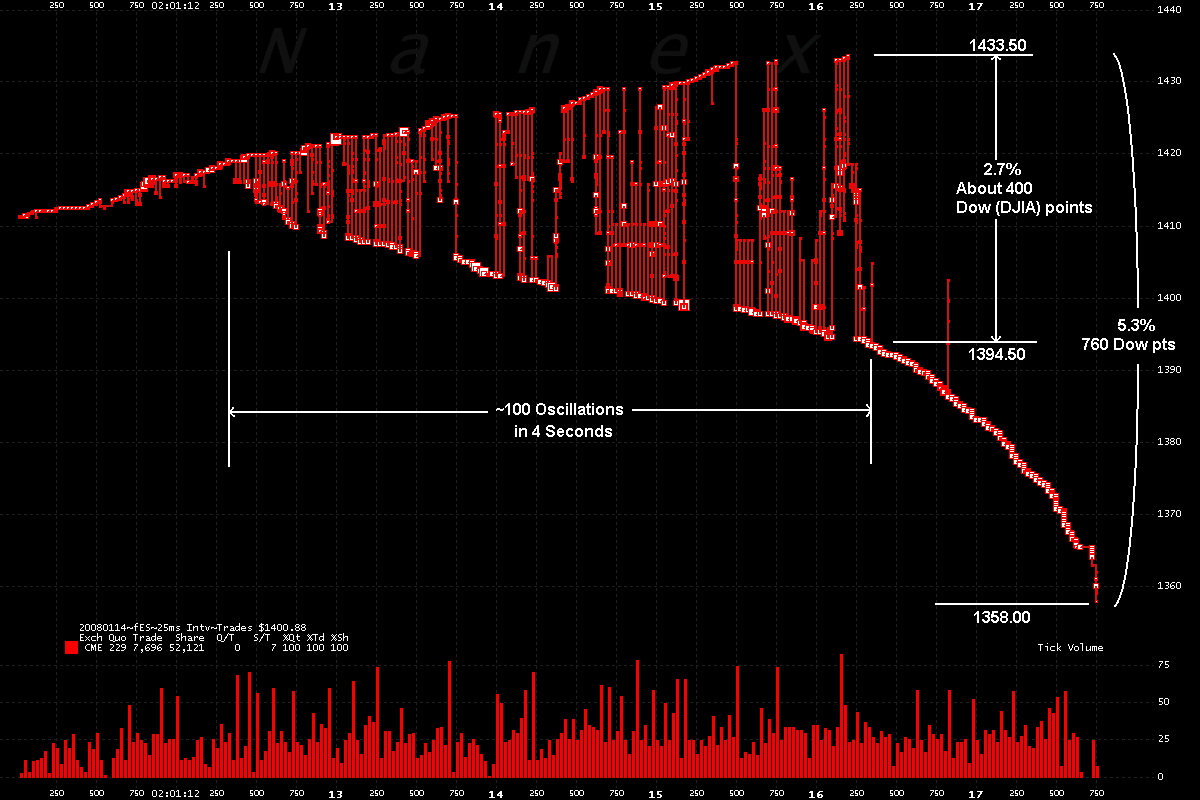
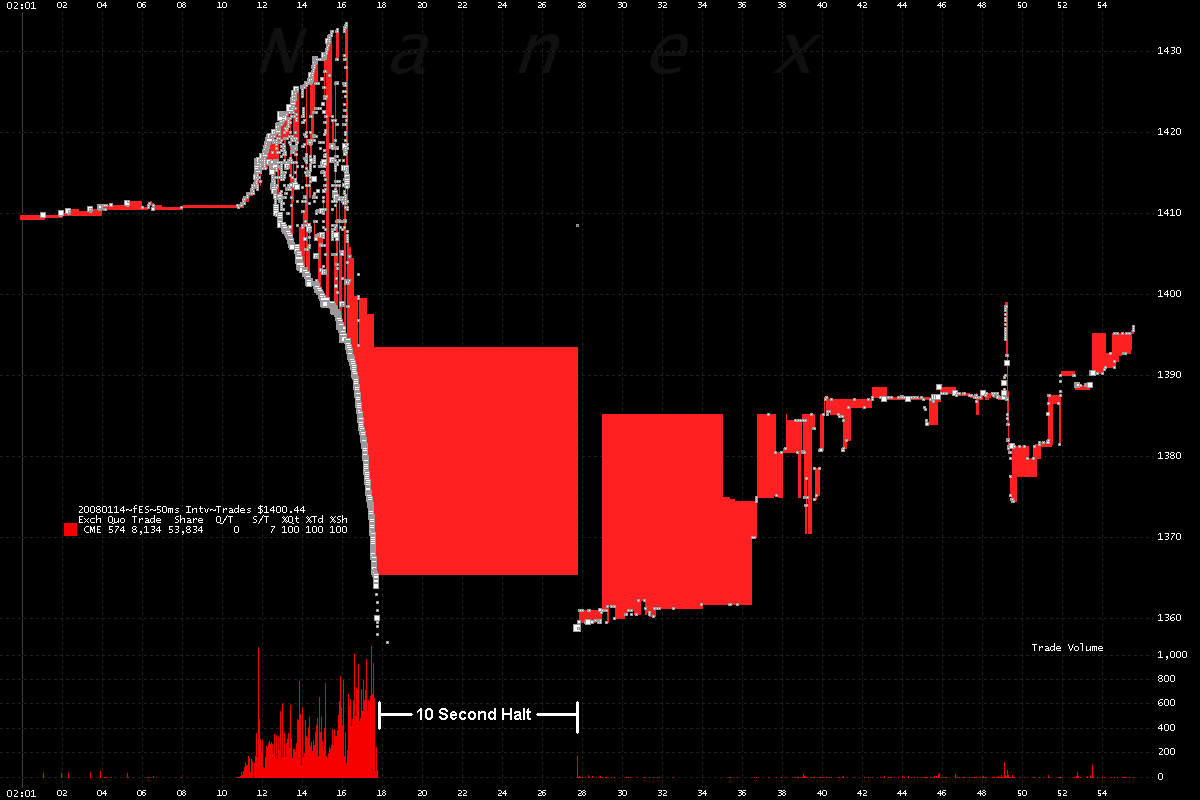
On January 14, 2008, in the early hours of trading, prices of the March 2008 eMini (ES)
futures contract began oscillating rapidly. After about 4 seconds and 100 oscillations,
the price swings widened to the equivalent of about 400 points on the Dow Jones Industrial
Average. The oscillations then abruptly stopped and in less than 2 seconds, the price collapsed 5.3% from its peak: the equivalent of a 760 point drop in the Dow. After reaching
bottom, the market was halted for 10 seconds. Prices returned to normal levels within
the next few minutes. Between 5:30am and 8:00am that morning, the exchange canceled
most of the trades.
This is
similar to an algo that spun out of control in
Natural Gas on 08-Jun-2011
Video replay of trading action
1. March 2008 eMini showing trades (squares) connected by red lines over a 7
second period of time (02:01:11am - 02:01:18am).
Prices oscillate about 100 times over a 4 second period. The oscillation builds to the
equivalent of 400 points on the Dow Jones Average.
From the peak, the market then drops the equivalent of 760 Dow points in less than 2
seconds.
Note there are 7,696 trades and 52,121 contracts shown in the chart below.
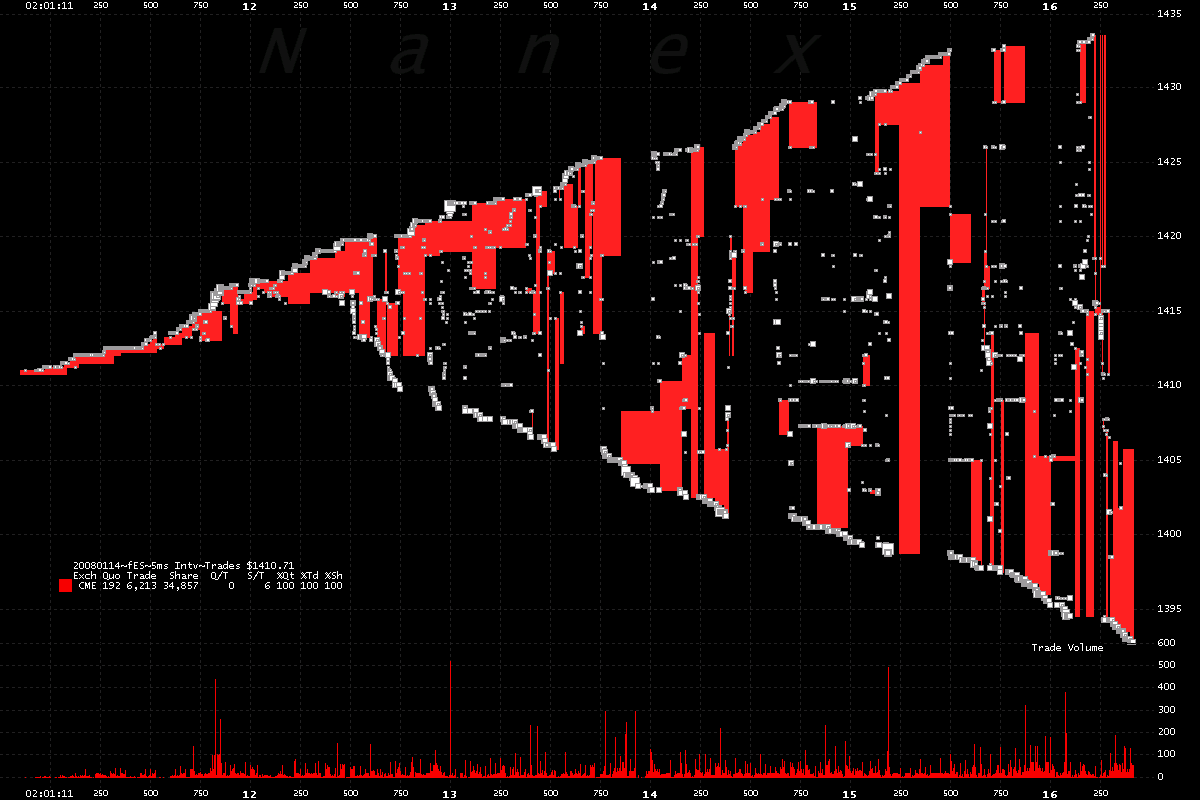
2. March 2008 eMini showing trades and quote spread over a 5 second period of
time (02:01:11 - 02:01:16).
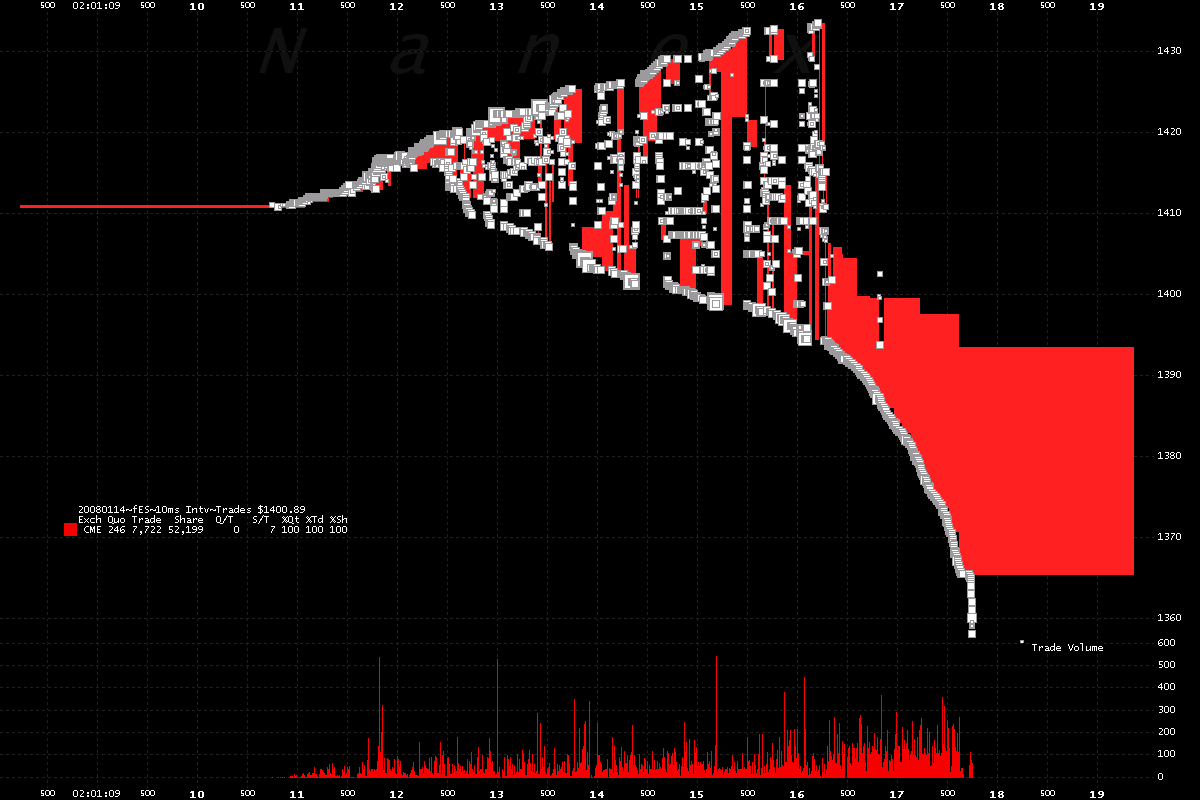
3. March 2008 eMini showing trades and quote spread over a 12 second period
of time (02:01:08am - 02:20:00am)
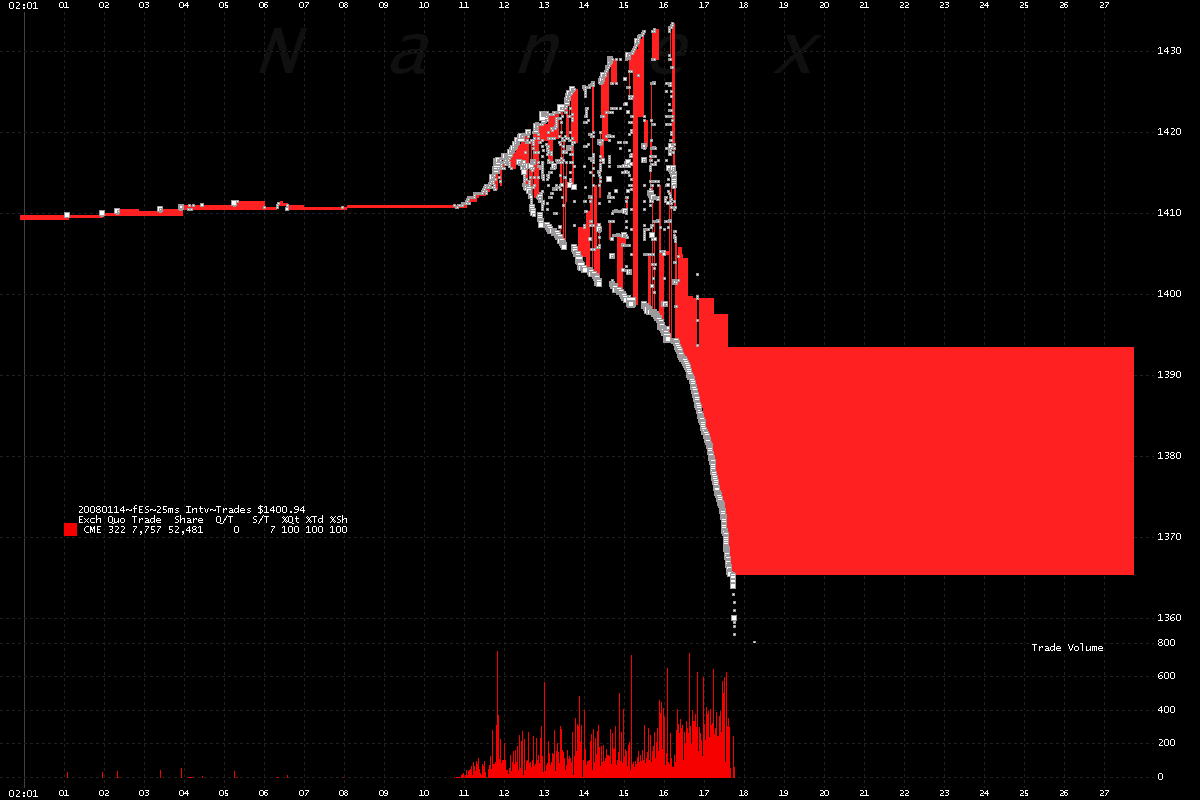
4. March 2008 eMini showing trades and quote spread over a 27 period of time
(2:01:00 - 2:01:27)
5. March 2008 eMini showing trades and quote spread over a 54 minute period
of time (02:01am - 02:55am)
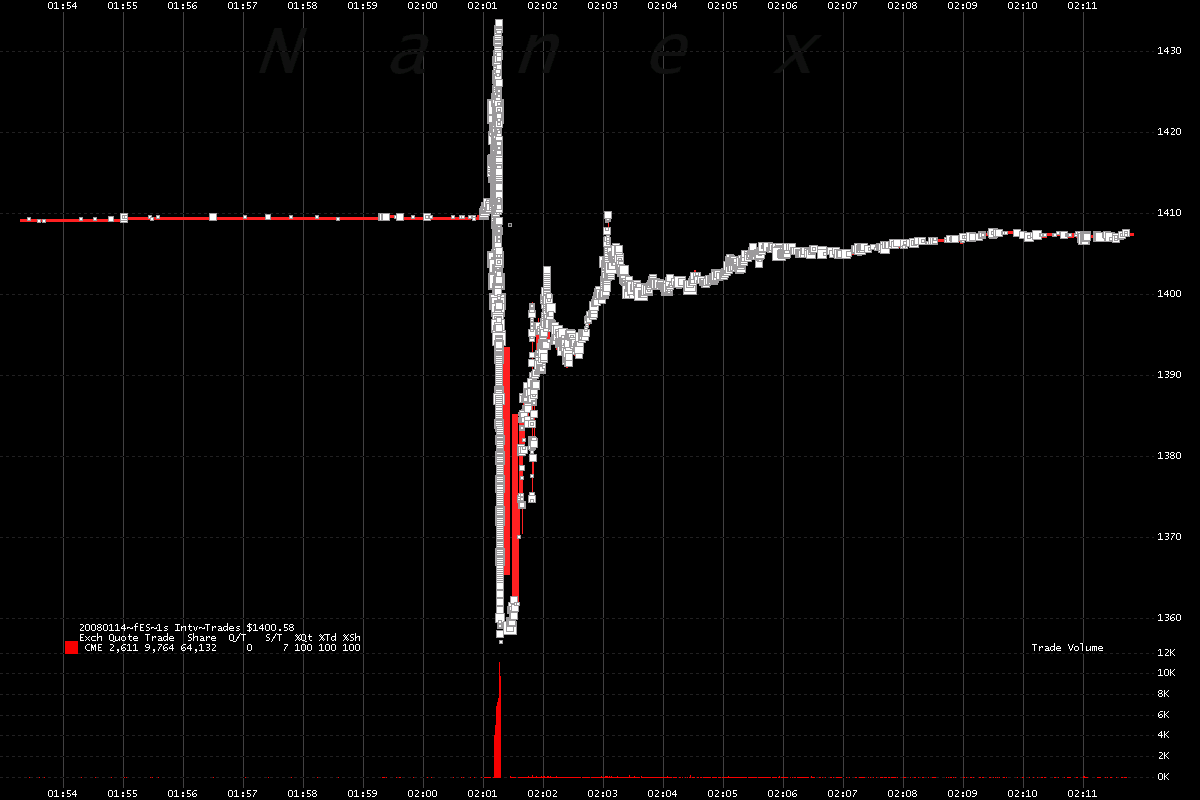
6. March 2008 eMini showing trades and quote spread over a 19 minute period
of time (01:53am - 02:12am).
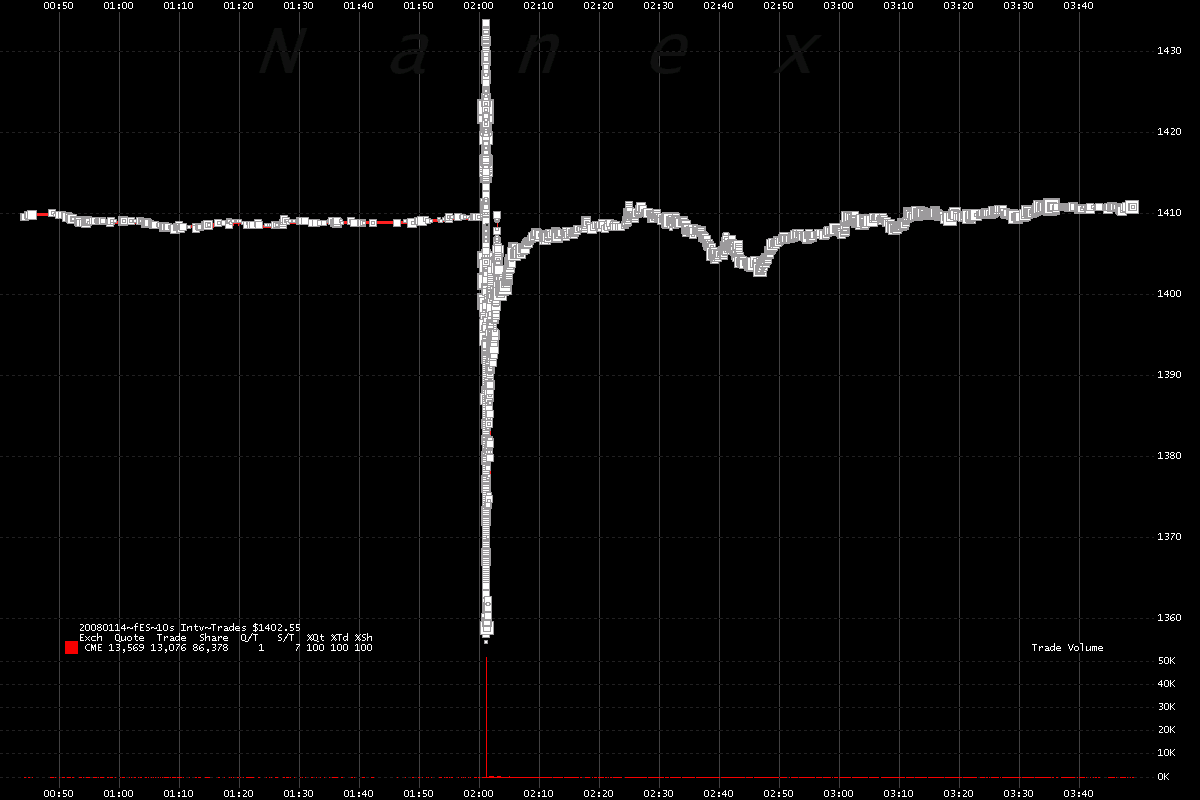
7. March 2008 eMini showing trades and quote spread over a 3 hour period of
time (0:50am - 3:50am).
Nanex Research
Inquiries: pr@nanex.net


