Nanex Research

Nanex ~ 08-Apr-2013 ~ Market Structure Failure
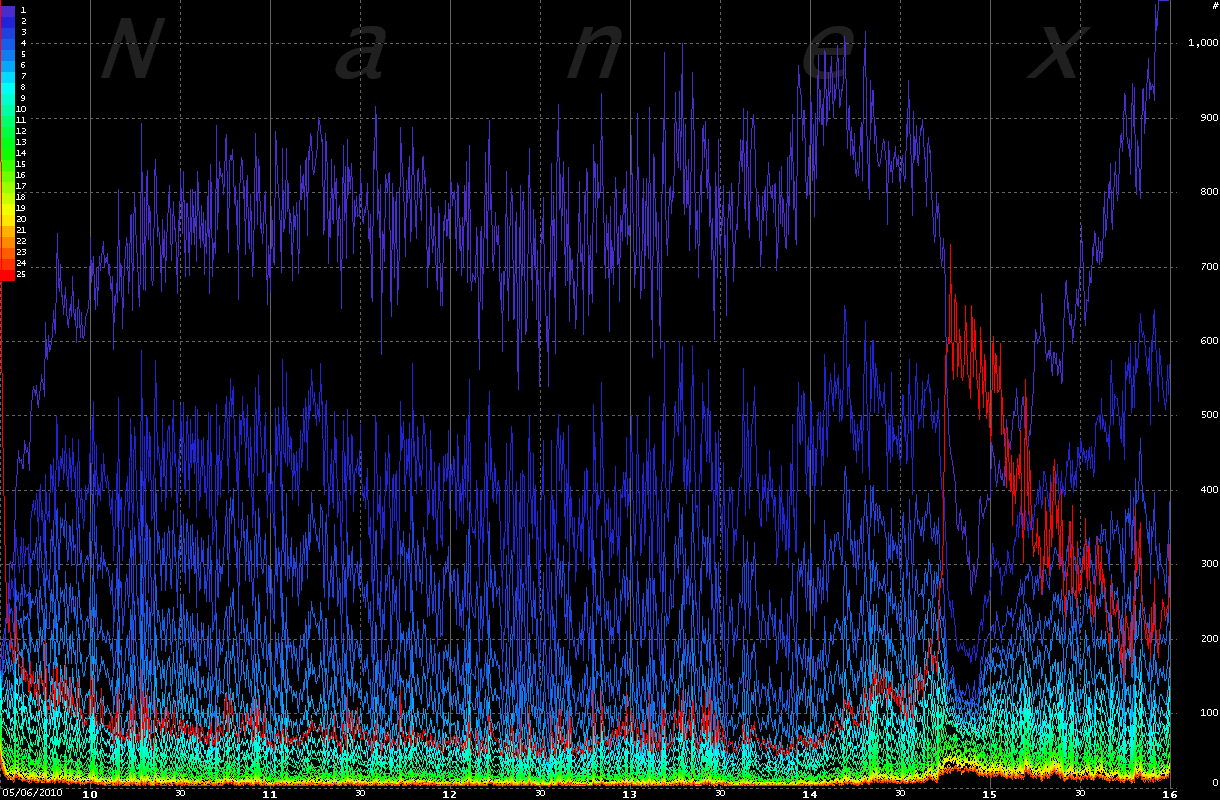
The charts below show the number of NMS stocks with NBBO (National Best Bid/Offer) quote
spreads between 1 and 24, and over 25 during May 6, 2010, the day of the flash crash.
Note how spreads deteriorate well before the market price collapses. See also Flash Crash
Summary Report. The new Limit Up/Down circuit breakers
wouldn't have helped.
1. Number of NMS Stocks Color Coded by NBBO Spread on the day of the Flash Crash.
The deep red line shows the count of NMS stocks with NBBO spreads greater than
or equal to 25 cents. The dark purple represents the number of NMS stocks with NBBO
spreads of 1 cent. Other colors indicate the number of stocks with spreads between 1
and 25 according to the legend.

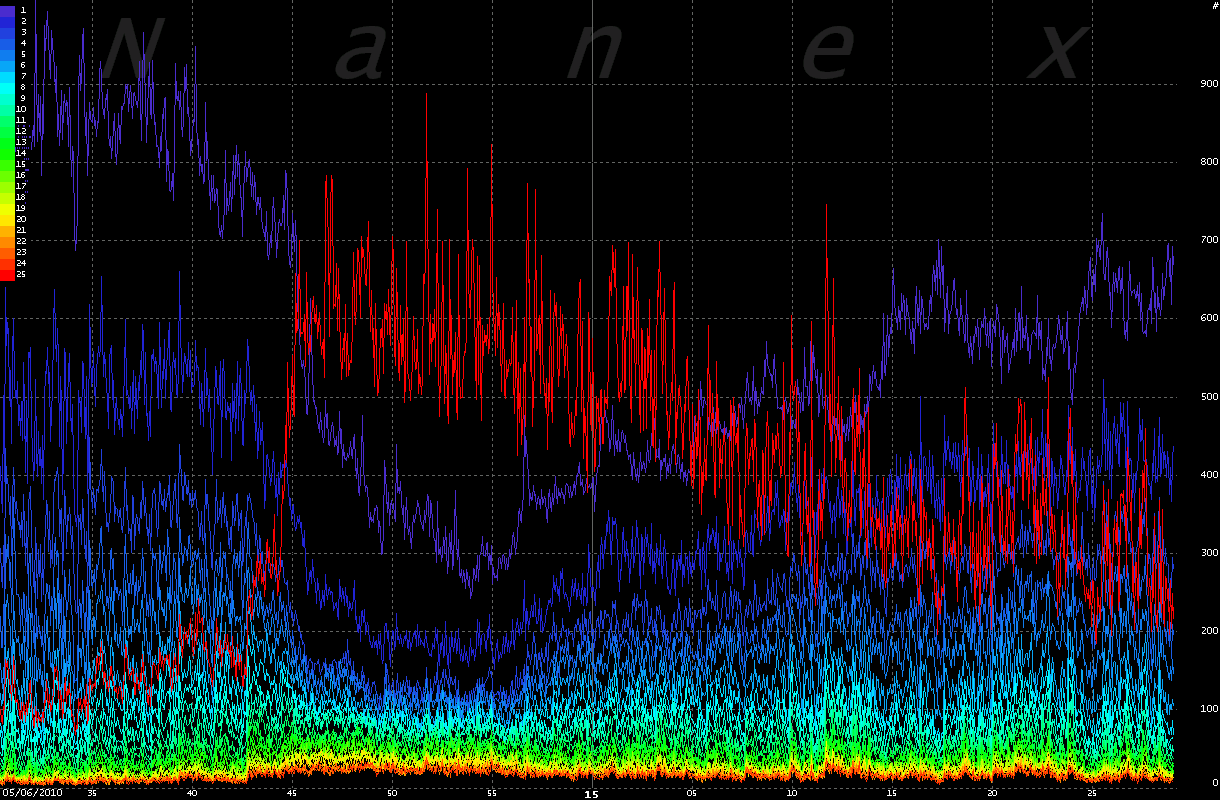
2. Zooming into Chart 1 above.
Spread deterioration accelerated beginning at 14:42:44, just before the DOW would drop
another 600 points.

Nanex Research
Inquiries: pr@nanex.net


