Nanex Research

Nanex ~ 24-Apr-2013 ~ Twitter's 2.2 Million Trades
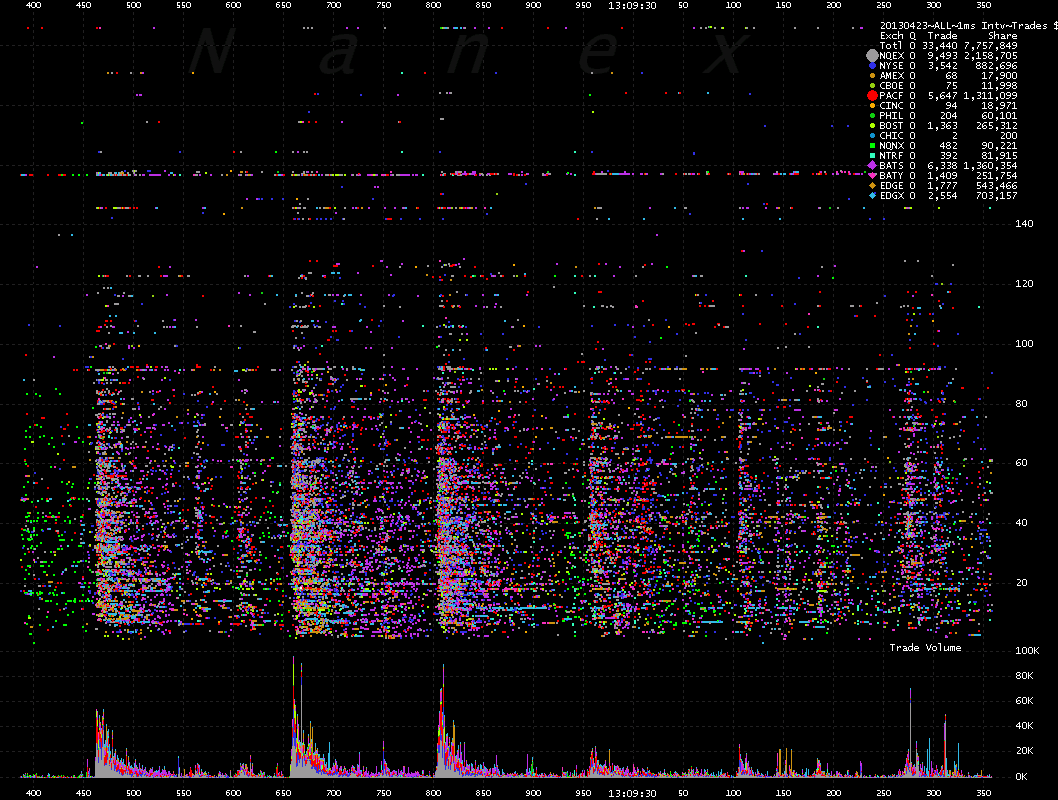
Charts below show 2.2 million trades for about 8000 NMS stocks during the trading event (13:08 - 13:15 on April 23, 2013) caused after a fake tweet was posted on AP's account
at 13:07:50.
See also these two
pages for more charts on this
event.
1. Trades for about 8000 NMS stocks priced between 0 and $210. Each dot represents a trade, color coded by reporting exchange.
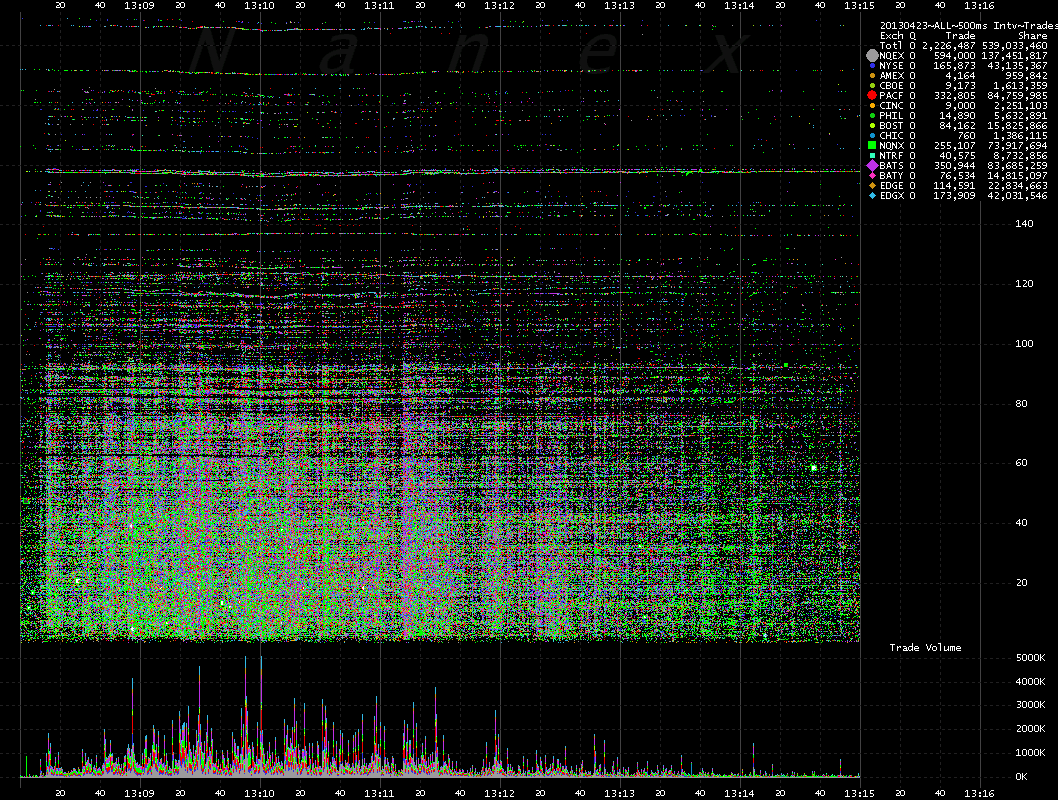
2. Trades for about 8000 NMS stocks priced between 0 and $210. Each dot represents a trade, color coded by reporting exchange.
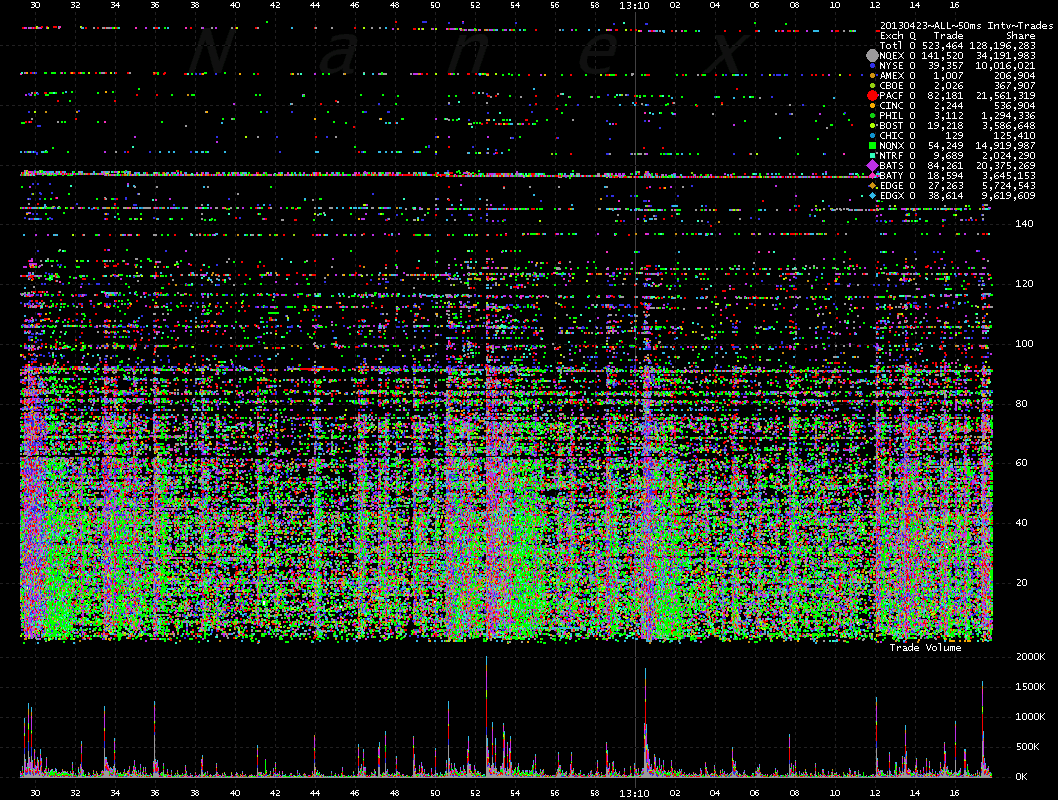
3. Trades for about 8000 NMS stocks priced between 0 and $210. Each dot represents a trade, color coded by reporting exchange.
Zoomed in to about 18 seconds of time
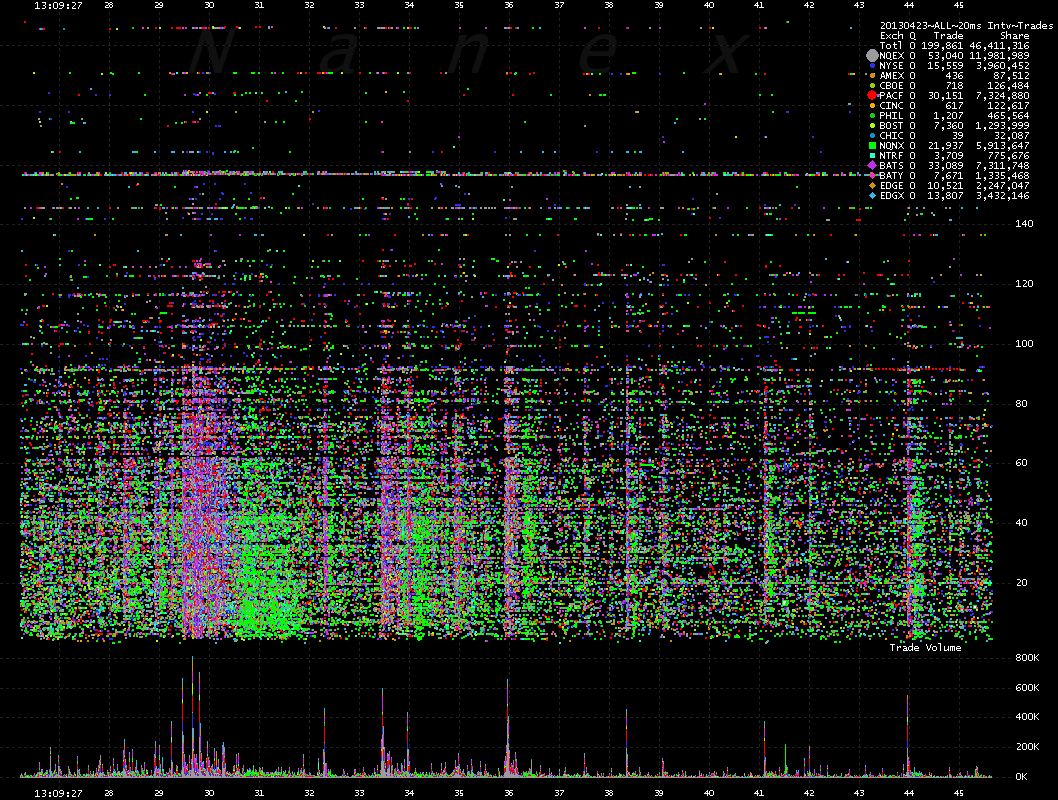
4. Trades for about 8000 NMS stocks priced between 0 and $210. Each dot represents a trade, color coded by reporting exchange.
Note the pulsating of trades in all stocks at the same time. Green dots are from Dark
Pools - they always report late. You are looking at about 5 seconds of time.
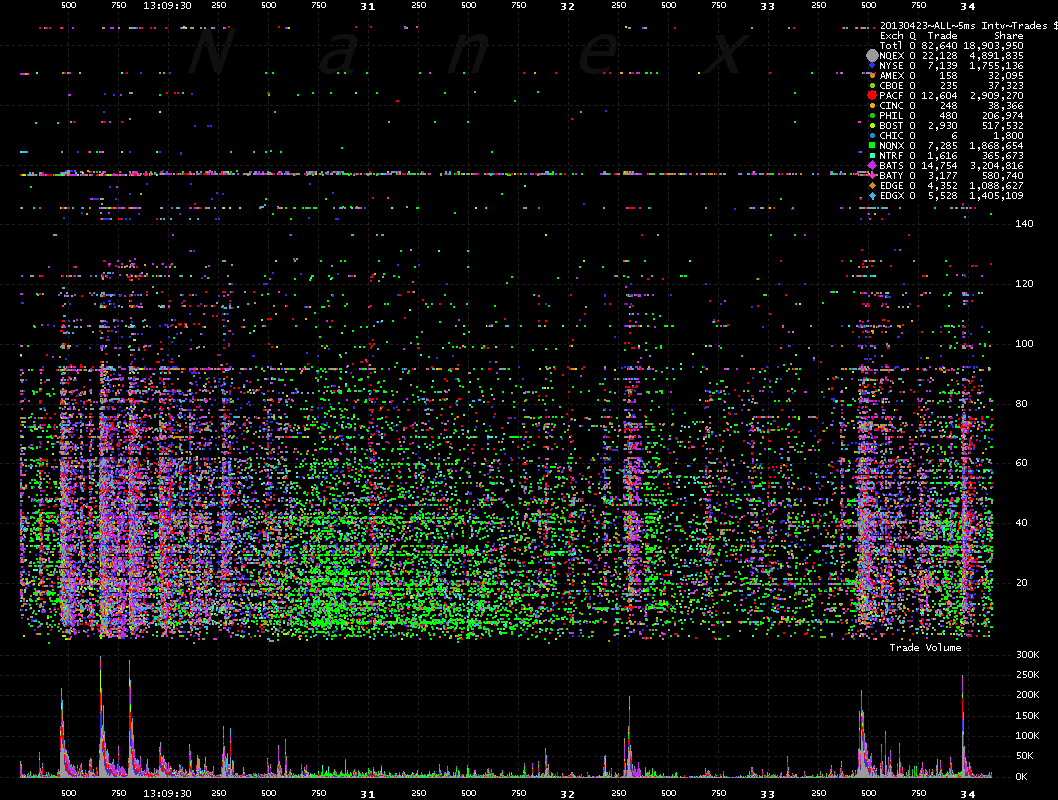
5. Trades for about 8000 NMS stocks priced between 0 and $210. Each dot represents a trade, color coded by reporting exchange.
Chart shows about 2 seconds of time from 13.09.28.982
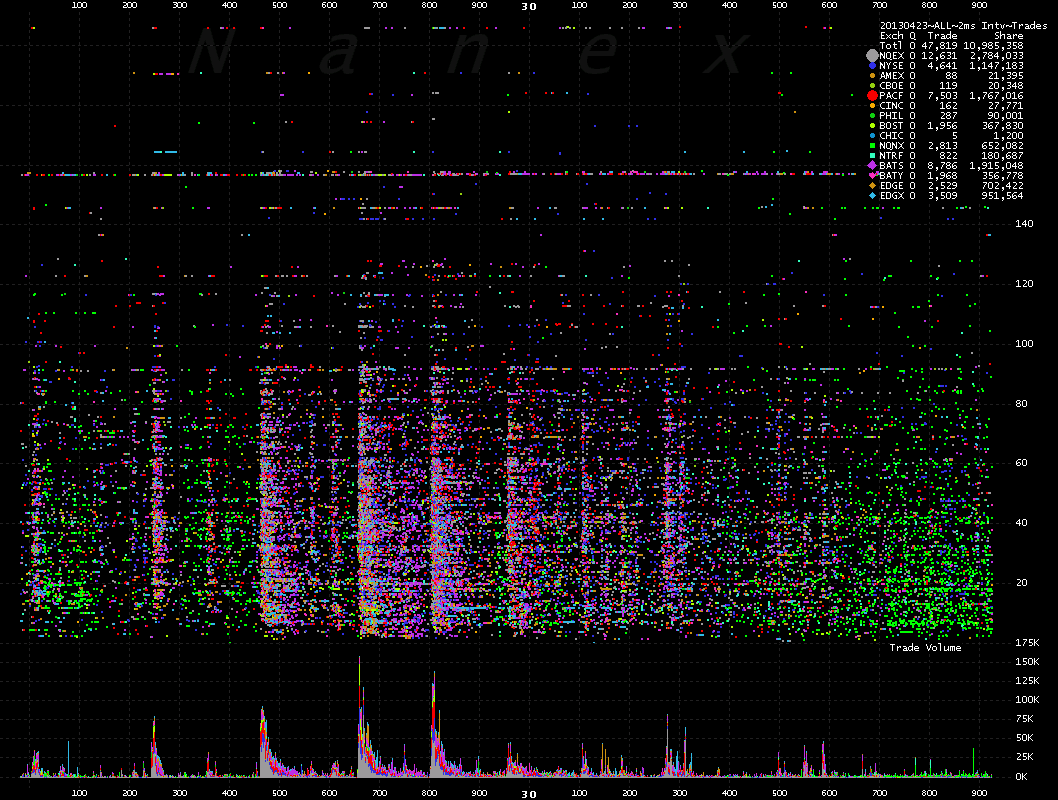
6. Trades for about 8000 NMS stocks priced between 0 and $210. Each dot represents a trade, color coded by reporting exchange.
This chart shows one second of time.
Nanex Research
Inquiries: pr@nanex.net


