Nanex Research

Nanex ~ 29-May-2013 ~ Facebook IPO Order Book Counts
Charts of Order book counts in Nasdaq TotalView (Orderbook) for Facebook stock on the
day of their IPO (May 18, 2012).
-
Link to timeline and more on Facebook IPO.
- Link
to Order Routing Animation during open.
-
Link
to SEC administrative proceeding on this matter.
Update May 30, 2013: added charts 5 and 6.
1. Total Buy Orders (blue) and Sell Orders (green) in Nasdaq TotalView (Orderbook) for Facebook at each 20 second period between 10:45 and 16:00.
Nasdaq used the symbol ZWZZT to test their systems the weeks before the IPO. But the
SEC said they limited the number of orders in this test symbol to just 40,000 (see white
line in chart below). The number of shares offered in Facebook's IPO was 421,233,615.
With an average order size of 100 shares, that works out to 4,212,336 orders, which
is 100 times more than the level they tested with. The actual number of orders was about
375,000. Good software engineers will stress
test at much higher levels than expected - not less.
Compare the white horizontal line (the maximum number of orders tested) with the blue
line (the actual number of buy orders). The white line should have been set much higher.

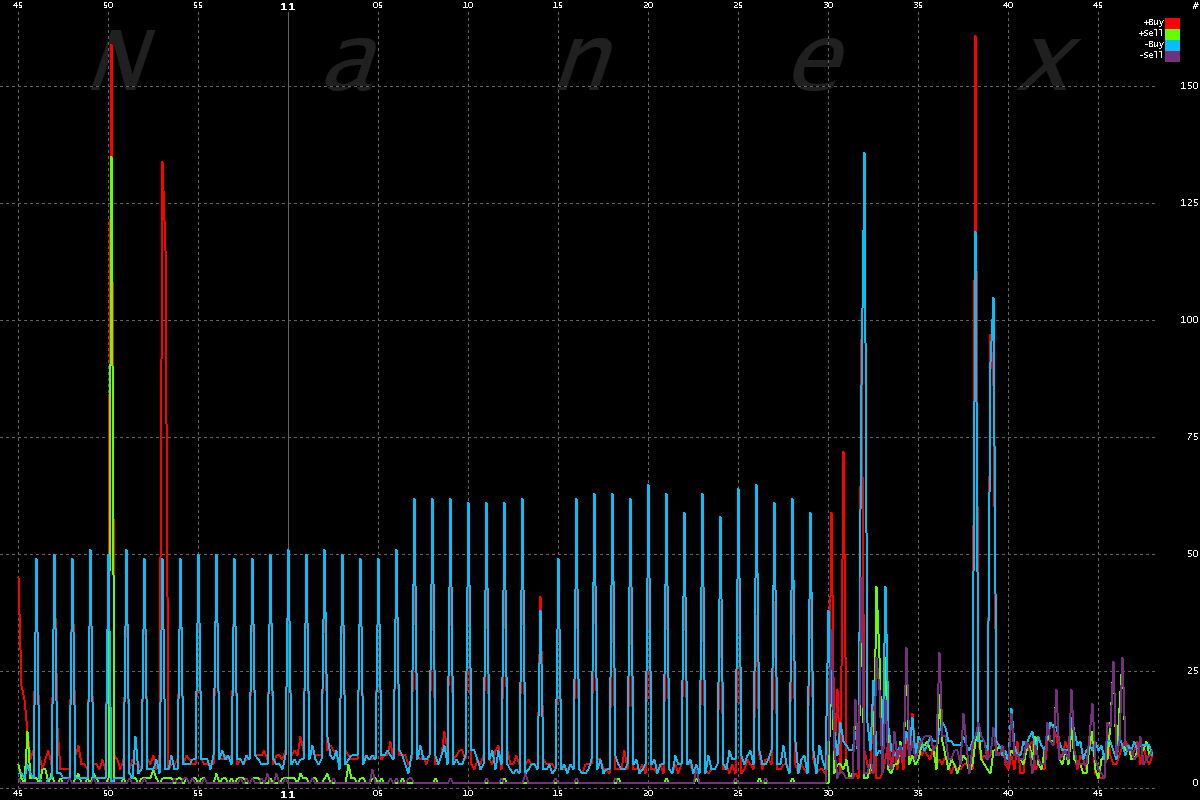
2. 1-millisecond Peak rate of change of buy orders (add:red,cancel:blue) and sell
orders (add:green,cancel:violet) for each 20 second period
between 10:45 and 11:45.
The constant changing of about 50 orders per millisecond (which happened to
occur once a minute, on the minute) is what doomed the Facebook Open. Buy order cancels
(blue line) matches buy order additions (red line - which is obscured behind the blue
line).
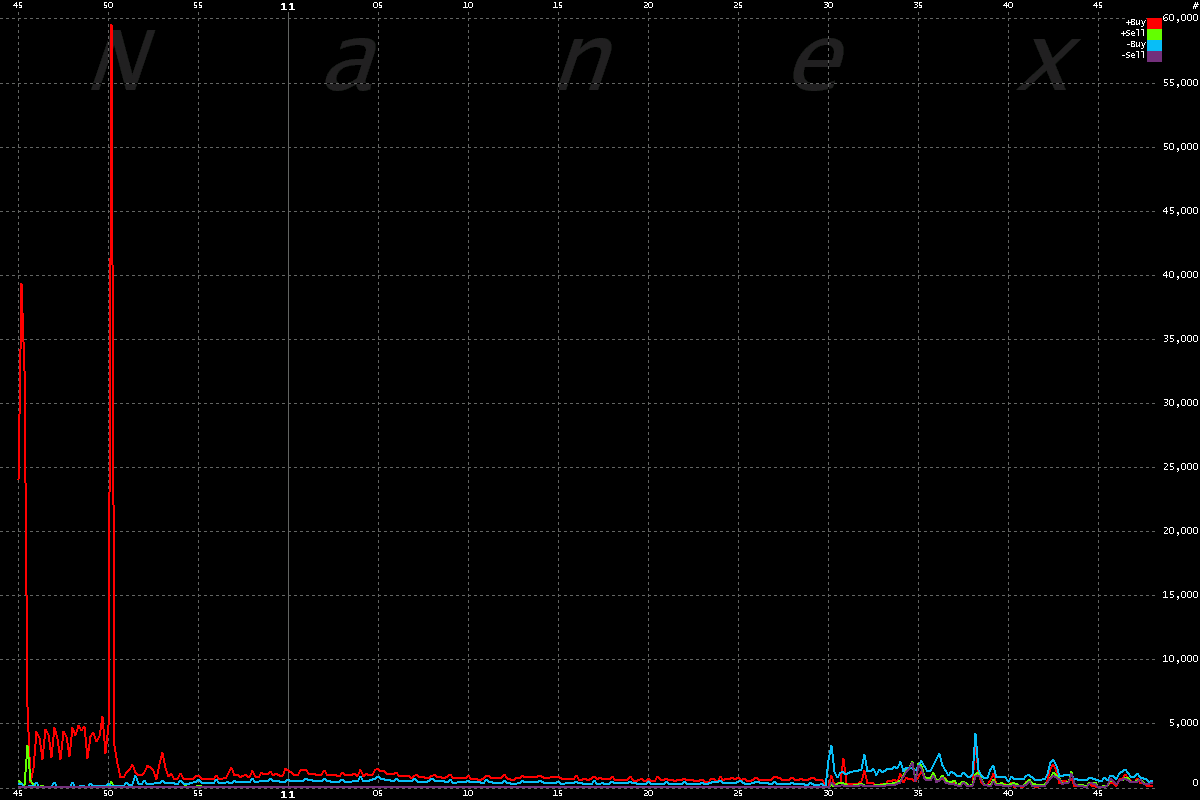
3. Number of changes to buy and sell orders counts for each 20 second period
between 10:45 and 11:45.
Chart 2 shows the highest number of changes per millisecond over each 20 second
period, whereas this chart shows the total number of changes for each 20 second period.
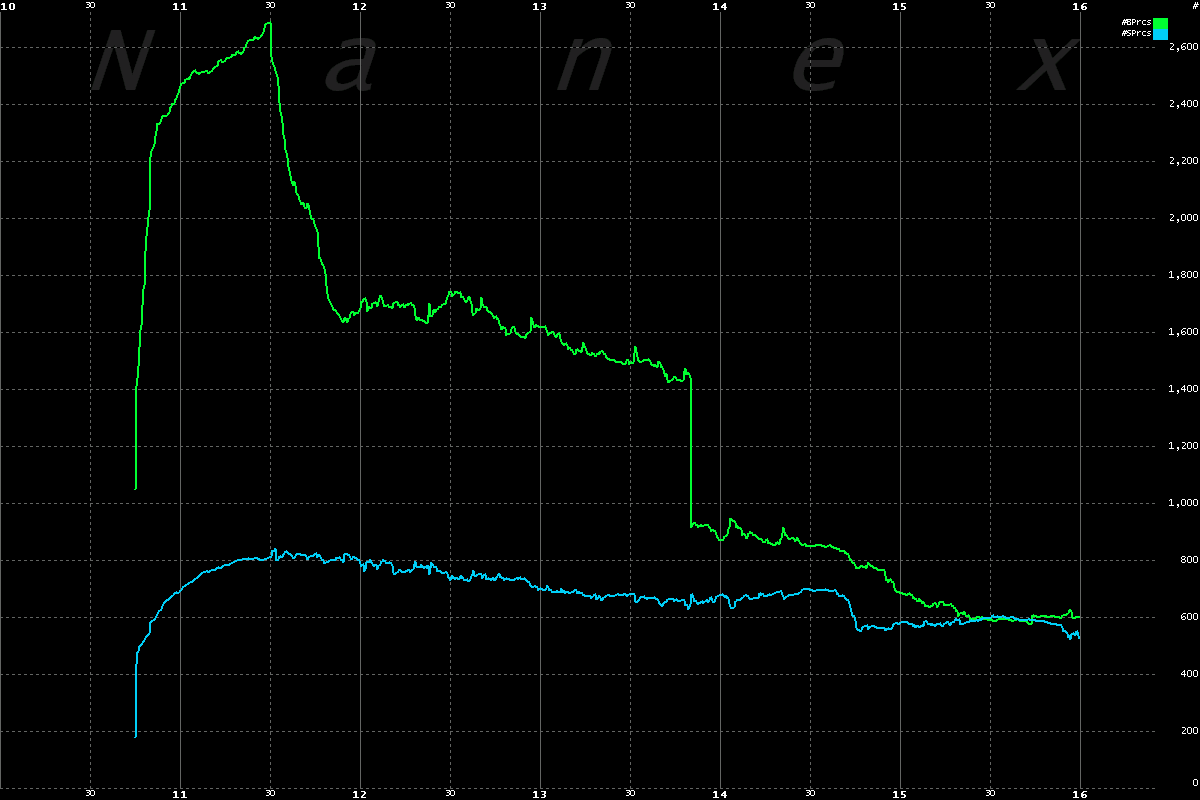
4. Total number unique prices for Buy Orders (green) and Sell Orders (blue).
There were over 2,600 different priced buy orders prior to the open! (42.00, 42.01,
42.02 and so on).
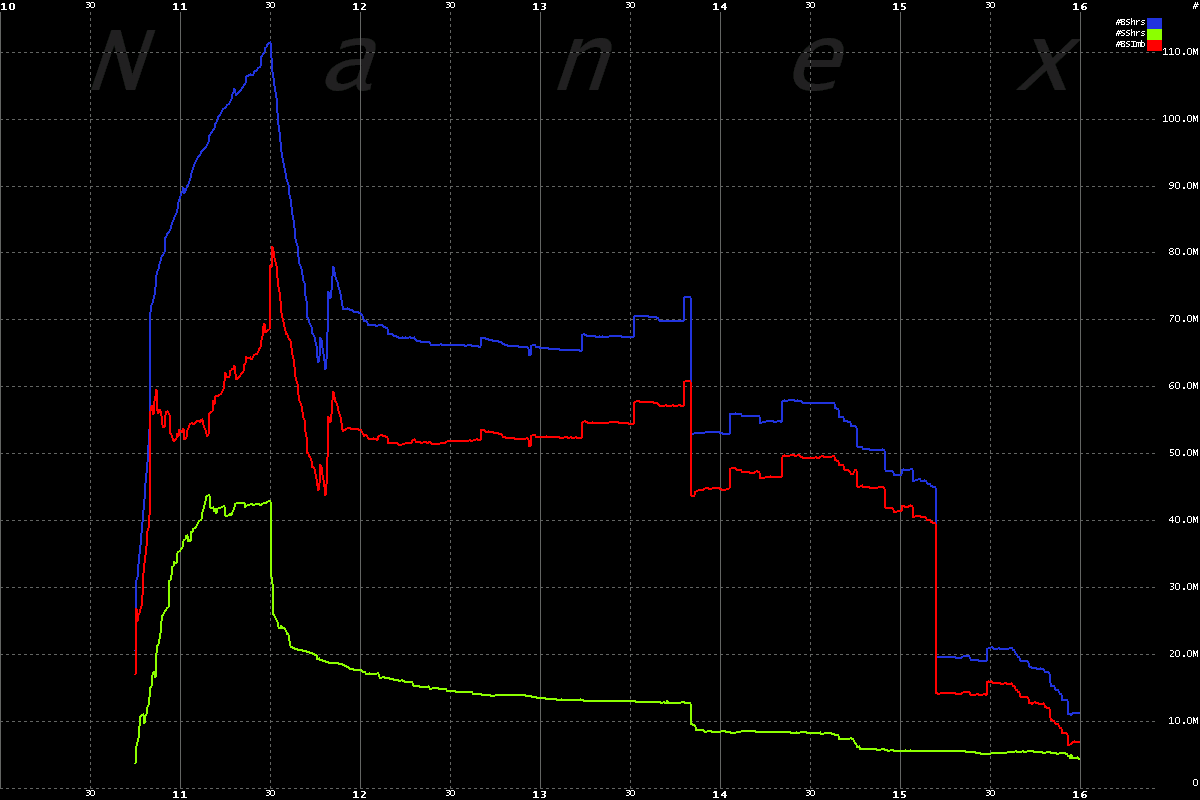
5.Total number shares to buy (blue), sell (green) and imbalance (red) for each
20 second period between 10:45 and 16:00.
Imbalance (red) is simply the number of shares to buy (blue) minus the number of shares
to sell (green).
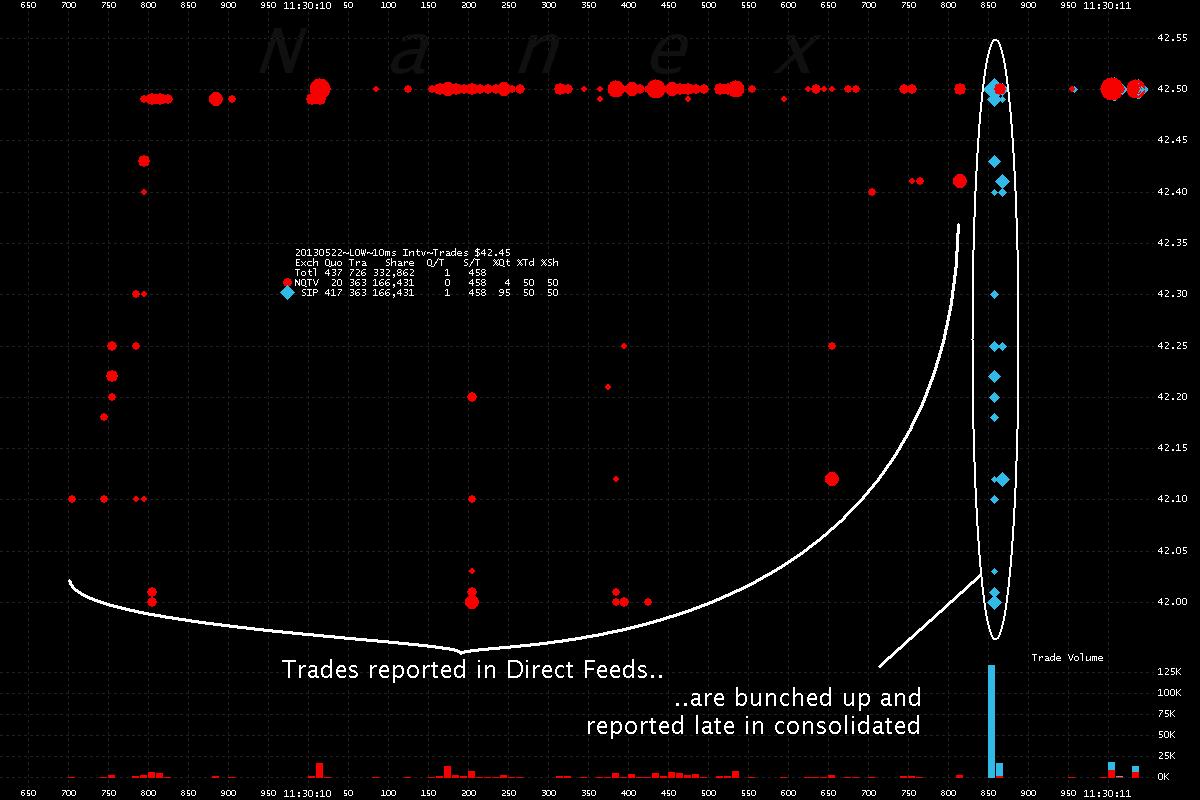
6. Plotting trade execution by timestamp from TotalView (red) and the Consolidated
feed (blue).
Note that some of the initial 360 trades executed on Nasdaq and were available to direct
feed subscribers (High Frequency Traders) as much as a full second earlier. This is
against Reg NMS, but oddly, was not mentioned in the SEC report.
Nanex Research
-
Inquiries: pr@nanex.net


