Nanex Research

Nanex ~ 11-Jun-2013 ~ Clever HFT Manipulation
Manipulation by high frequency trading algorithms doesn't get much clearer than this.
(See more examples
of this same type of manipulation). Once you understand the pattern below, take a look
at these charts of Amgen
during regular market hours.
Contrast the facts in the charts below (along with thousands of others
from this page) with SEC statements and it becomes pretty obvious
that the SEC is telling fairy tales: from a
recent Reuters article:
Most rapid price spikes are caused by old fashioned human mistakes, such as "fat finger" errors, where a trader may accidentally add an extra zero to an order, or by portfolio managers accidentally requesting a large order be immediately executed rather than meted out in a managed flow, Berman said.
"Contrary to public speculation, these types of events do not seem to triggered by proprietary high-speed algorithms, by robots gone wild, or by excessive order cancellations."
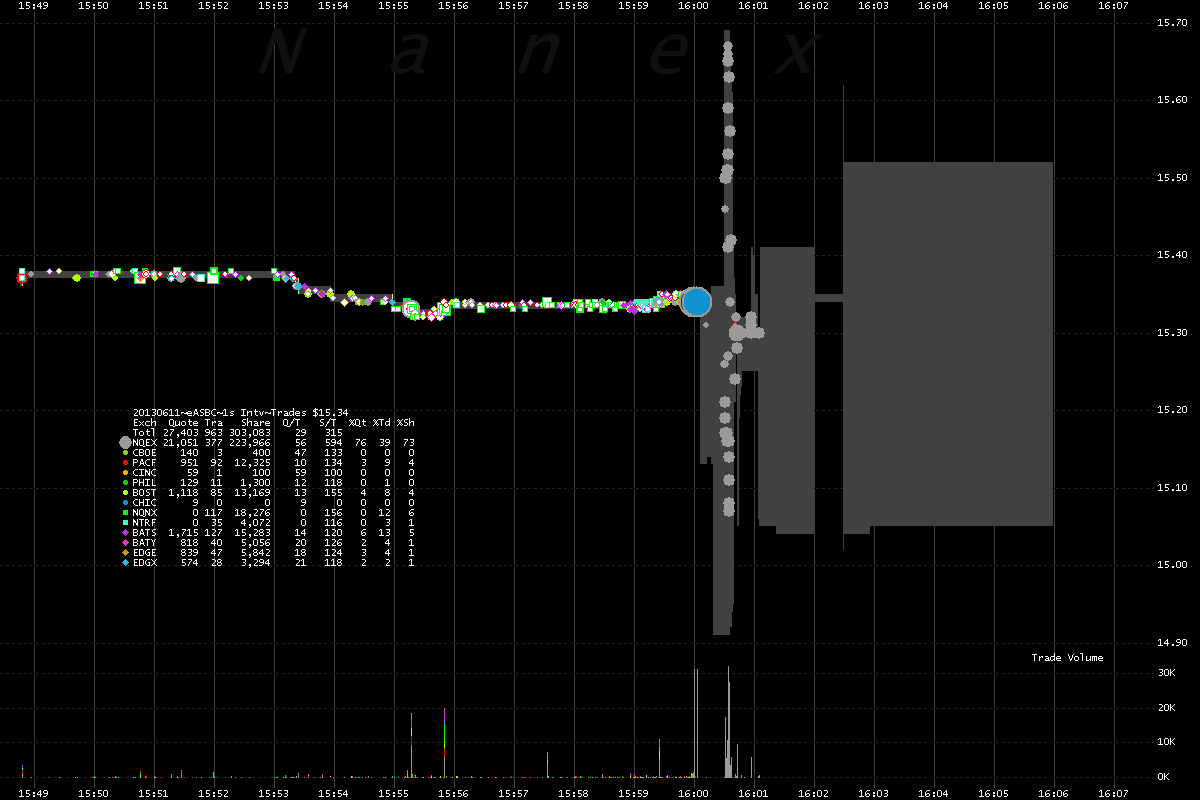
1. ASBC trades color coded by exchange and NBBO shaded gray.
As soon as the market closed (16:00), the NBBO (National Best Bid/Offer) rapidly expanded.
What happened next will astound you..
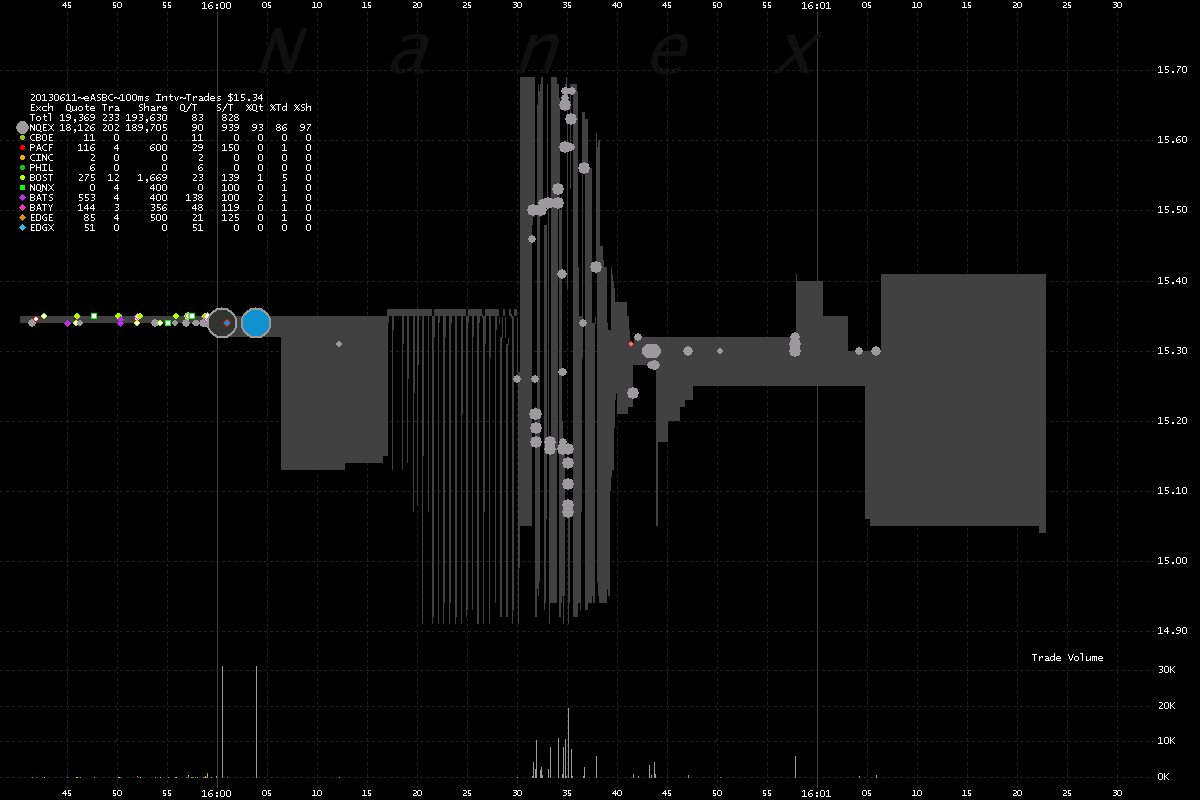
2. ASBC trades color coded by exchange and NBBO shaded gray. Zooming to about 2 minutes of time.
Zooming in to this level, you can see the trades at Nasdaq (gray dots) scattered between
$15.05 to $15:67.
Also, the wisps of gray lines shows the NBBO (best bid/ask) is changing rapidly.
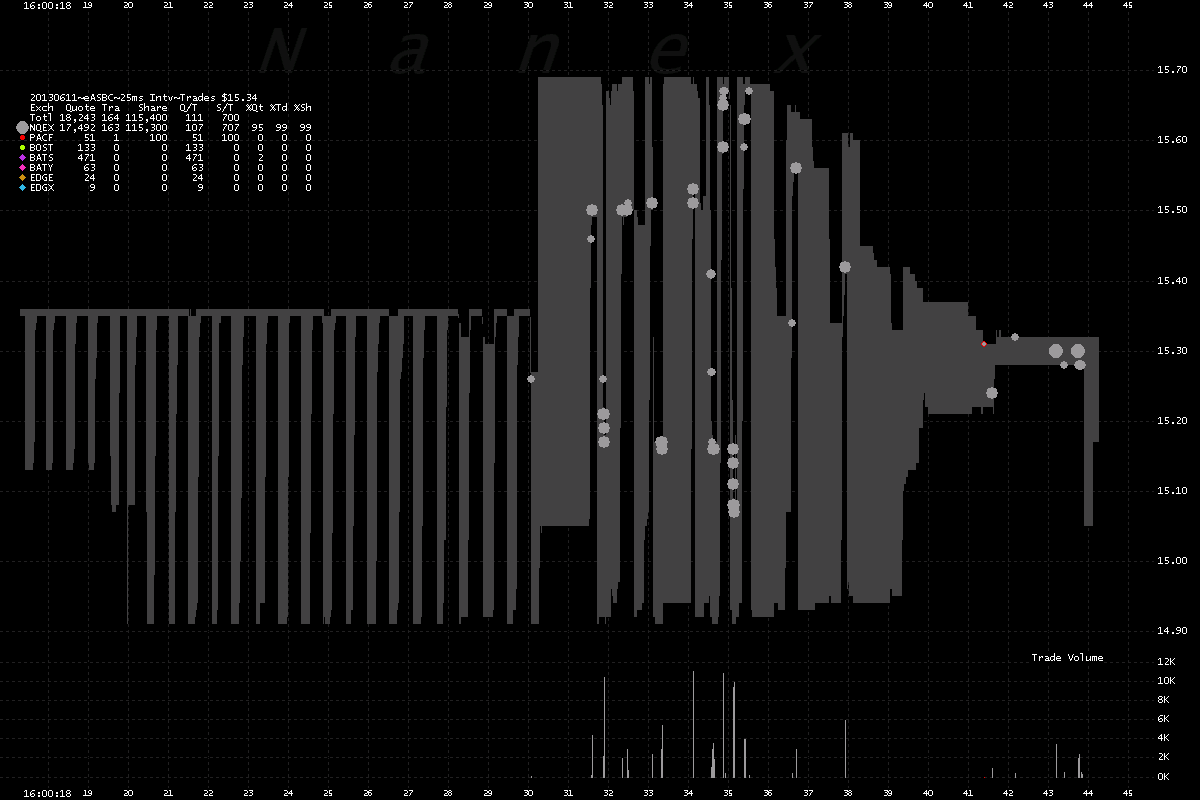
3. ASBC trades color coded by exchange and NBBO shaded gray. Zooming to about 27 seconds of time.
Zooming to this level, we can make out the wild swings in the NBBO. Incredible!
The bottom of the gray shading is the best bid (the price someone is willing to pay),
the top is the best ask (the price that someone will sell at).
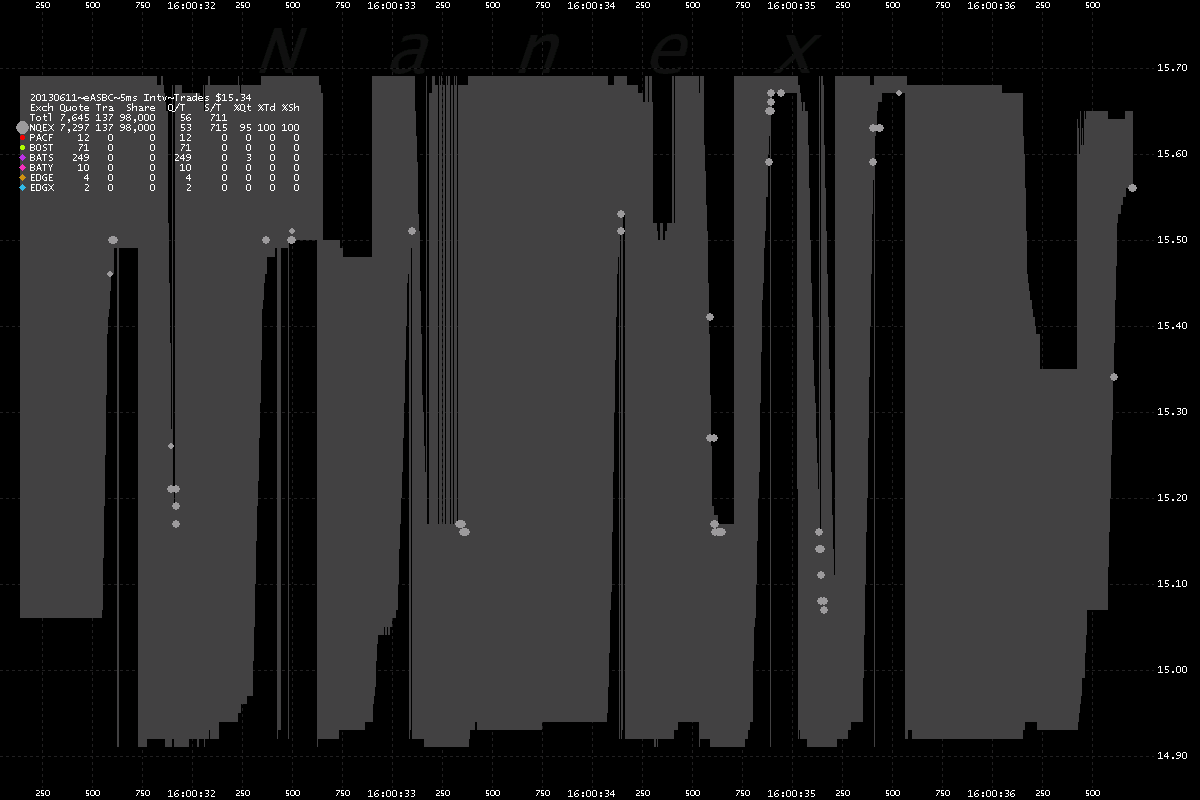
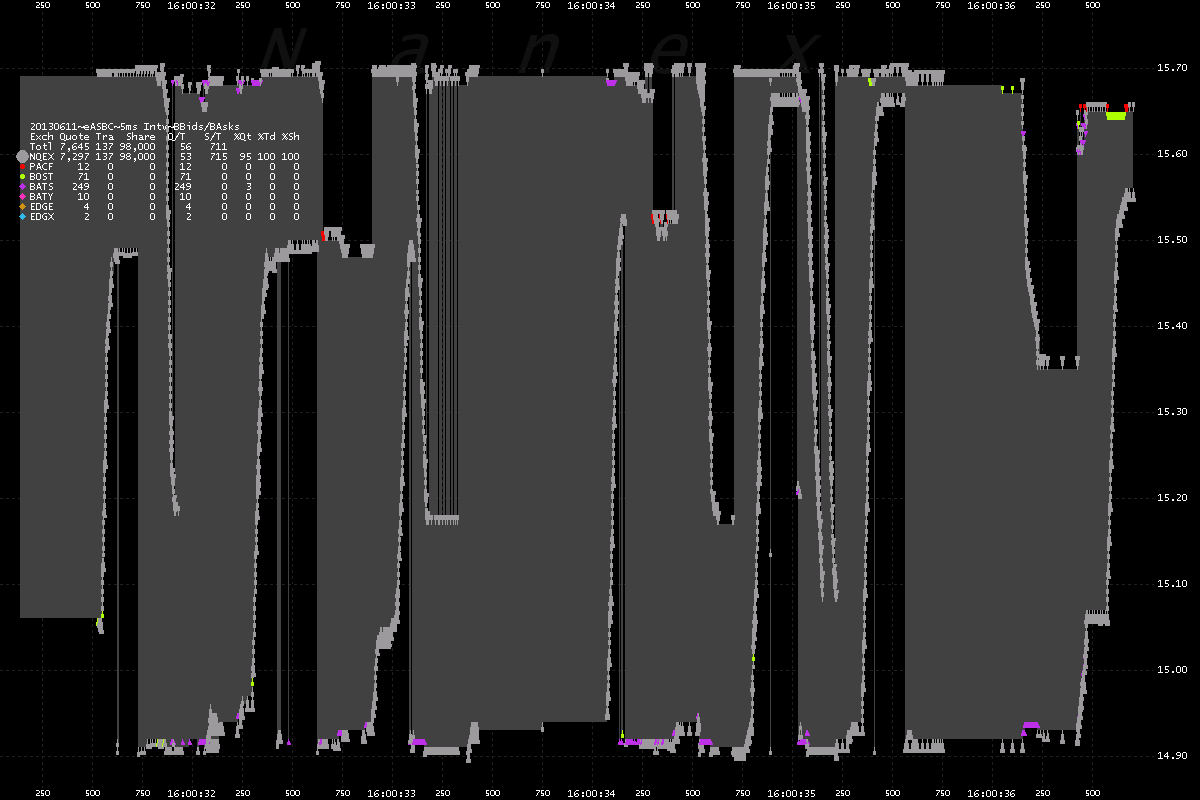
4. ASBC trades color coded by exchange and NBBO shaded gray. Zooming to 5 seconds of time.
At this level, you can see the NBBO is actually changing even more wildly than we could
see in the previous charts.
5. ASBC trades color coded by exchange and NBBO shaded gray. Zooming to 1 second
of time.
At this level of time, you can see that the trades (gray dots) near the top end of the
range executed at the best bid (bottom of the shading), while the trades near the lower end of the range executed
at the best ask (top of the shading).
Which means there is
aggressive buying low and selling high. So who is on the other side: selling
low and buying high?
Pretty clever HFT manipulation.
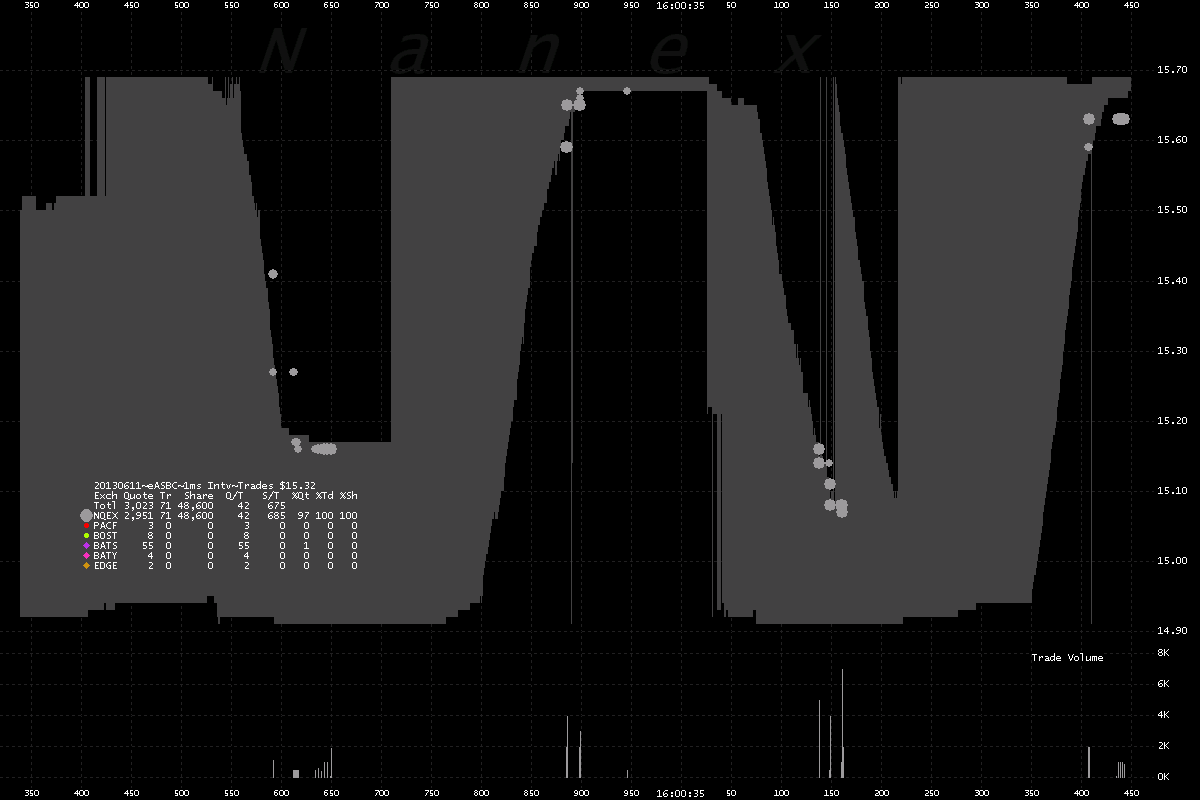
6. ASBC bids and asks color coded by exchange and NBBO shaded gray. These charts
are the same as above, but show best bids and offers for a different view.
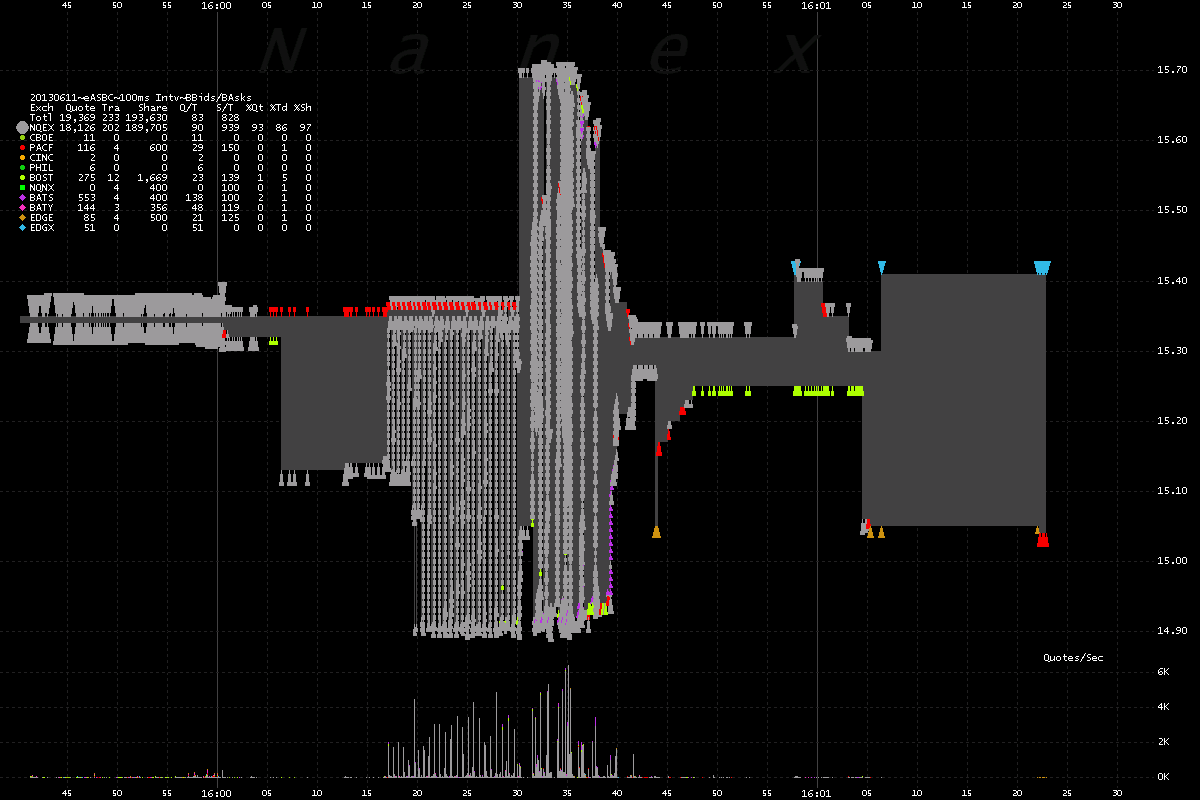
7. Zoom-2 ASBC bids and asks color coded by exchange and NBBO shaded gray. Zooming to about 27 seconds of time
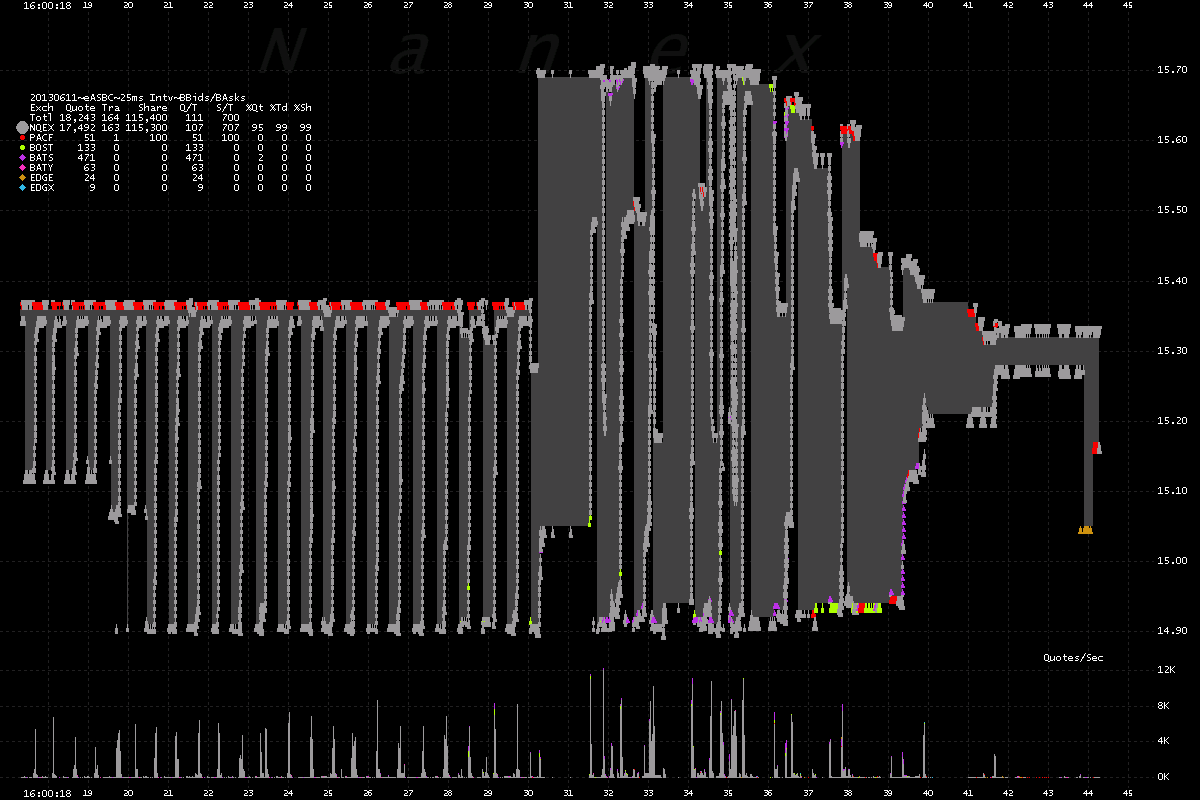
8. Zoom-3 ASBC bids and asks color coded by exchange and NBBO shaded gray. Zooming to 5 seconds of time.
Nanex Research
Inquiries: pr@nanex.net


