Nanex Research

Nanex ~ 03-Jul-2013 ~ IWN Price Anomaly
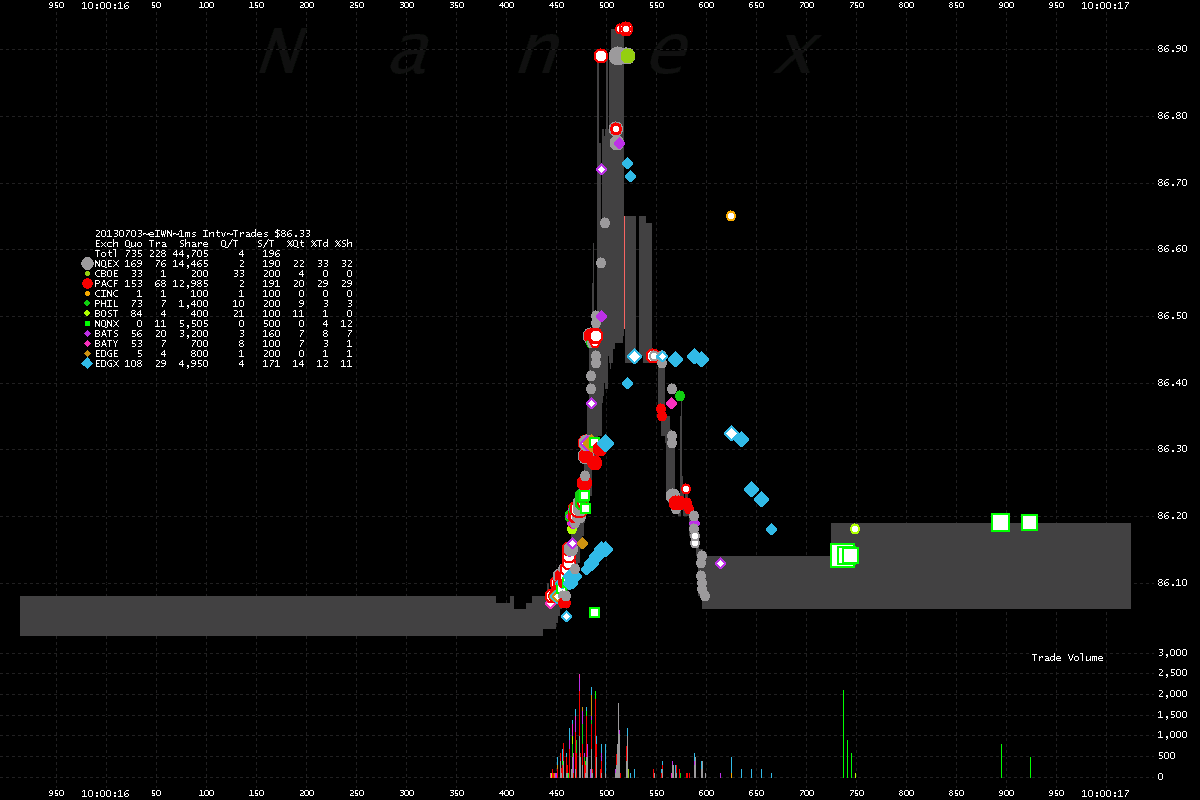
On July 3, 2013 at 10:30 sharp, the ETF symbol IWN (Russell 2000 Value Index) shot 1%
higher in 50 milliseconds, then just as quickly, sank right back where it started. A
total of 228 trades (44,705 shares) from 10 exchanges plus dark pools participated.
There were a whopping 4 quotes (orders at the top of the book) for every trade. We understand
how a "fat finger" could cause a stock to rocket higher or plummet lower, but what would
cause a near instantaneous return to the original prices?
1. IWN trades color coded by exchange and NBBO. Chart shows 1 second of time!
Note the late trade reports from EDGX (blue diamonds) and CINC (orange dot). The market
moved faster than information could be processed by the consolidated feed.

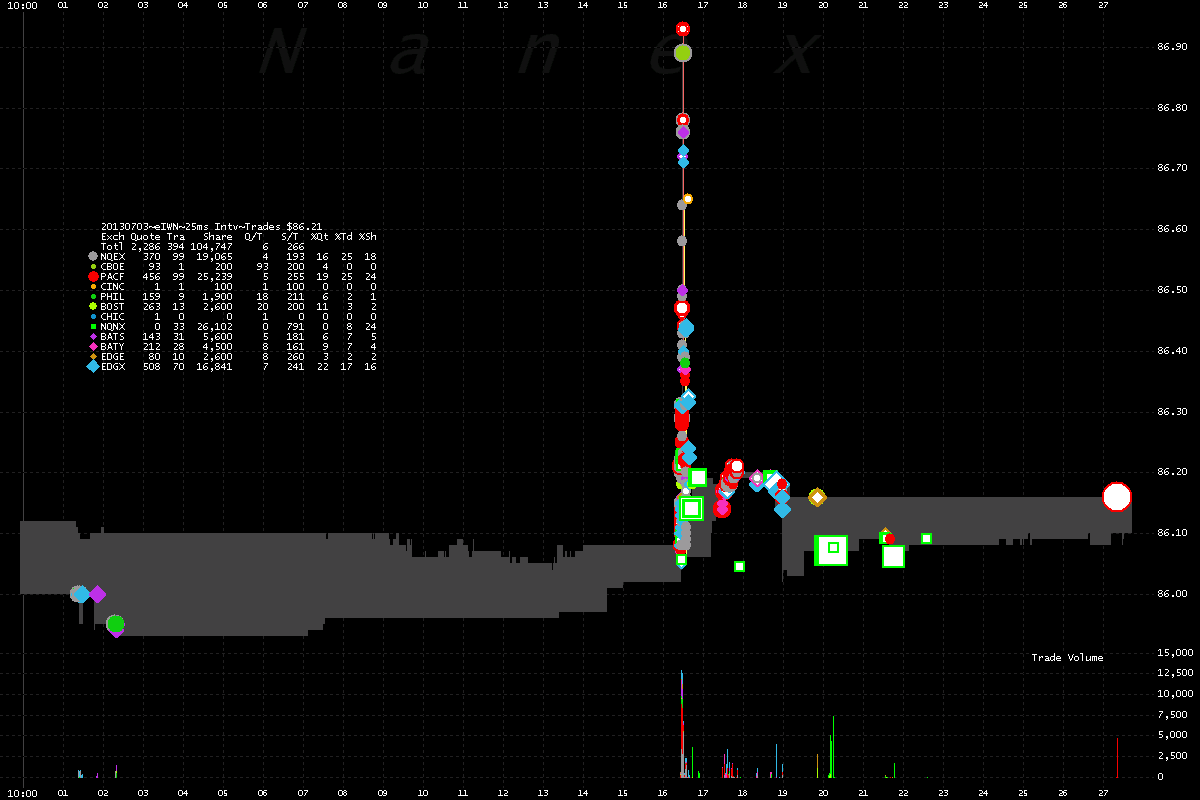
2. IWN trades color coded by exchange and NBBO. Zooming out to 27 seconds of
time.
Note how quiet trading was before the sudden explosion.

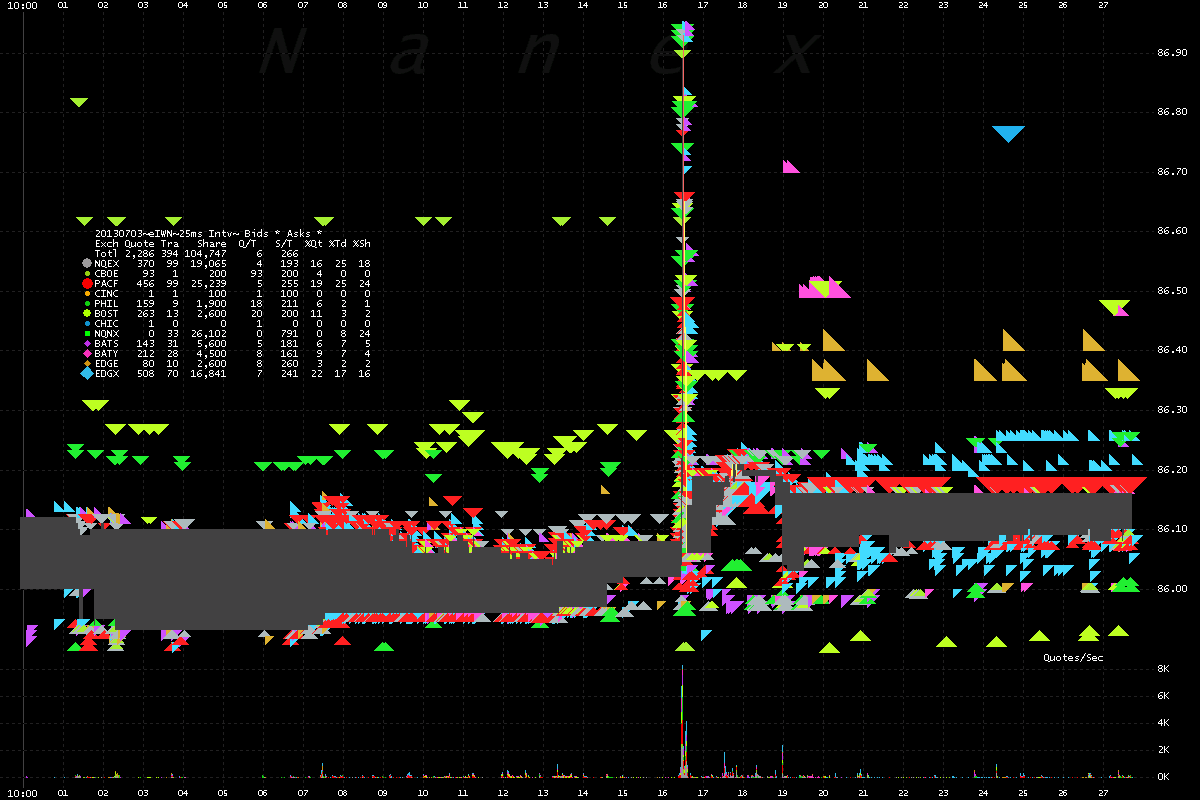
3. IWN bids and asks color coded by exchange and NBBO.
An average of 6 quotes (top of book orders) for every trade in the 27 seconds of time
shown in the chart below.

Nanex Research
Inquiries: pr@nanex.net


