Nanex Research

Nanex ~ 23-Jul-2013 ~ The 10:30am Energy Trading Game
Every Wednesday at 10:30 (ET), the EIA puts out a weekly estimate of petroleum inventories.
This is known as the
EIA Petroluem Status Report. The release of this information
often causes an explosion of trading activity in Crude Oil futures (and related products).
During the first second after 10:30:00, prices often move more than the entire trading
session's range (high - low) up to that point in time. This one second period of time is also among the most active seconds of trading
in Crude Oil futures.
Every Thursday at 10:30 (ET), the EIA puts out another report, the
EIA Natural Gas Report, which has the same effect on
Natural Gas futures (and related products) that the Petroleum Status Report had on the
Crude Oil complex. Often, Natural gas prices will move so much in a fraction of a second,
that
some market observers (economists) might think there was an actual real-world explosion that wiped out a quarter
of the world's natural gas supplies.
Click, for,
examples.
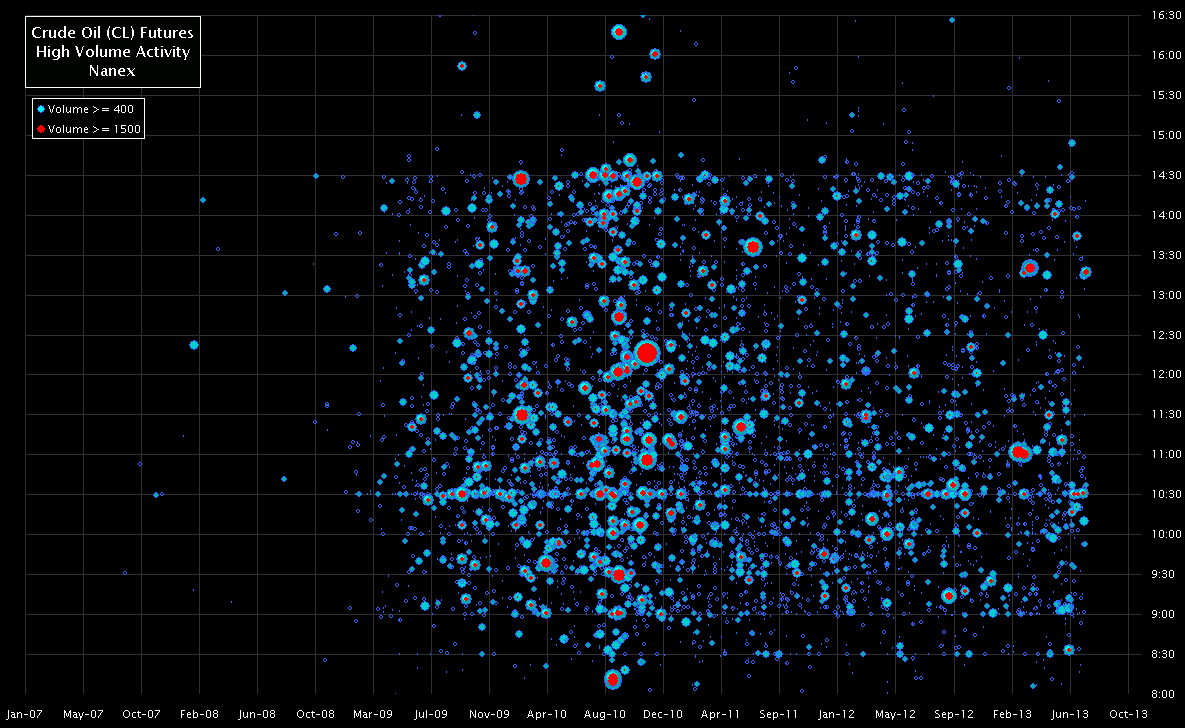
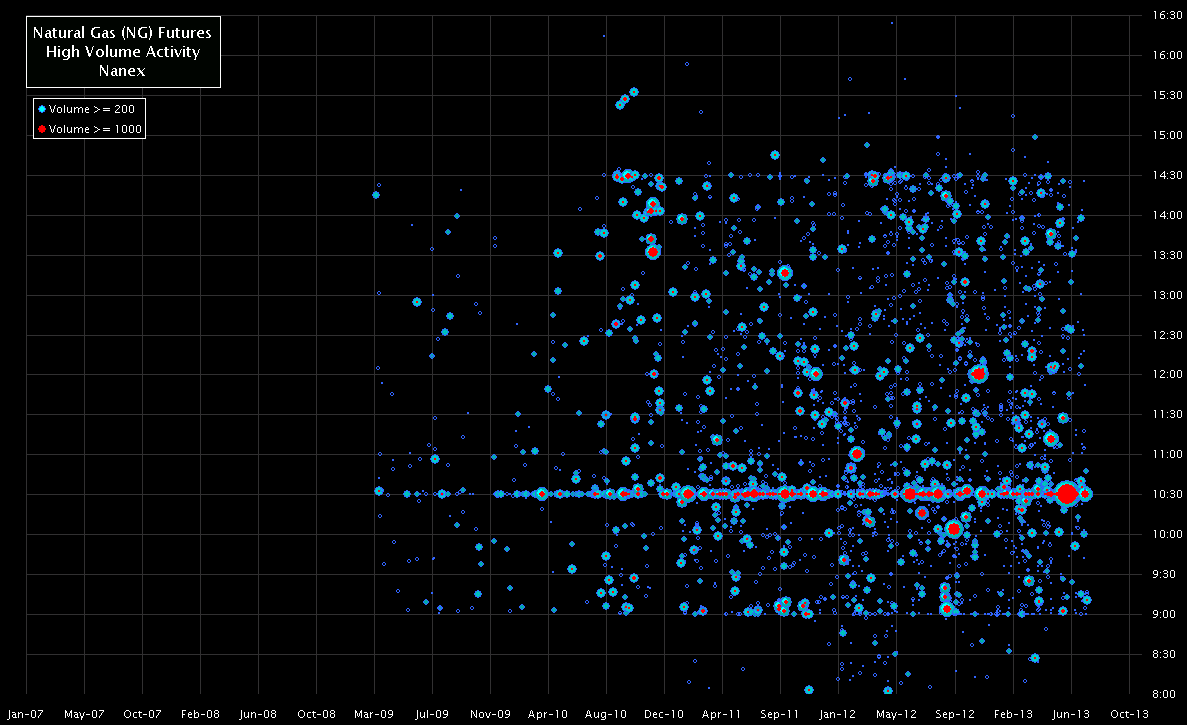
The charts below plot the date, time and relative size of every short-term explosion in trading activity for Crude Oil futures
(chart 1) and Natural Gas futures (chart 2) since 2003. Note that these charts only plot from January 2007: that is because before then (at least back to 2003), there were zero instances that qualified to make this list. In other words, these trading frenzies are caused by high frequency
trading - which didn't reach speeds capable of causing suitably excessive mayhem until
late 2007.
1. Crude Oil Futures (CL). Tune in Wednesdays at 10:30 ET (note the consistent
occurrence of dots along the 10:30 line - this is more pronounced in Natural Gas:
see Chart 2 below).

2. Natural Gas Futures (NG). Tune in Thursdays at 10:30 ET to watch the trading
frenzy (note the almost solid wall of red dots over the years landing on 10:30).

Nanex Research
Inquiries: pr@nanex.net


