Nanex Research

Nanex ~ 23-Jul-2013 ~ CFTC, Panther Hunter
On July 22, 2013, the CFTC issued a press release:
CFTC
Orders Panther Energy Trading to Pay $2.8 Million and Bans Them from Trading for
One Year, for Spoofing in Numerous Commodity Futures Contracts
We immediately recognized this as a watershed event, because the CFTC essentially confirmed
and validated what we and others have pointed out repeatedly over the years. The practice
of spoofing, or sending in fake orders in order to gain information about what other
investors, traders and other algorithms are doing, is the corner stone of most High
Frequency Trading strategies (HFT). Let us exclude the well capitalized market makers
who earn the majority of their trading profits by simply making the bid/ask spread,
and the stat-arb based HFT who earn the majority of their profits from existing pricing
efficiencies between two markets. The HFT lobby will mostly tell you that all HFT are
market makers - stat-arb sounds too scary. But there is a third kind of HFT strategy,
and it starts with taking shortcuts.
Sooner or later, algo designers realize that all HFT market making and stat-arb algos
depend on market prices for input. Market prices would be buy and sell orders added,
removed or executed in any stock, option or future traded in the immediate vicinity
(as in within 1000 feet, or as close as possble). All HFT algos are based on speed. It
has to be that way, because it takes way too long to validate anything with the world
outside of the colocated network.
We wrote an algorithm to hunt through our data and look for real-world examples of this specific spoofing
incident, based on information in the CFTC and other press releases. It was pretty easy to find.
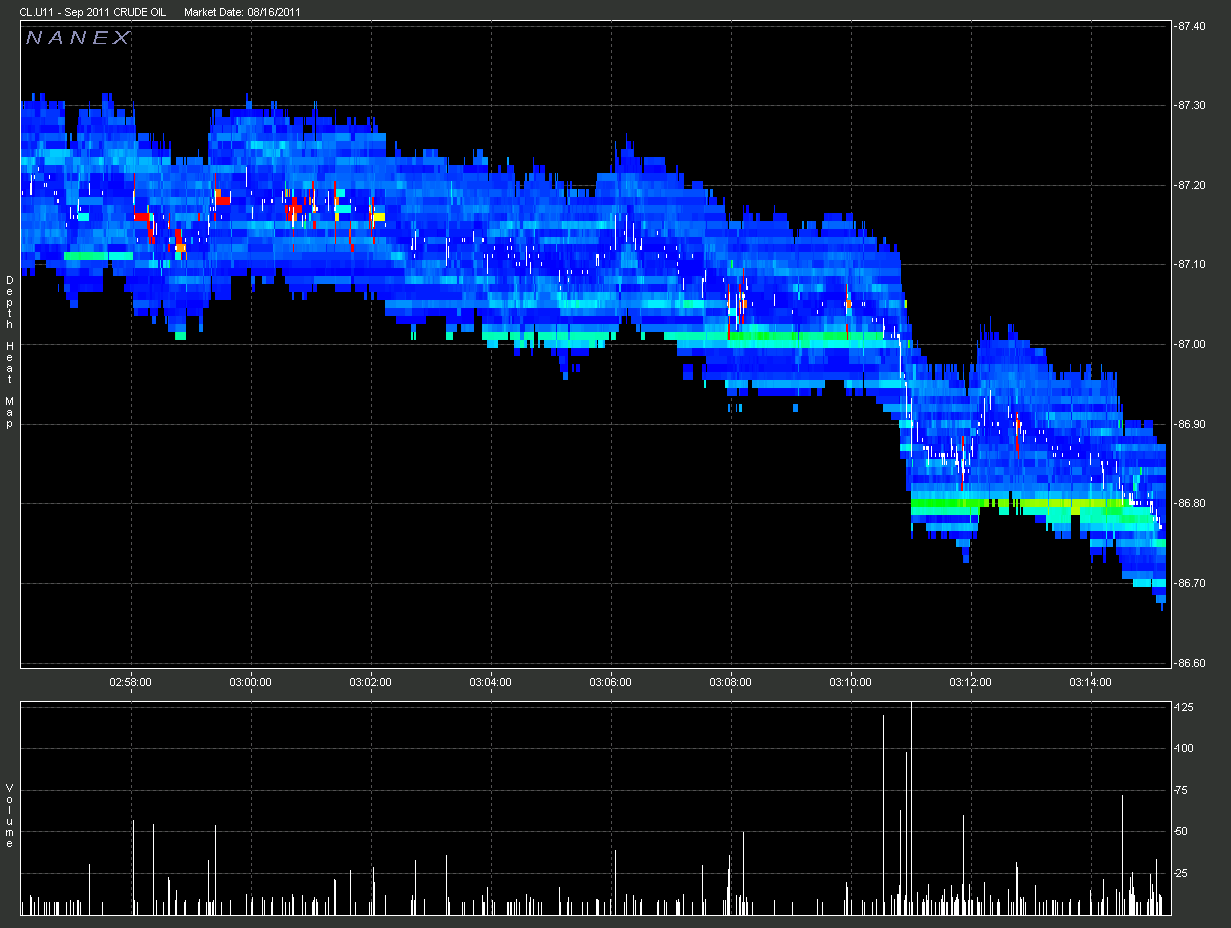
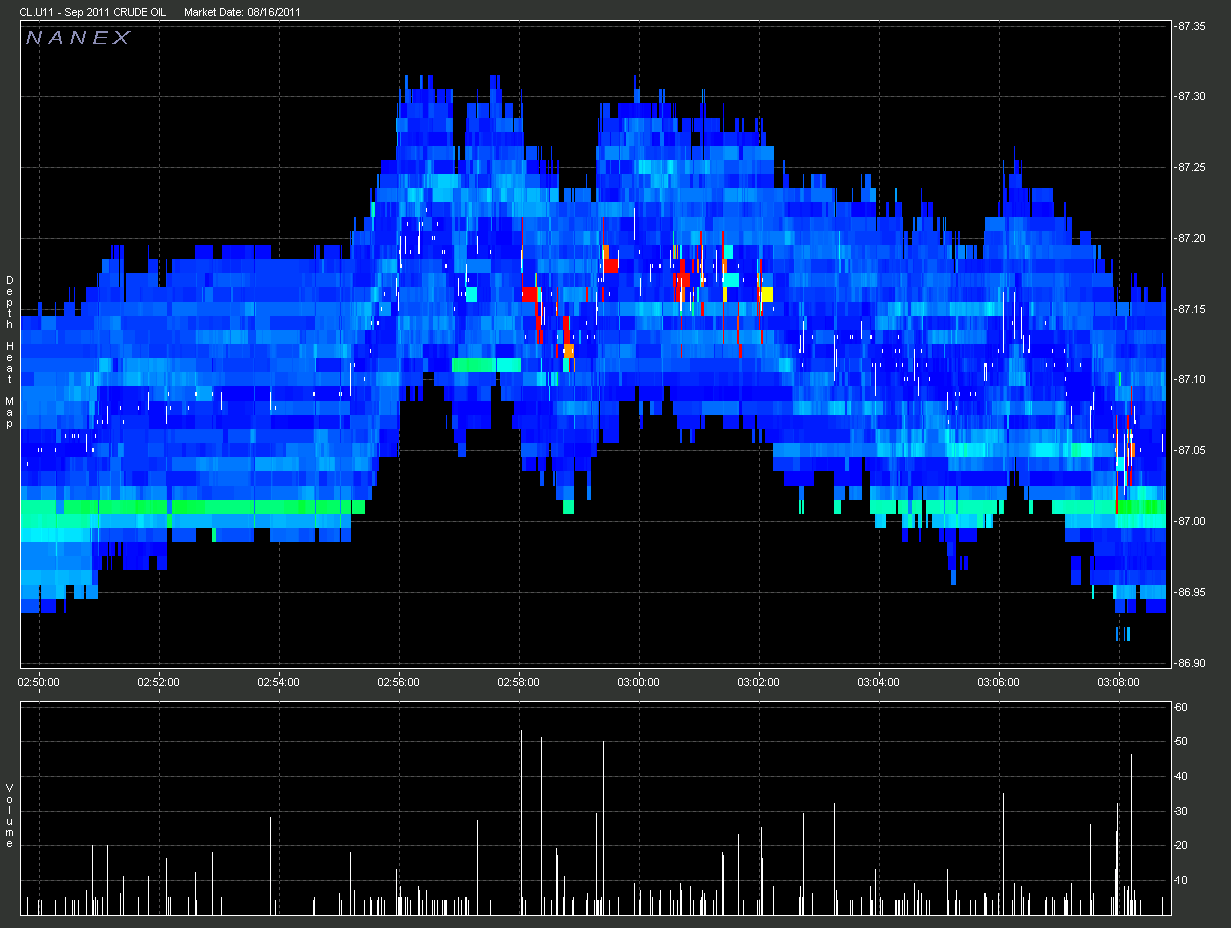
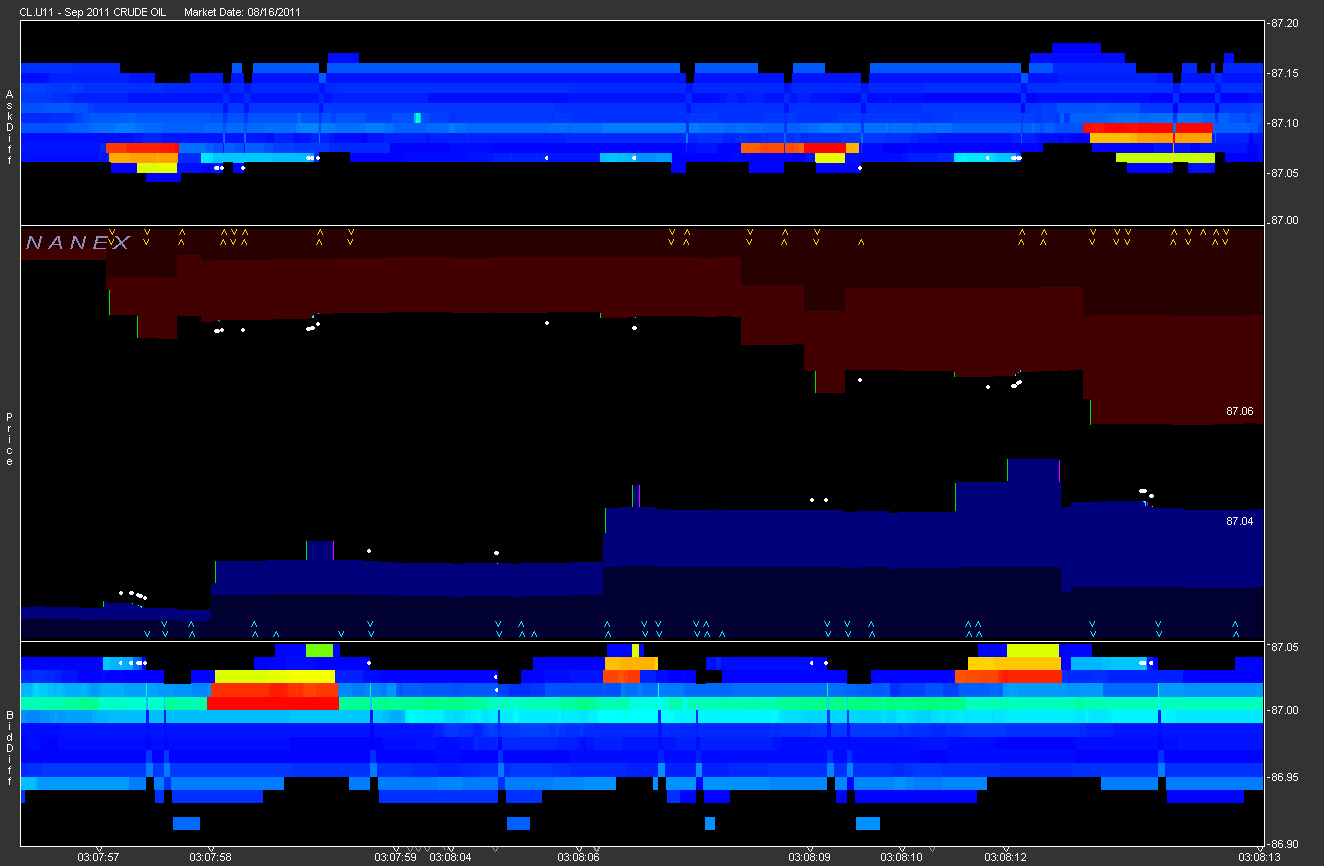
Below is just the tip of the iceberg. All images are depth of book charts for August 16, 2011 trading
in the September 2011 Crude Oil Futures contract (NYMEX - CL). We
are showing just 1 contract to keep it simple - we found the algo operating in many
contracts. It likes to place and cancel orders with sizes 66, 77, 88, 99, 122, 133,
144, 155, and 166. We are sure there will be other sizes and permutations as they become
more sophisticated over time: learning how to hide their spoofing activity.
The FSA put out a nice PDF animation
which illustrates one of these spoofing events. Based on our data, we believe the event
shown in their example was from October 2011 ICE Brent Crude (LCO.V11) futures contract
on September 8, 2011 at 7:58:34 ET.
1. Set 1. The red vertical lines are when the spoofing algo is running. That
isn't normal.

2. Zoom of Chart 1.

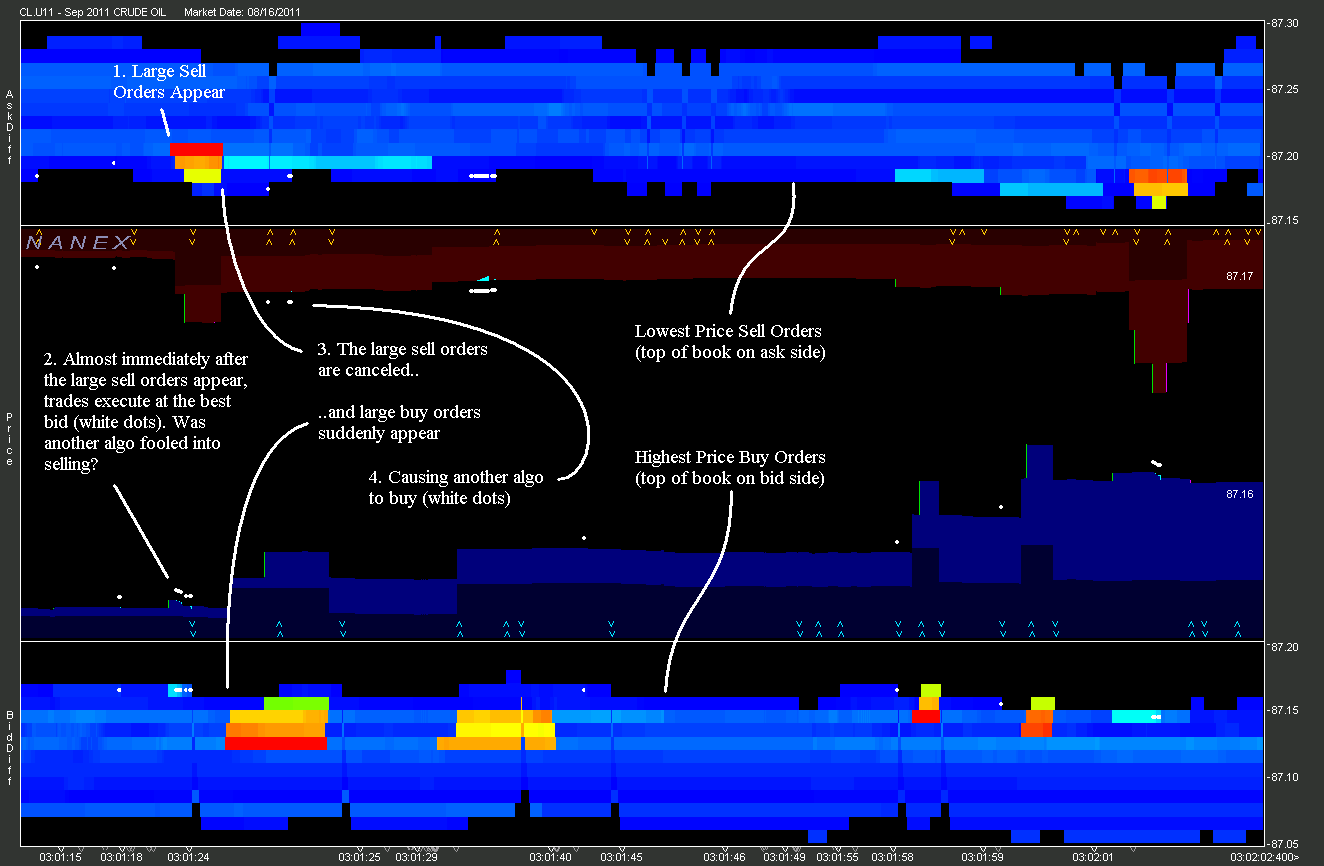
3. Zooming in on an area from Chart 2.
Study the pattern labelled 1 - 4 in the chart below. It will repeat in the other charts
and will be easy to spot once you know what it looks like.
The algo places large orders on the opposite side of the book (which show up as red,
orange and yellow depending on how large they are). Note when the color appears on one
side, trades (white dots), execute on the other side. That is, large sell orders are
immediately followed by trades at the bid, then the large orders disappear. Often the
large orders immediately appear on the other side of the book.

4. Zooming in on another area from Chart 2.

Additional Examples.
Nanex Research
Inquiries: pr@nanex.net


