Nanex Research

Nanex ~ 06-Sep-2013 ~ HFT Rocks Chevron
On September 6, 2013, beginning at 15:59:23, the stock of Chevron Corporation (Symbol
CVX, market capitalization $234 Billion) was rocked by an HFT algorithm gone awry. No
longer can the High Frequency Traders (HFT) or exchanges blame this on humans. Or a
fat finger. Or a market order. Or a glitch involving a squirrel. No, this
can only be the work of HFT computers delirious from dollar signs flashing in their CPUs all day
(or their owners wanting to buy a bigger boat).
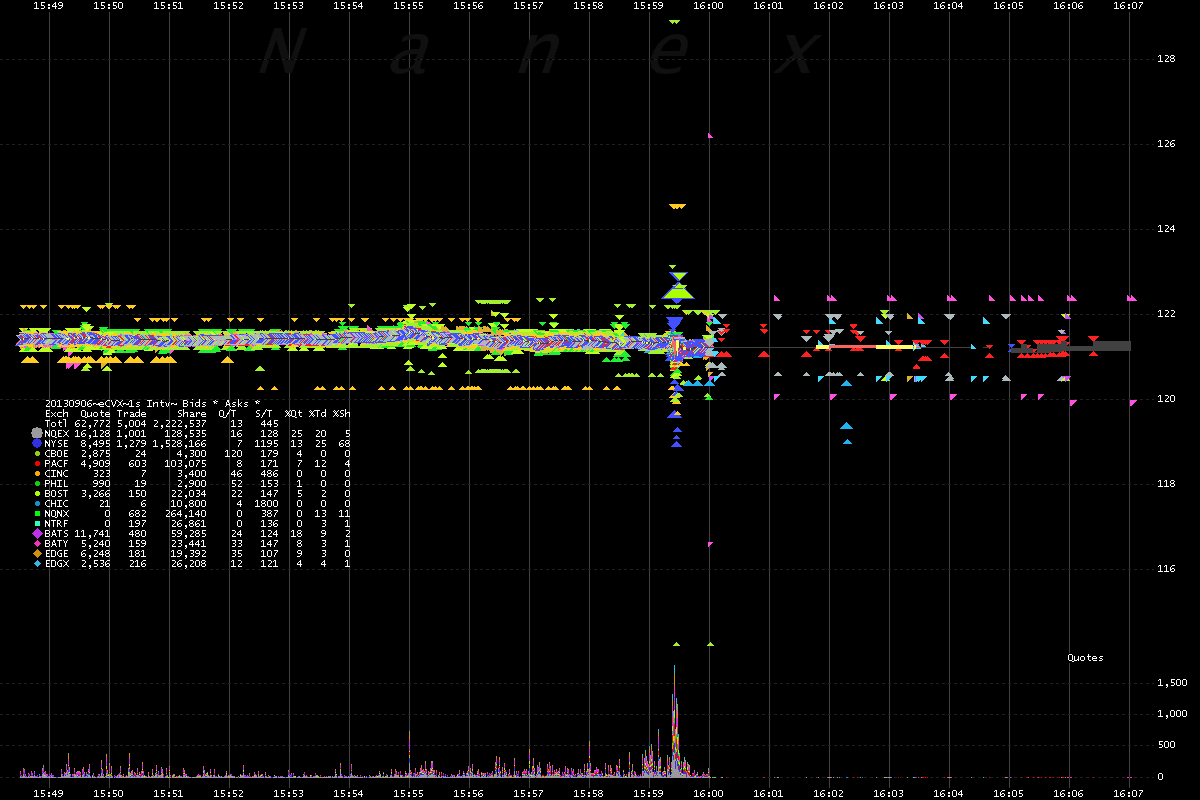
The charts below show the price of Chevron oscillating about twice per second over 8
seconds: at first in a 50 cent range, gradually building until the price swings over
$3 in less than a second.
We've seen this algo pattern
many times before, so many times, that we've given it a name: Whac-a-mole.
Incredibly, we see quotes from 12 exchanges actively participating in this ruse. There
are more than 5 orders placed and canceled for every trade during this event, at rates approaching 20,000 per second: a level that one exchange blamed
for causing a 3 hour black-out.
We believe this type of algorithm operates all the time - but at levels that are hard
to detect. Every so often, something about the algo misfires and exposes its manipulative
ways. If you are wondering what the SEC is doing about this, so are we. In fact, just
two months ago we alerted them about a similar event (in a smaller stock) that was caused
by this HFT algo. Maybe they want a bigger boat too.
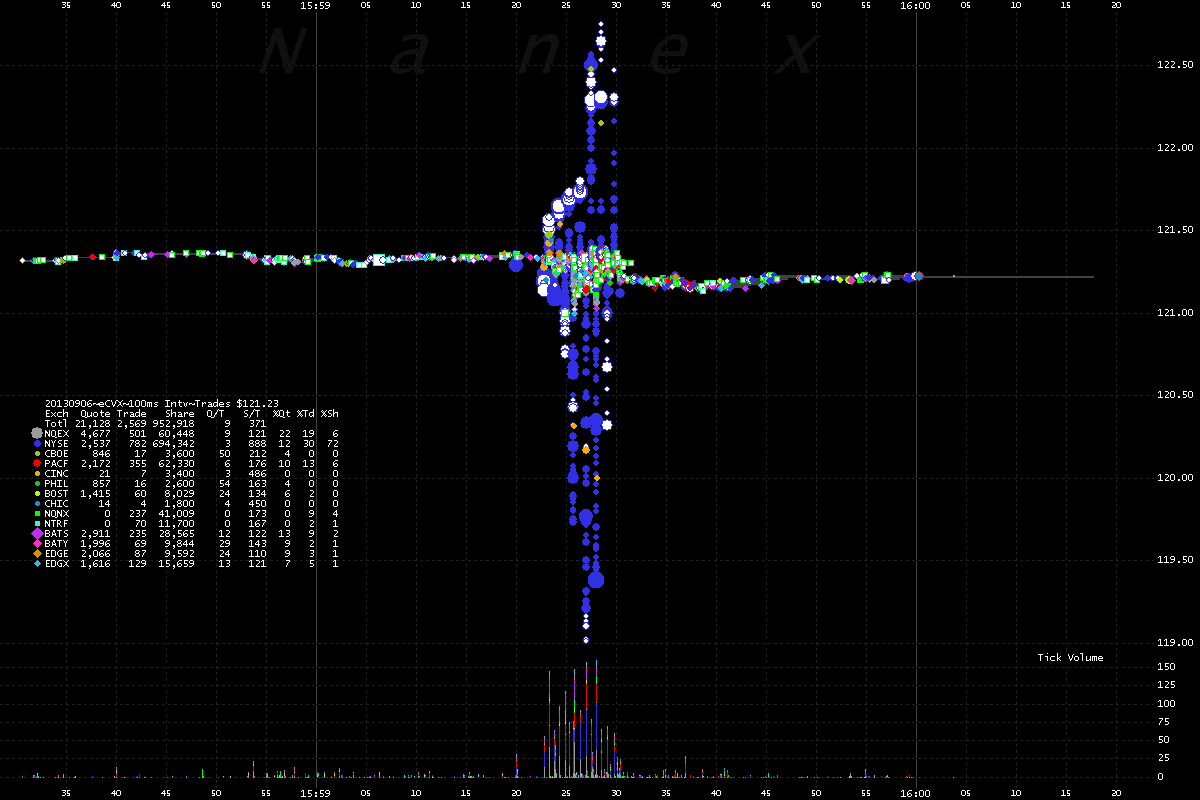
1. CVX - Trades color coded by reporting exchange.

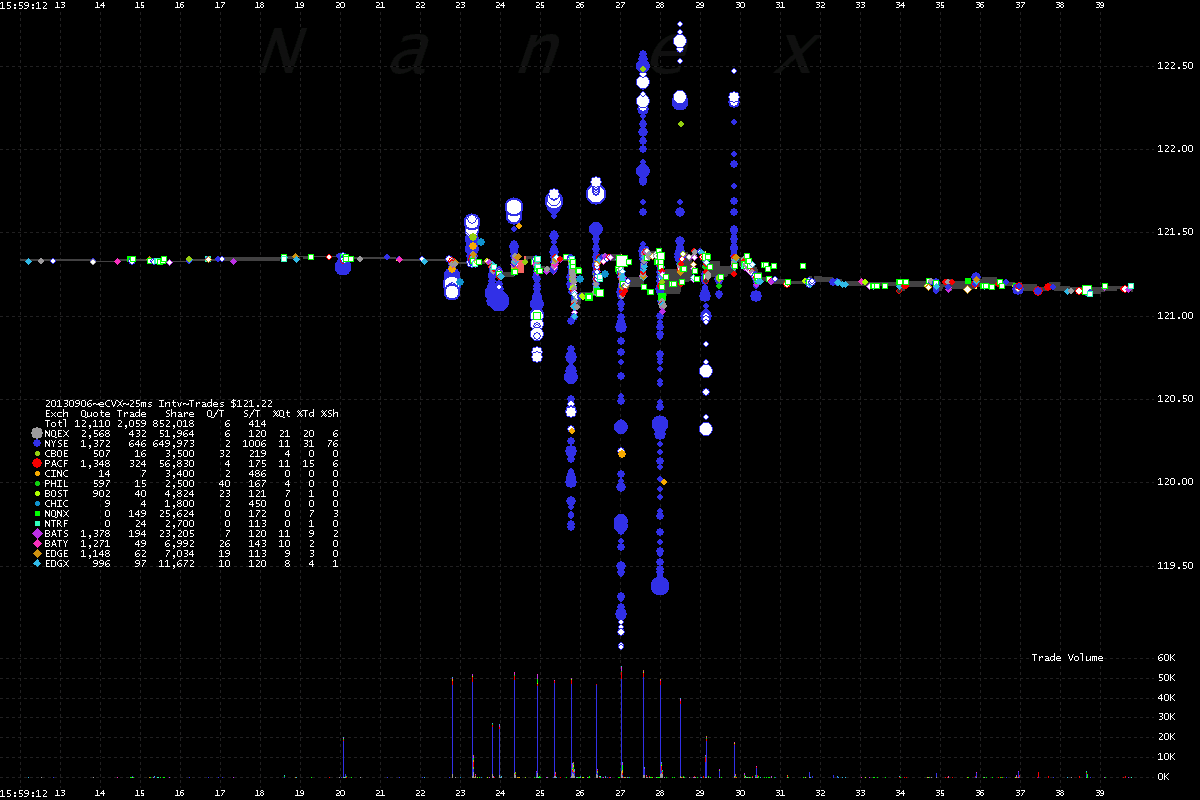
2. CVX - Trades color coded by reporting exchange. Zoom of Chart 1.
At this resolution, we can make out about 15 price spikes.
3. CVX - Trades color coded by reporting exchange. Zoom of Chart 2.
At this resolution the spikes are clear, and alternate: down, up, down, up..
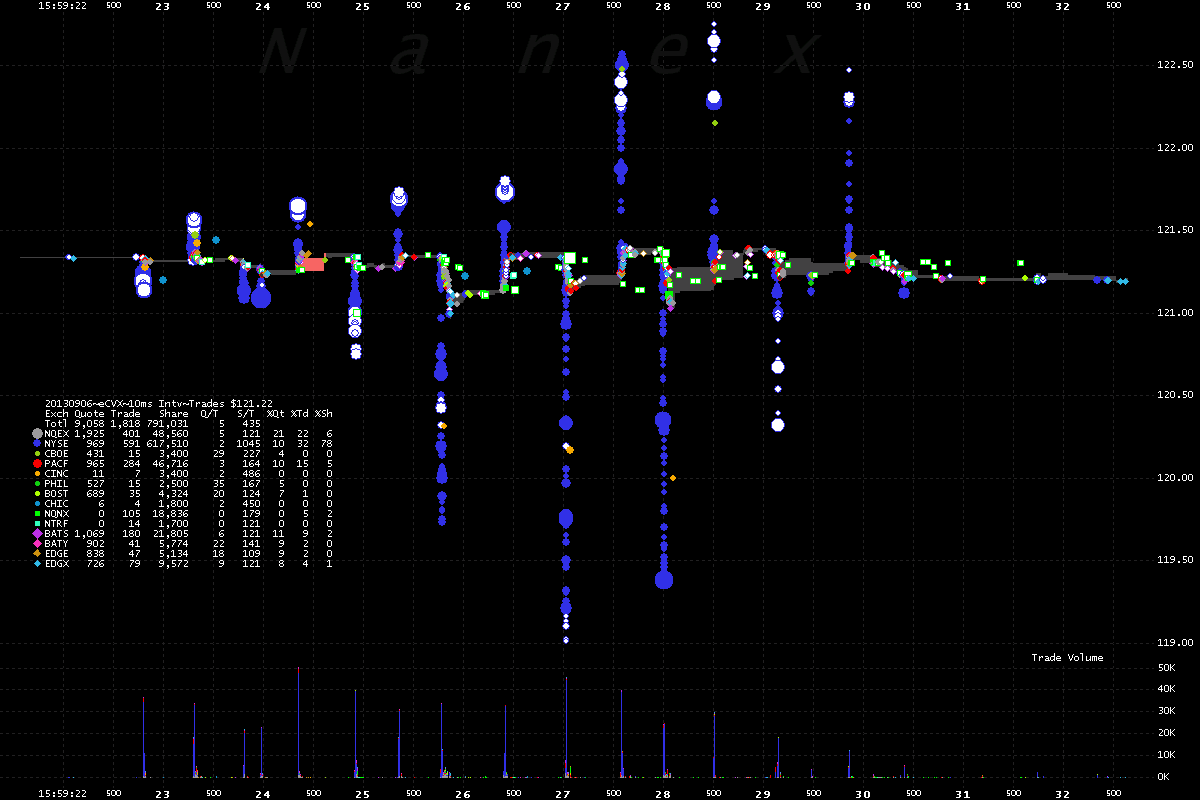
4. CVX - Trades color coded by reporting exchange. Zoom of Chart 3.
At this resolution, showing 10 seconds of time, we can make out the NBBO (dark gray/red
shading), which is oscillating. The price spikes seem to occur at the extremes of the
oscillations.
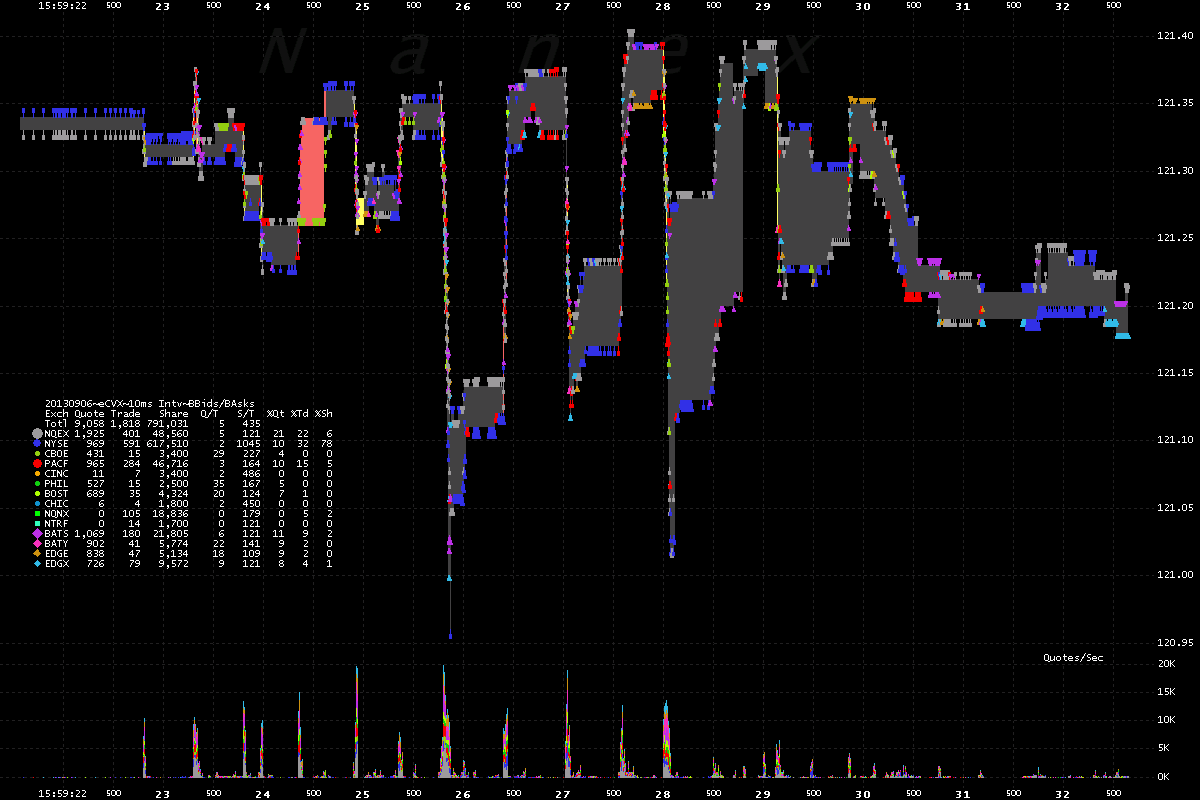
5. CVX - Best bids and offers color coded by reporting exchange, and NBBO, shaded
gray if normal or red if crossed (bid > ask).
Zooming in by price (same time scale as above), the oscillations in the NBBO are clear.
And involve 12 exchanges!
6. CVX - Zooming back out and showing all bids and asks color coded by reporting exchange.
Nanex Research
Inquiries: pr@nanex.net


