Nanex Research

Nanex ~ 20-Aug-2013 ~ Rogue Algo Exposes Cracks in Options Market
Updated: Link
Original Text.
Shortly after market open (9:30 ET) on August 20, 2013, a rogue High Frequency Trading (HFT) algo appeared in the U.S. options market and began
affecting both options and stocks. The algo placed orders
to sell up to 1000 option contracts on stocks with symbols beginning with the letters
IE through KIM. The sell orders were placed on the AMEX options exchange with a limit
price that started out high, and over the next minute, ratcheted down one penny (or minimum price increment) at a time
to $1: regardless of the strike or value of the underlying stock or ETF. The sell order sizes started at 1000 contracts and only decreased when buy orders executed
against them.
The algo didn't appear to take into account higher bid prices on the other
options exchanges
- because when it lowered the sell price, it often caused the NBBO
(National Best Bid/Offer) to lock (bid = ask) or cross (bid > ask).
As soon as option quotes in the affected symbols began exceeding theoretic economic
values by some threshold,
quotes (and therefore liquidity) on other options exchanges for those contracts would immediately disappear
- bid/ask prices would go to zero at other exchanges.
Within 10 seconds of starting, one algo, in effect, completely destroyed the concept of the National Market System and obliterated liquidity.
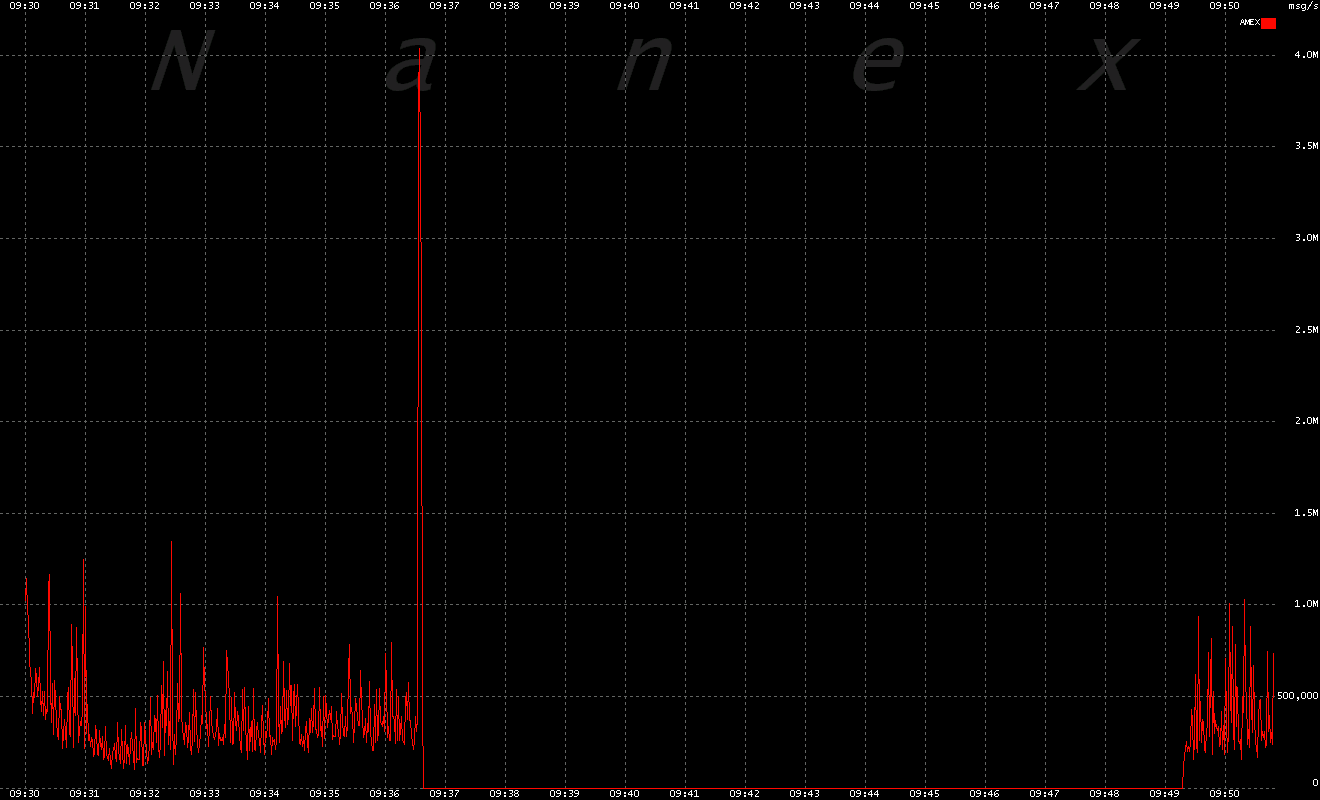
At 9:36:37.551, options quotes ceased from the AMEX exchange in all options, not just those
affected by the algo. Maybe the firm responsible for the algo thought it was AMEX's
fault, or maybe AMEX noticed a large number of crossed option quotes and took action.
Regardless of the cause, the outage lasted 13 minutes.
It was later reported that the algo was run by Goldman Sachs. What was the fine
for shutting down an options exchange, and destroying liquidity in hundreds if not
thousands of options contracts?
There was no fine. Worse, they were able to get the trades busted.
As in, pretend we didn't just do that. Pretty shocking.
Until there are financial consequences for firms that turn on market disrupting
algos, the markets, will continue to be distrupted.
List of several, large, well known symbols with a significant aberration in option prices:
| Symbol |
Name |
Market Cap ($Billions) |
| IWM |
Russell 2000 ETF |
(Assets) 25 |
| JPM |
JP Morgan |
200 |
| IMO |
Imperial Oil |
36 |
| K |
Kellogg |
22 |
| KIM |
Kimco Realty |
8 |
| JOY |
Joy Global |
6 |
| JLL |
Jones Lang Lasalle |
4 |
| IT |
Garnter |
5 |
| IEX |
IDEX |
5 |
| KBR |
KBR |
5 |
| JOE |
The St. Joe Company |
2 |
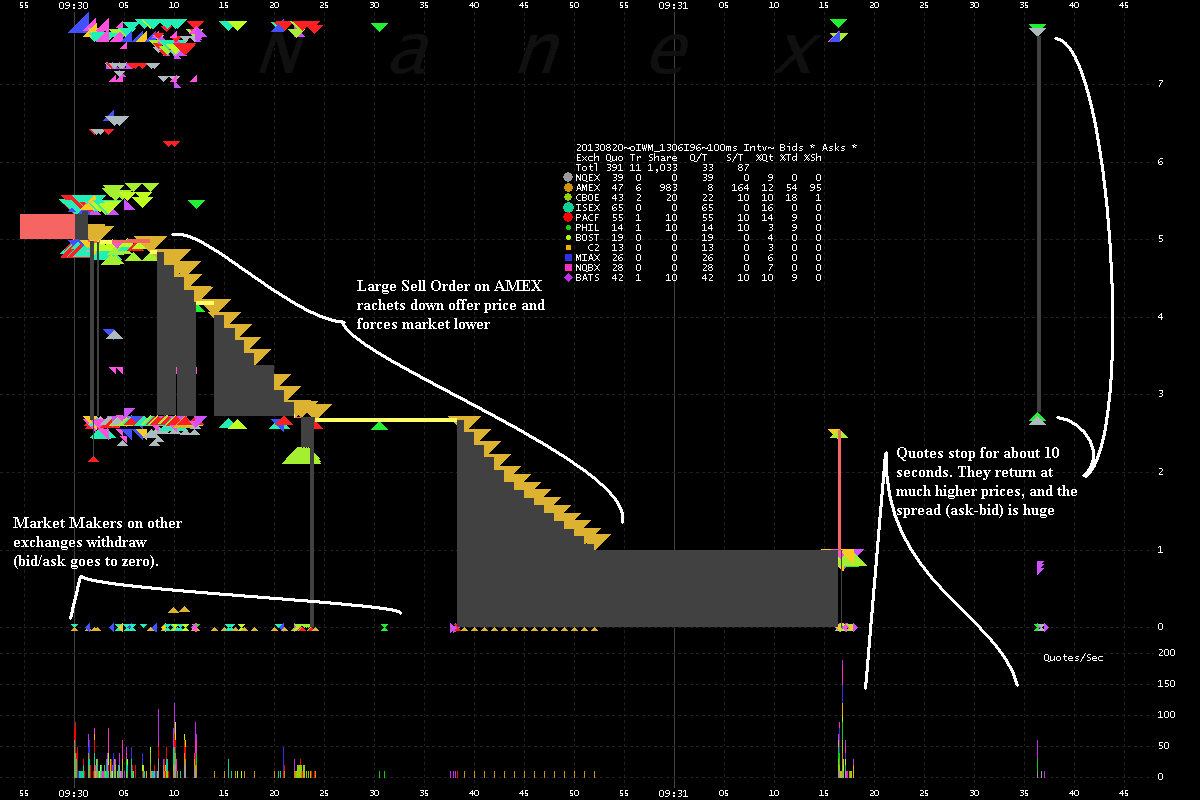
1. All IWM Options Contracts: Ask prices color coded by reporting exchange. Chart shows about
5 minutes of trading.
Multiple lines of gold triangles representing ask prices from AMEX descend towards $1:
these are from the rogue algo. The triangles form lines: one line for each option contract
the algo was selling.

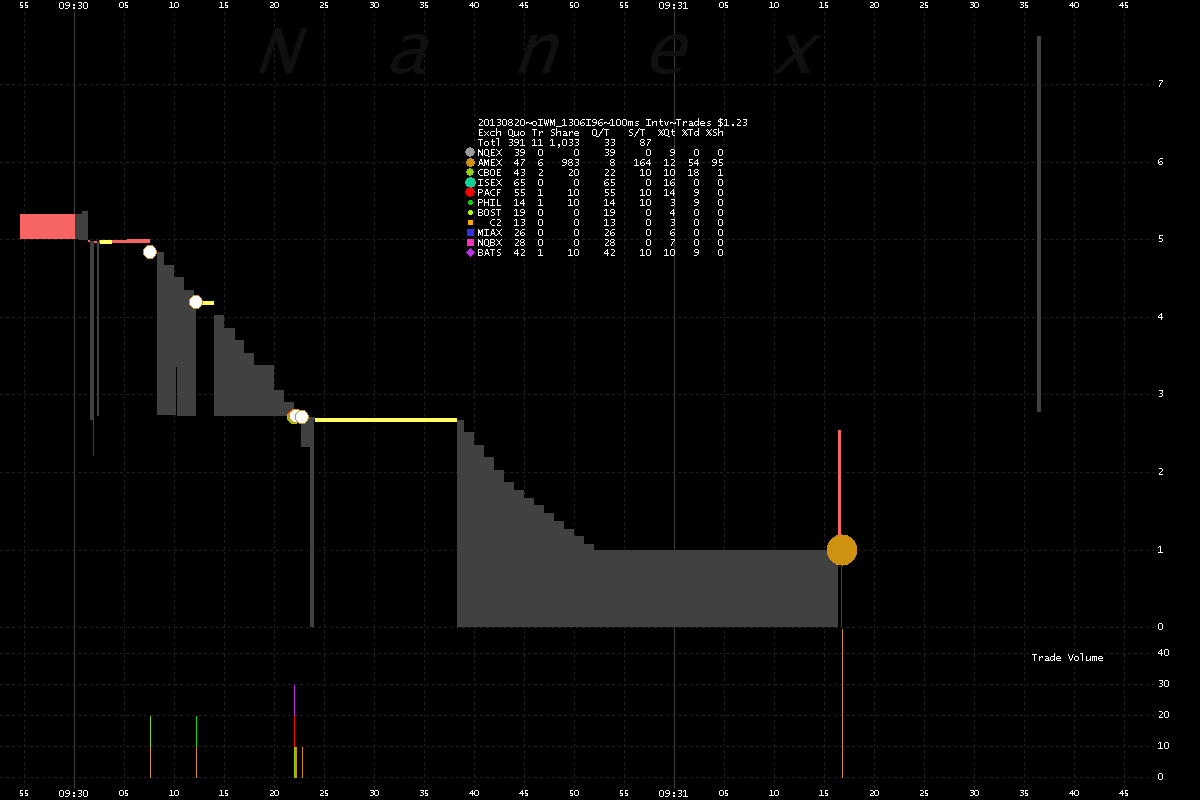
2. IWM September 2013 96 Call - Showing all bid and ask prices color coded by
exchange and NBBO over about 2 minutes of trading.
Note the line of gold triangles descending towards $1. These are ask prices
from the rogue algo. It is one of the strings of gold triangles from Chart 1 above.
3. IWM September 2013 96 Call - Showing trades and NBBO.
The large gold dot is from one trade of 933 contracts.
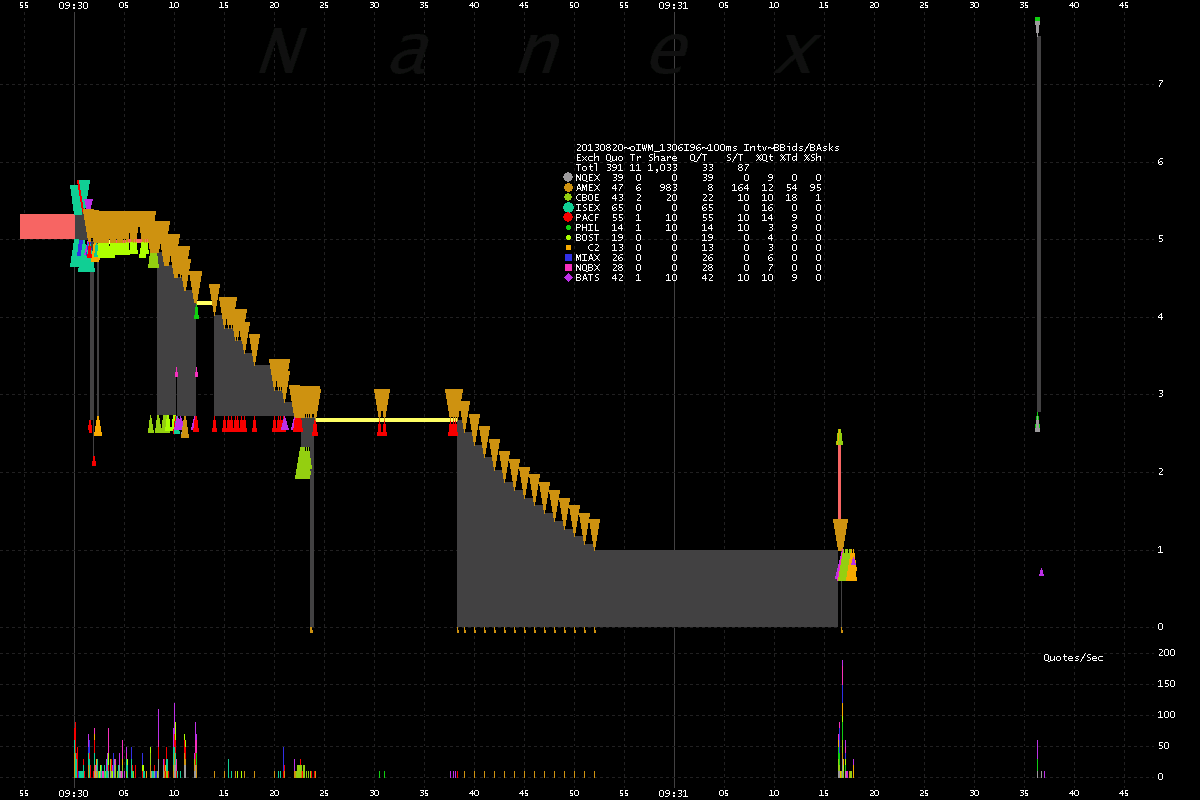
4. IWM September 2013 96 Call - Showing best bid and ask prices color coded
by exchange and NBBO.
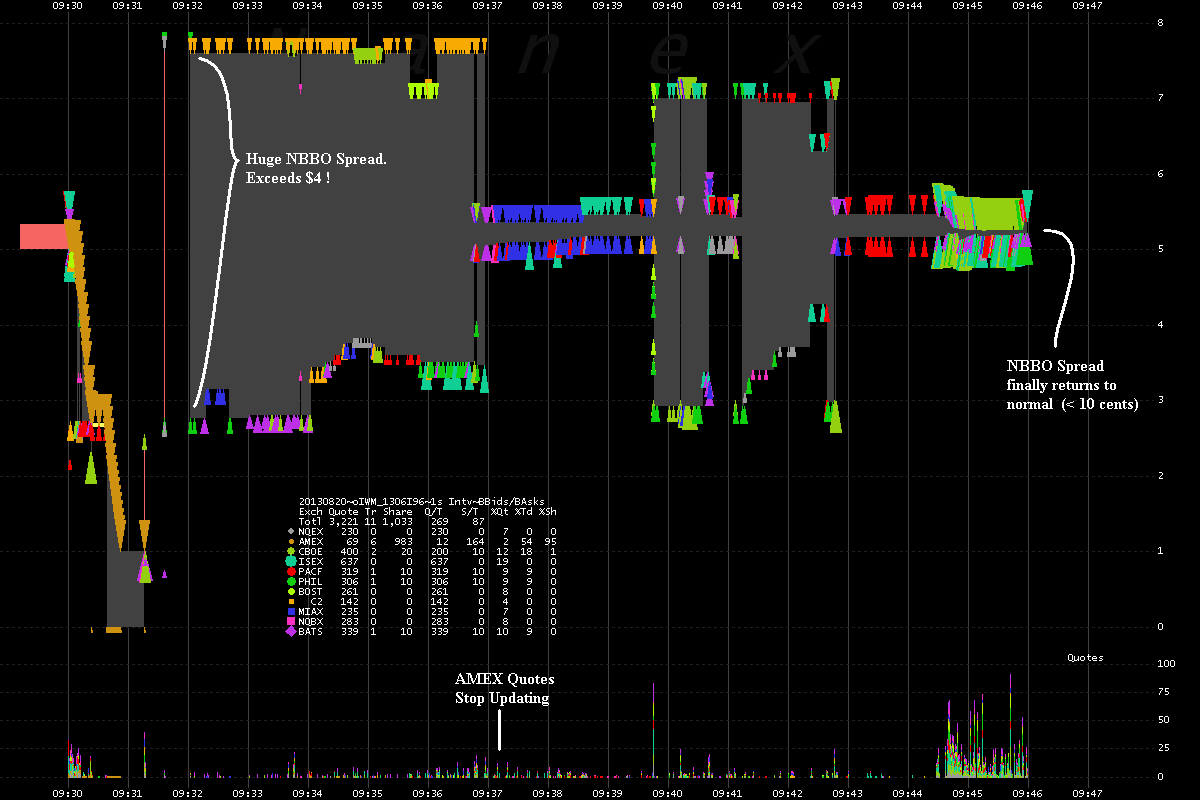
5. IWM September 2013 96 Call - Showing best bid and ask prices color coded
by exchange and NBBO.
Zoomed out in time from Chart 4 above.
Note how the NBBO spread remained exceptionally wide (over $4) for many minutes
after the rogue algo stopped. The spread temporarily narrowed right after the AMEX Options
Exchange was halted.
6. Message rates for each of the 48 multicast lines that carry option data. The bottom panel shows a count
of crossed NBBO quotes by multicast line.
Lines 21-24 carry traffic for symbols IE - KLZ and are colored light blue/green. Note
these lines show a large number of crossed quotes (very unusual) in the first 6 minutes
of trading.
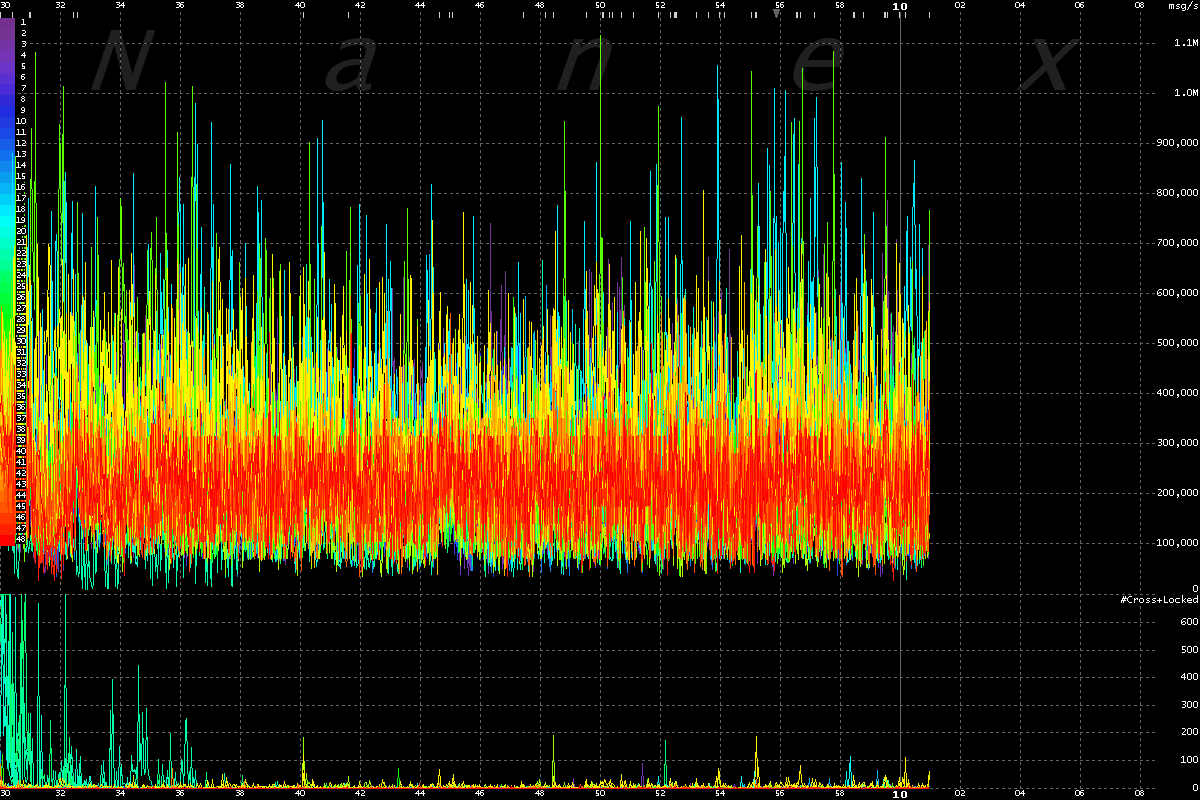
7. Message rates for option quotes and trades color coded by reporting exchange.
The spike is from AMEX just before it goes silent (a burst of zeroing out quotes).
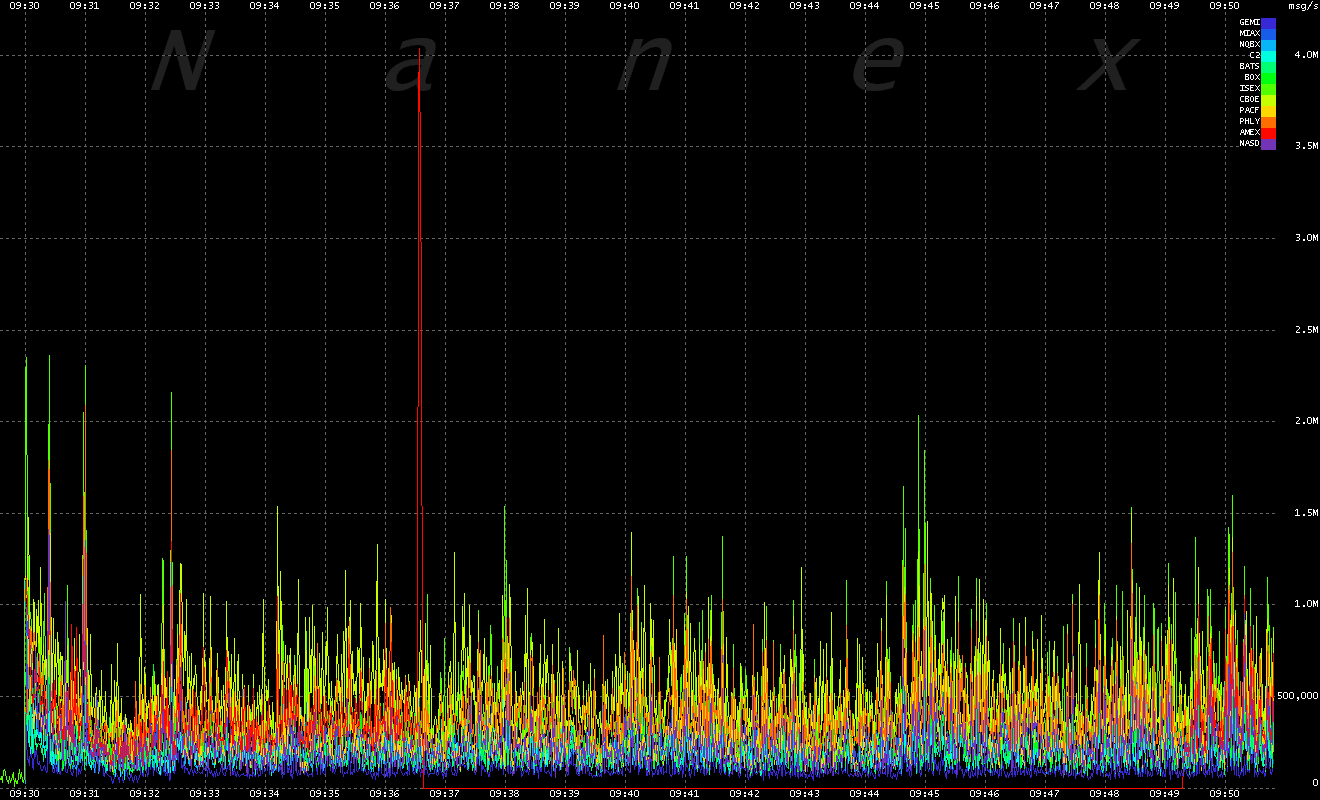
8. Showing quote message rates from AMEX. You can clearly see the outage. See
Chart 9 (below) for a close up of the spike just before the outage.
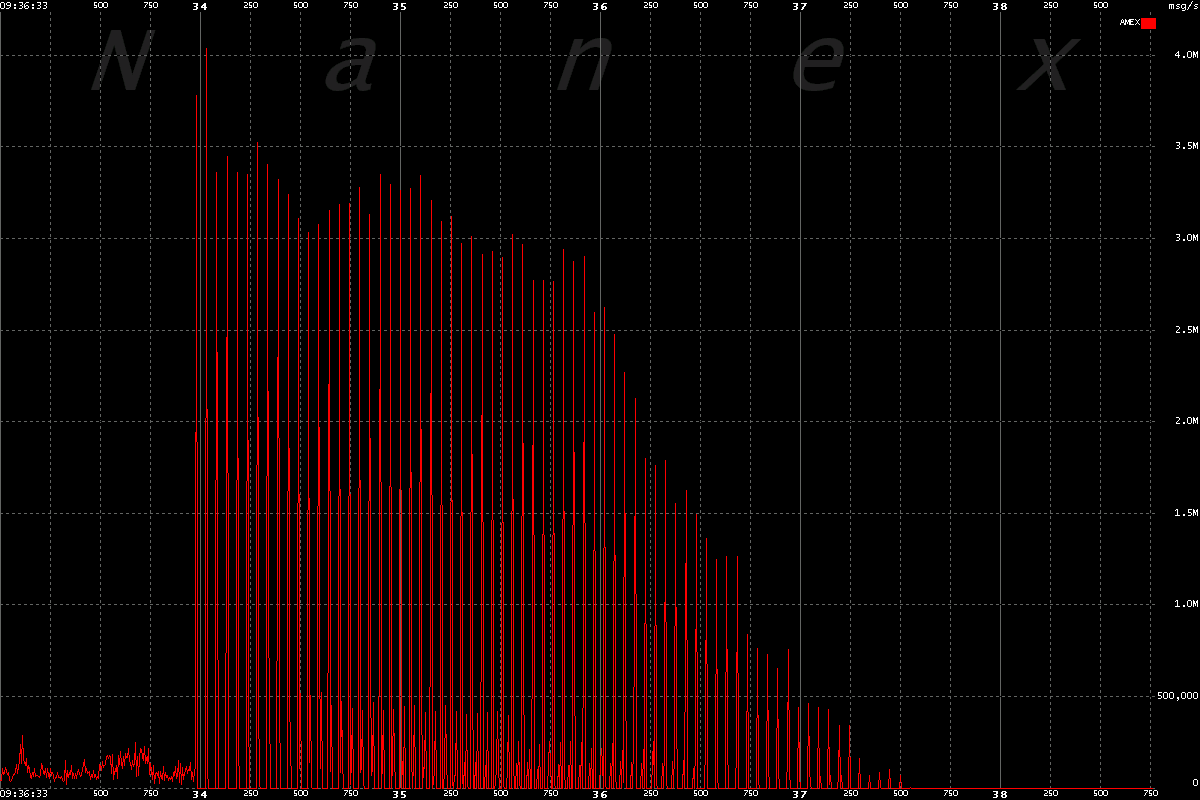
9. Close up of quote message rates from AMEX just before shutdown. This is what
the red spike in Chart 8 (above) looks like, close up.
These are zeroed quotes (bid/ask are 0) indicating a planned, orderly shutdown, and
not a system failure.
10. More Examples.
Nanex Research
Inquiries: pr@nanex.net volatility


