Nanex Research

Nanex ~ 17-Sep-2013 ~ HFT Infests Options Market
Below are real world examples of what happens when HFT spams the option market with
bogus quotes. Each chart shows the first 54 seconds of
trading. The NBBO is shown as
a light gray shading. The best bids and offers are color coded by exchange. There is
just one trade in each option contract - shown as a circle.
1. Sell 2 March 2013 Google 770 Puts at the open on October 23, 2012.
Quote/Trade ratio: 426.
The first 28 seconds of much higher bids are missed. Our poor retail trader
gets stuck with the bottom of a $4 spread. His trade is the only one during this time.

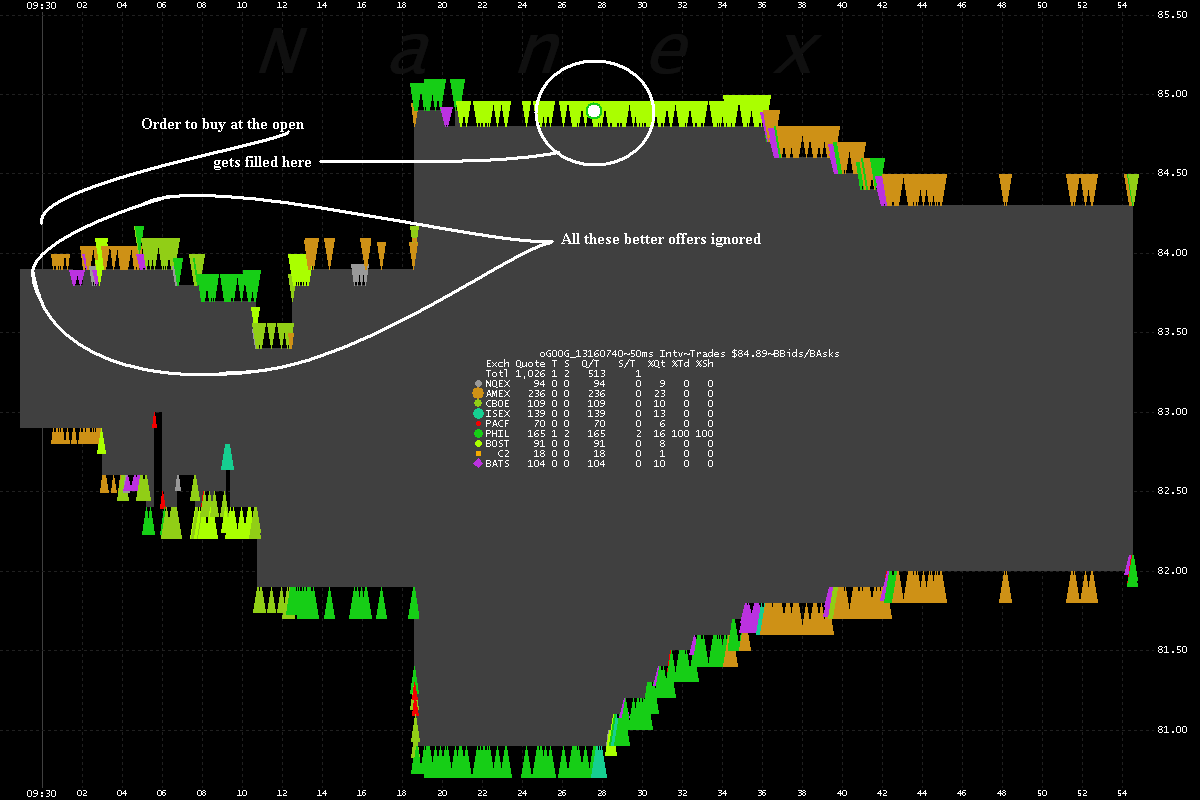
2. Buy 2 March 2013 Google 740 Puts on October 23, 2012. Quote/Trade ratio:
513.
Same story as above. Many much better offers available. The trading engine was probably
taxed from option quote overload.

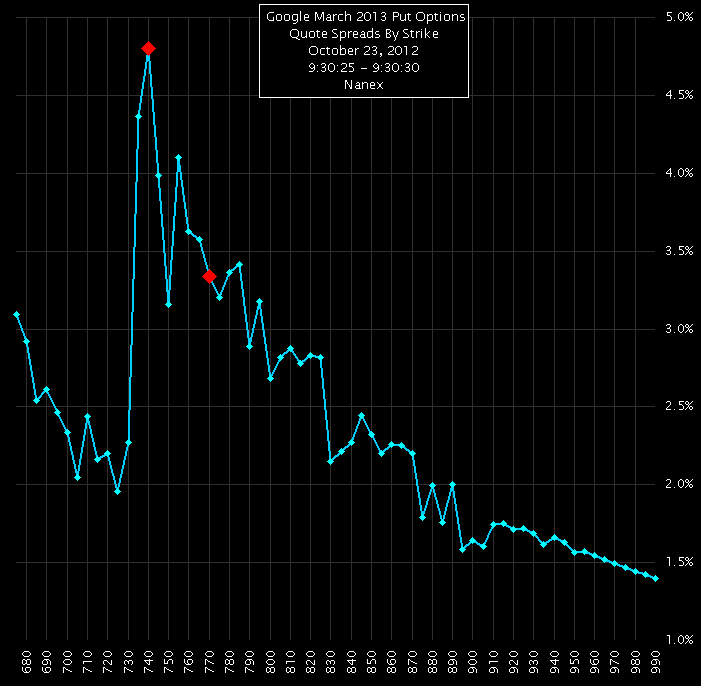
3. Quote Spreads for March 2013 Google Put Options with Strikes between 680
and 990 over a 5 second period starting 9:30:25
The red dots indicate the spreads for the 2 contracts shown above. The chart clearly
shows the spread for the
740 strike was way out of line.

Nanex Research
Inquiries: pr@nanex.net


