Nanex Research

Nanex ~ 12-Dec-2013 ~ Invisible Trading
What stock or ETF had thousands of trades in a day, but didn't officially trade?
The answer is First Trust Australia AlphaDEX (Symbol FAUS, an ETF).
On December 12, 2013,
there were 2,897 trades in FAUS, for a total of 14,194 shares. The average trade size
was 4.89 shares. The largest trade had 15 shares, which means all the trades were "Odd Lots". Odd Lot is a term for a trade with less than 100 shares. The thing about Odd Lots
is that they aren't eligible to set the open, high, low or close value for the day.
Before Monday, December 9, 2013, Odd Lots weren't reported to the Tape (Consolidated
Feed), which means you could only see these trades with very expensive direct feeds from each exchange.
But that would still exclude Odd Lots from Dark Pools - unless you contracted with every
dark pool operator for this data. Practically speaking, the charts below would have
be hidden from view from most people just one week ago. But now this
trading is visible. And there
are strange things going on.
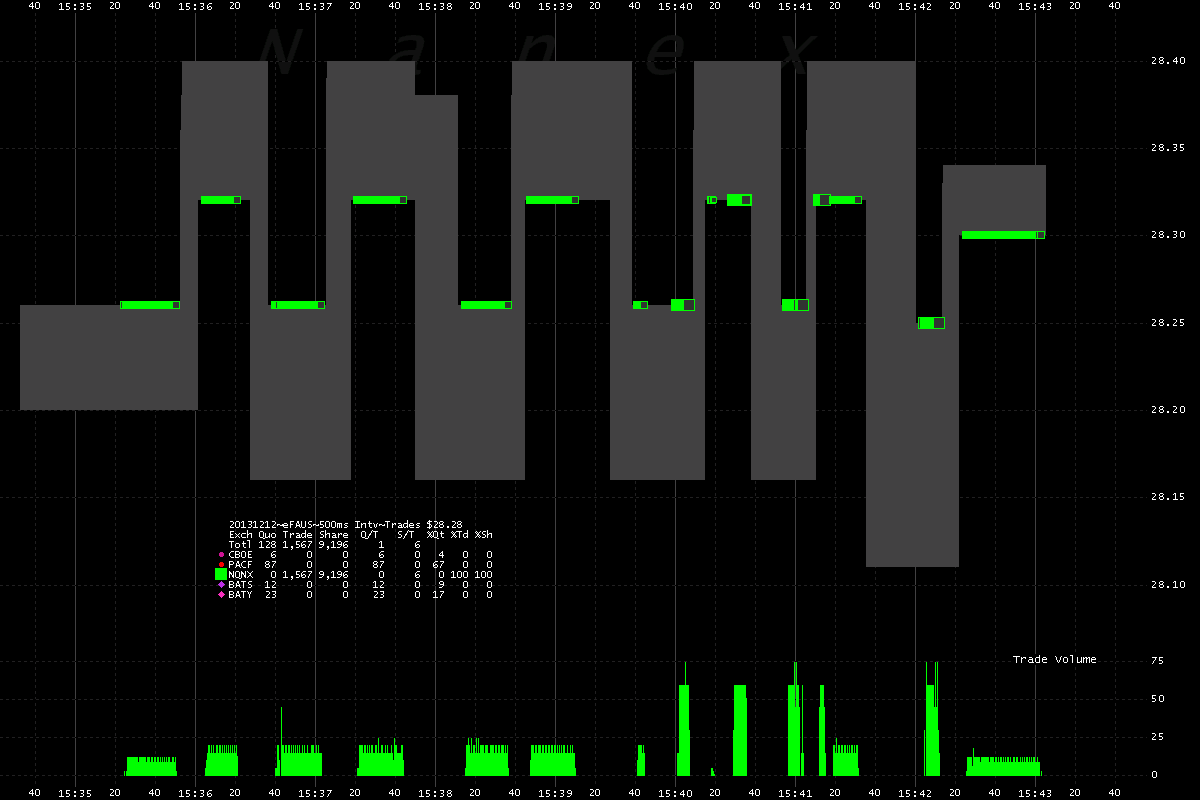
First, take note of the lighter gray shading. That is the NBBO (National Best Bid/Offer).
The top of this shading is the lowest offer price, and the bottom is the highest bid
price. The green squares are trade executions from Dark Pools. Each green "line" is actually
made up of hundreds of green squares, each representing a trade (at about 8 per second). These trades have one of three sizes:
3, 5, or 15 shares (why? we don't
know).
More interesting is what prices the trades are executing at. Where the green squares line up
with the top of the light gray shading (the first ones on the left), those are trades
executed at the National Best Offer, which means they were the result of buy orders
sent to execute against existing sell orders. Where the green squares line up with the
bottom of the light gray shading, those are trades executed at the National Best Bid,
which means sell orders sent to execute against existing buy orders.
In other words:
- Green squares on top of light gray shading: aggressive buying,
- Green squares on bottom of light gray shading: aggressive selling.
Now take a look at what is going on. Aggressive buying at $28.26 followed by aggressive
selling at $28.32. Repeat. This looks very much like the whac-a-mole pattern we've previously reported on.
1. FAUS - trades color coded by reporting exchange (they are all from Dark Pools)
and NBBO (shaded light gray).
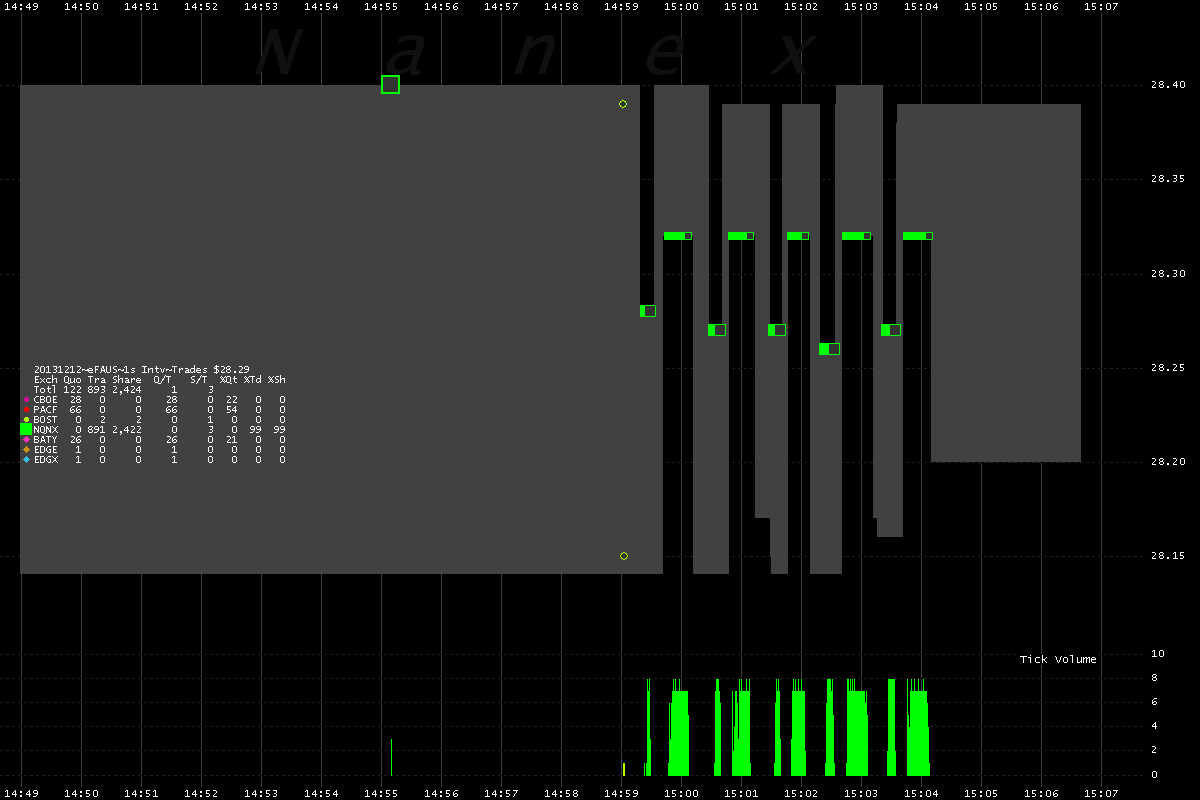
2. FAUS - Zooming out.
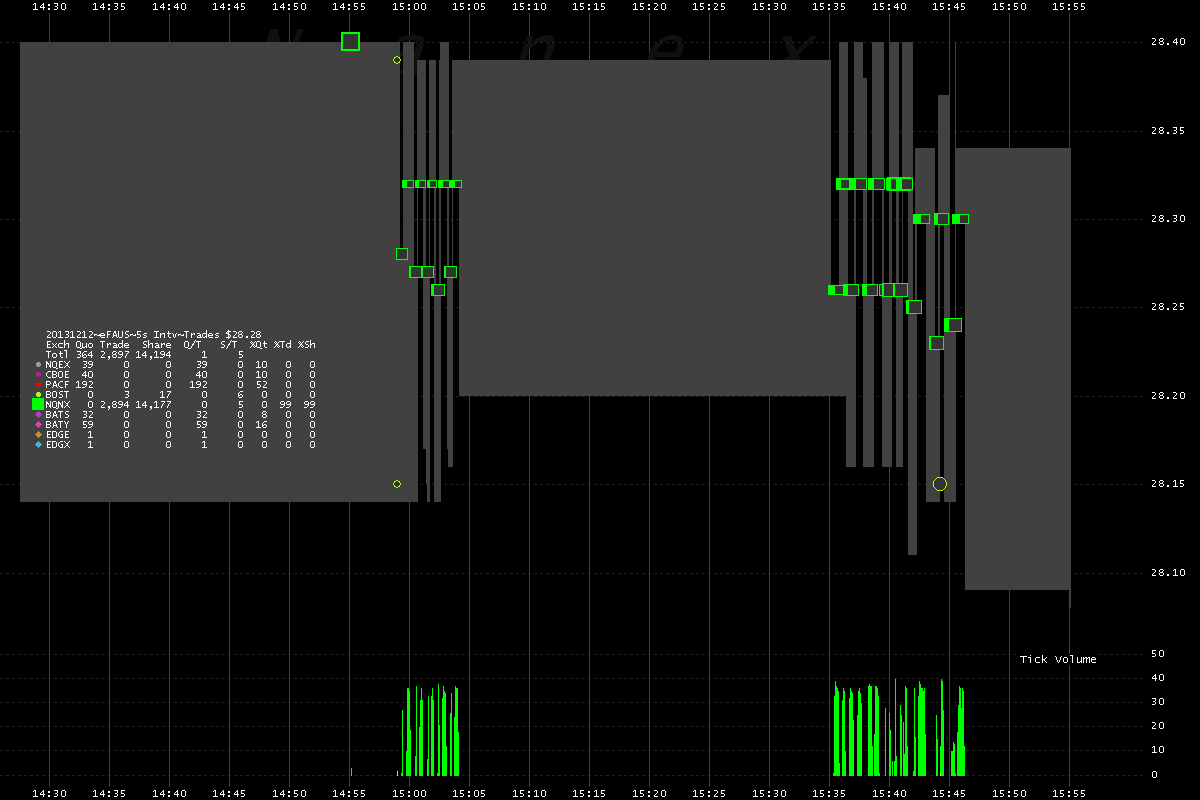
3. FAUS - Zooming out further.
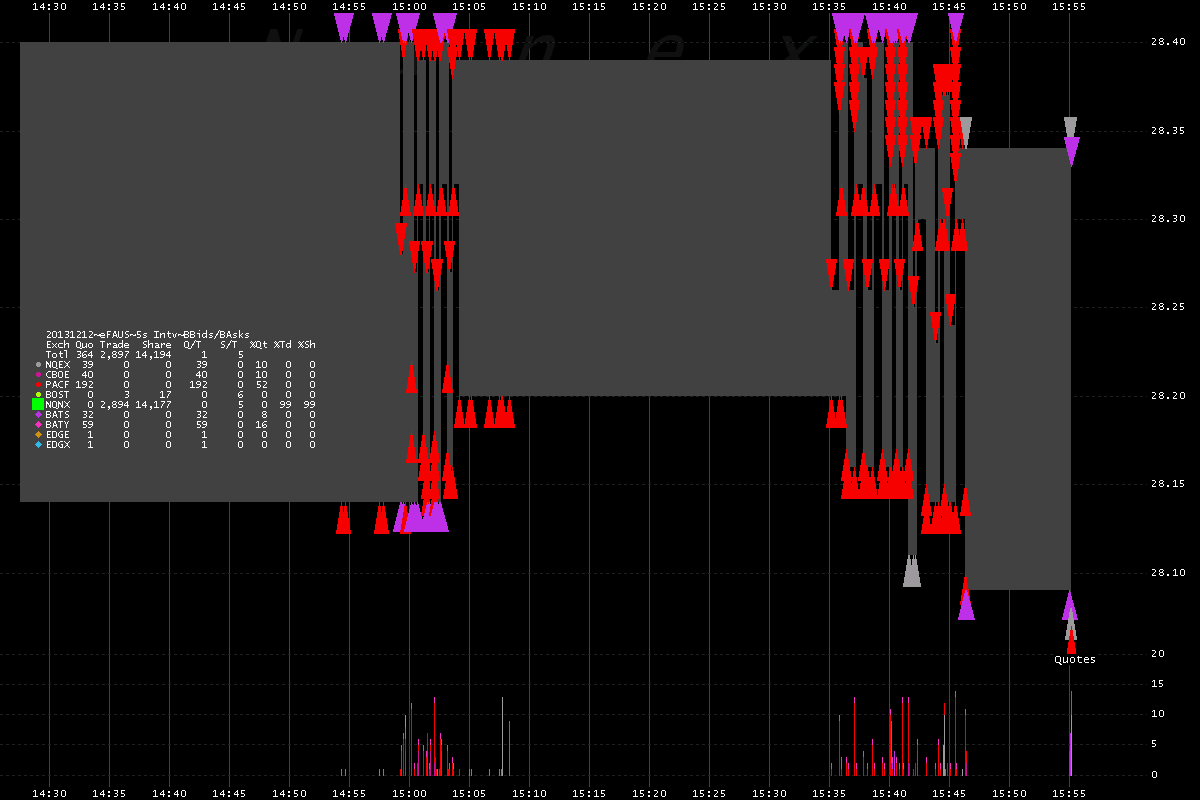
4. FAUS - showing best bids and asks color coded by exchange.
Another example from the next day, December 13, 2013, in FTW.
5. FTW - Showing trades and NBBO.
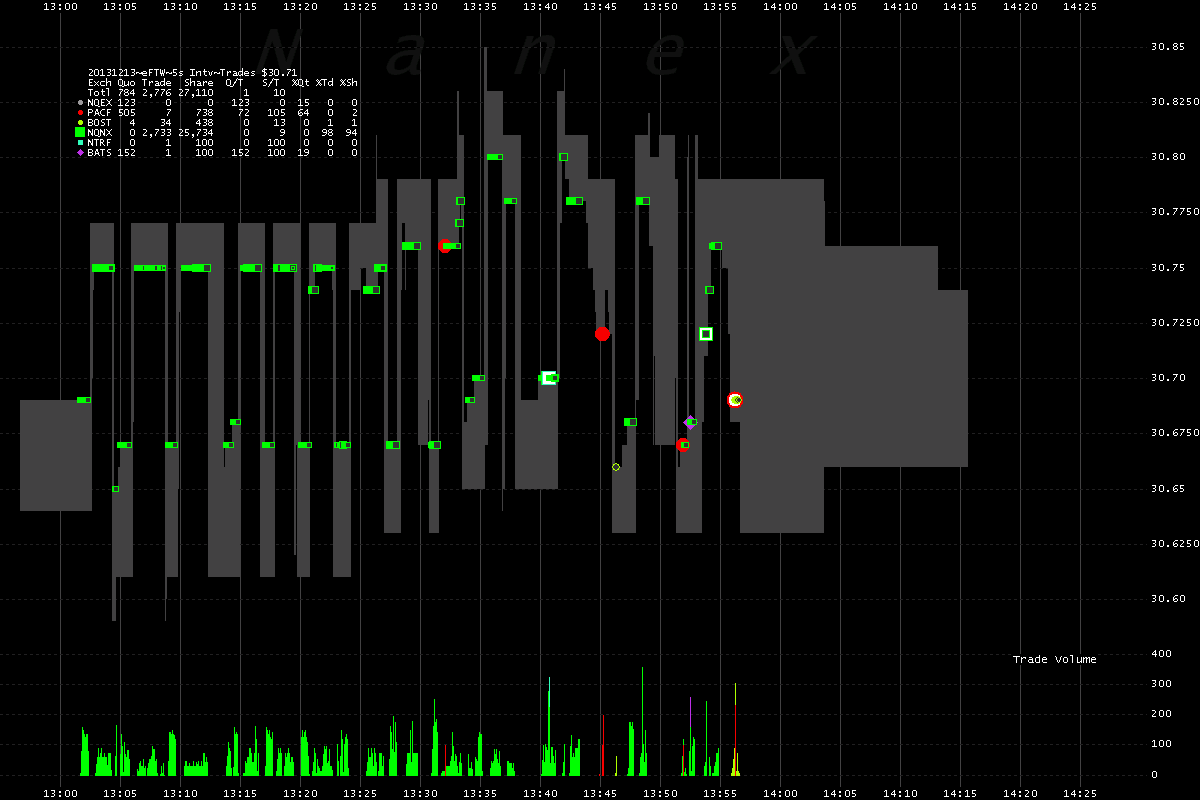
6. FTW - Zoom 1.
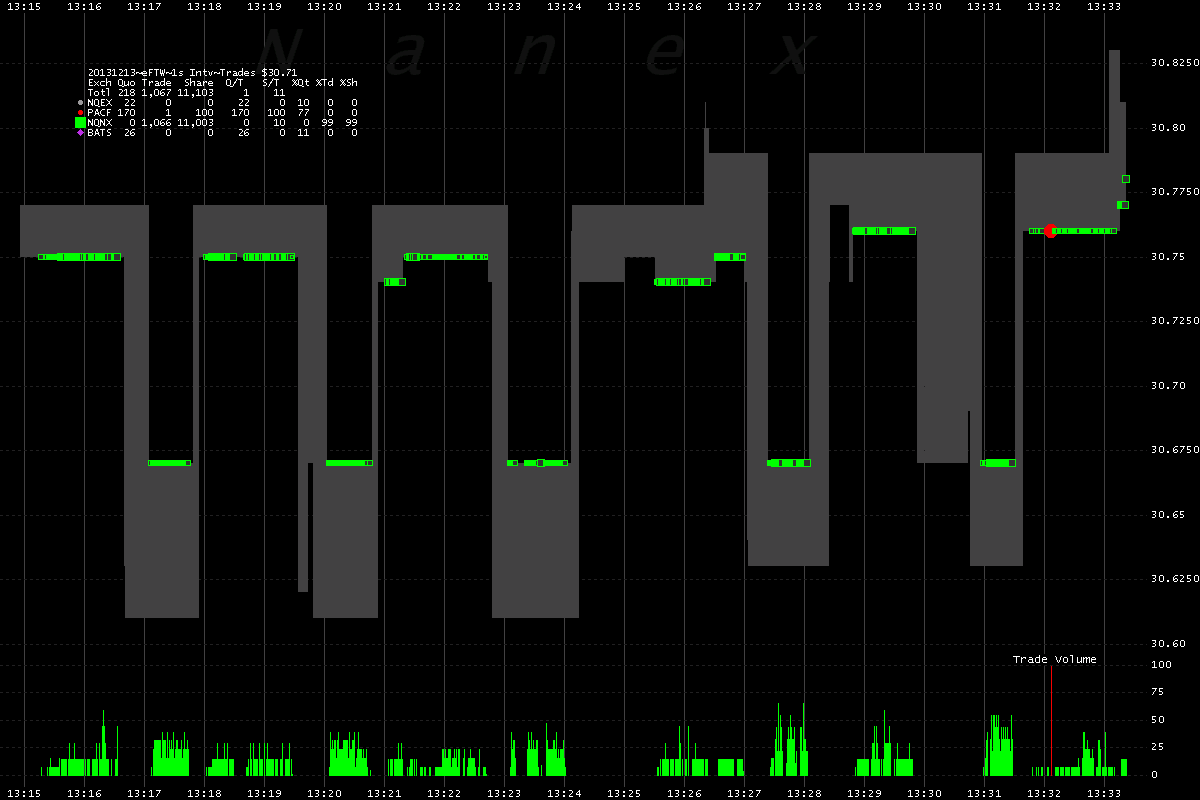
7. FTW - Zoom 2.
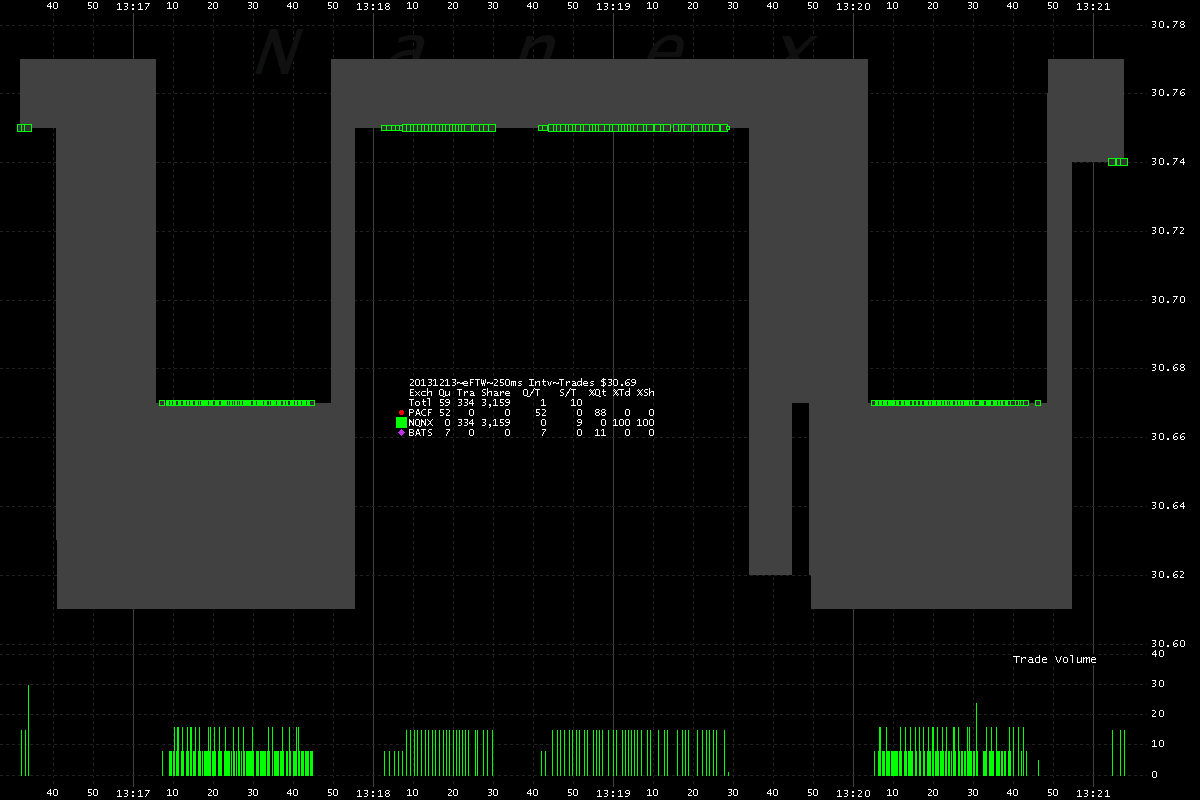
8. FTW - Zoom 3.
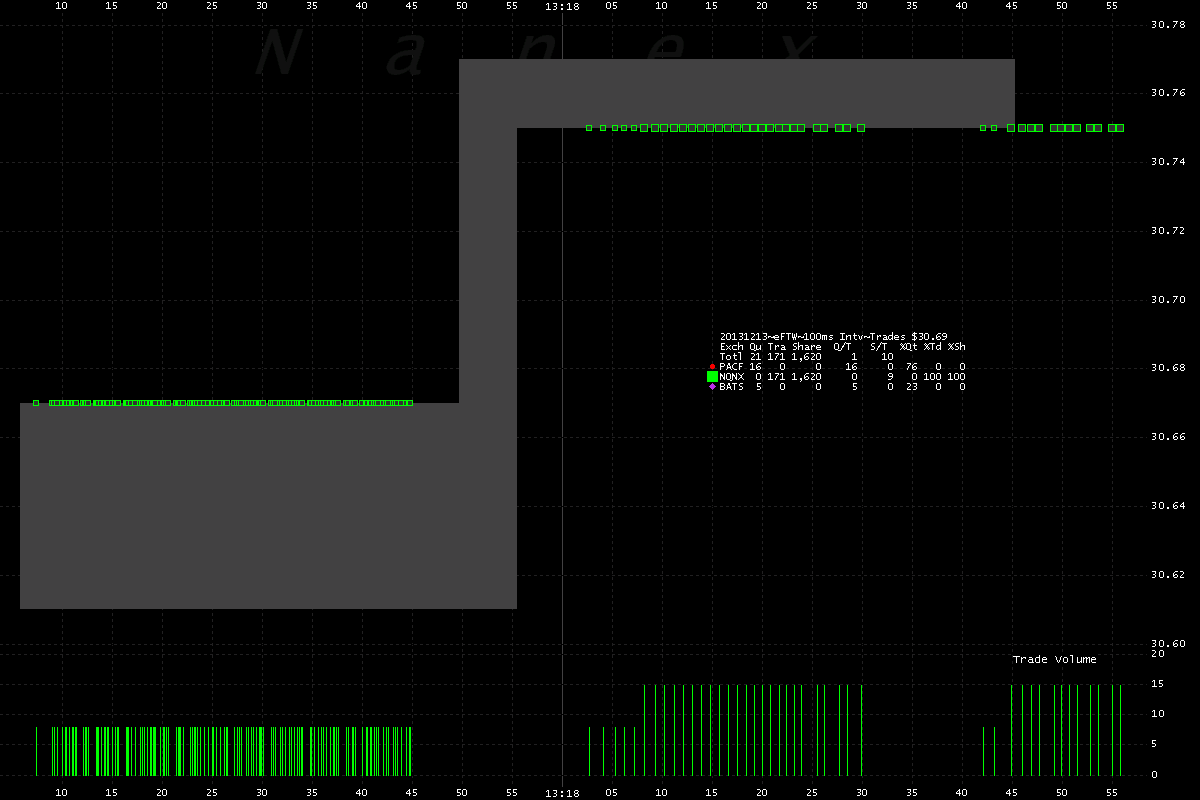
Nanex Research
Inquiries: pr@nanex.net


