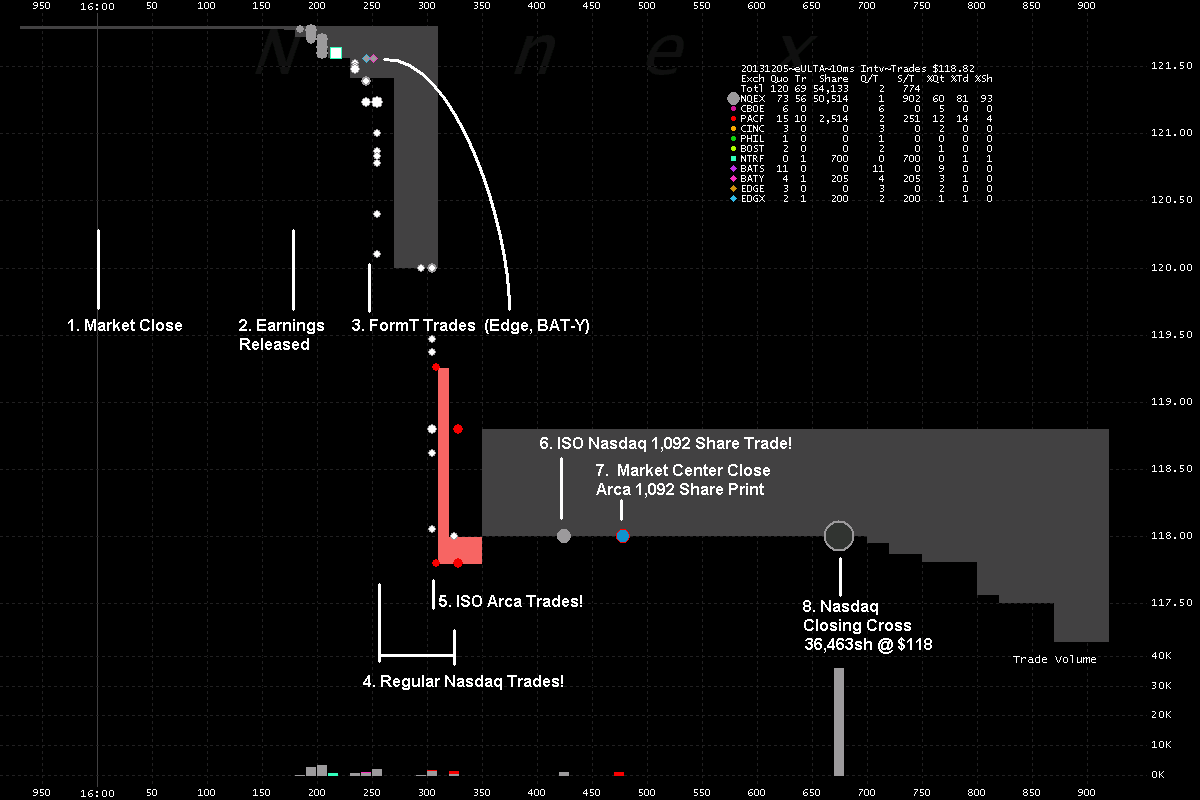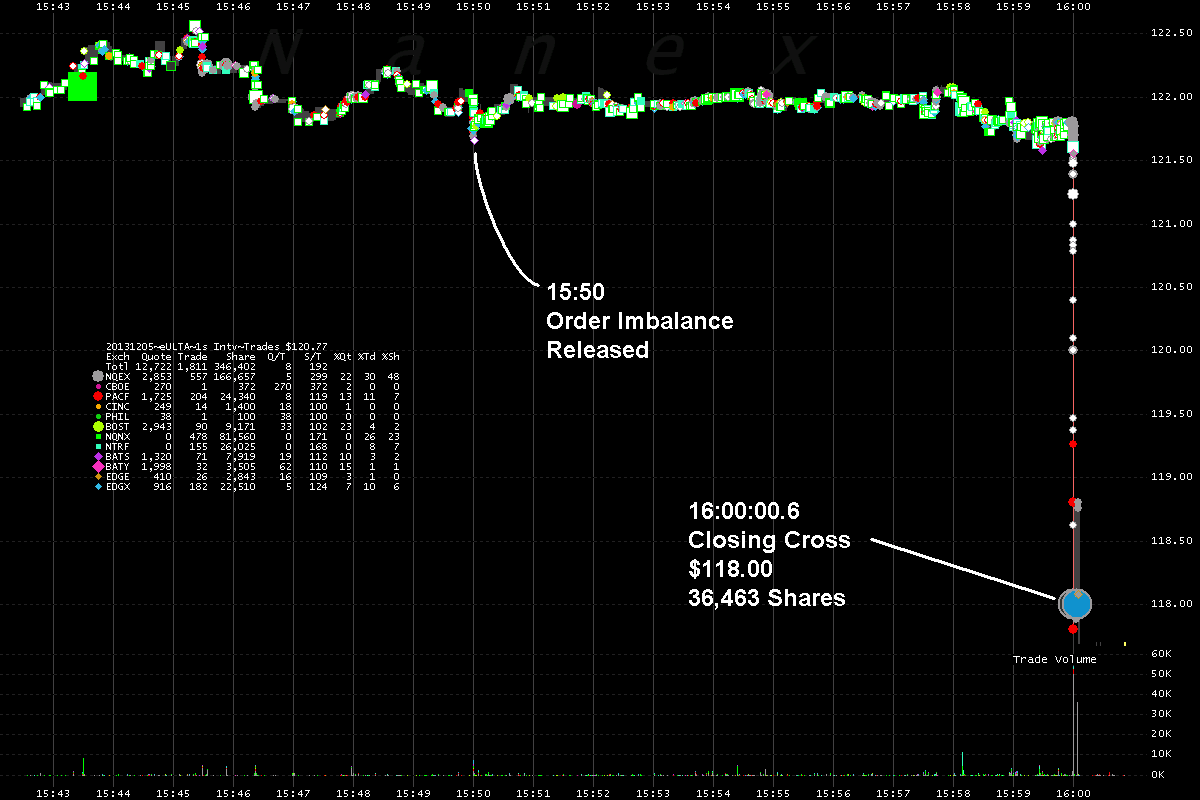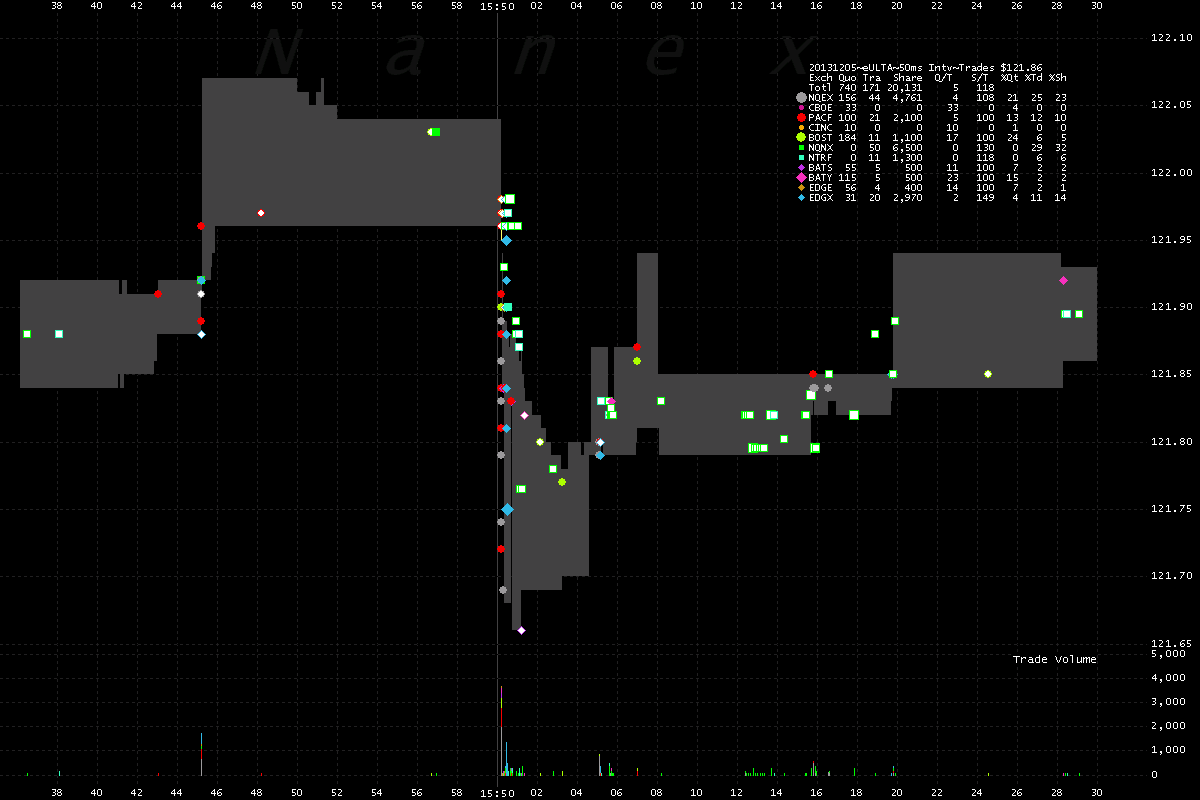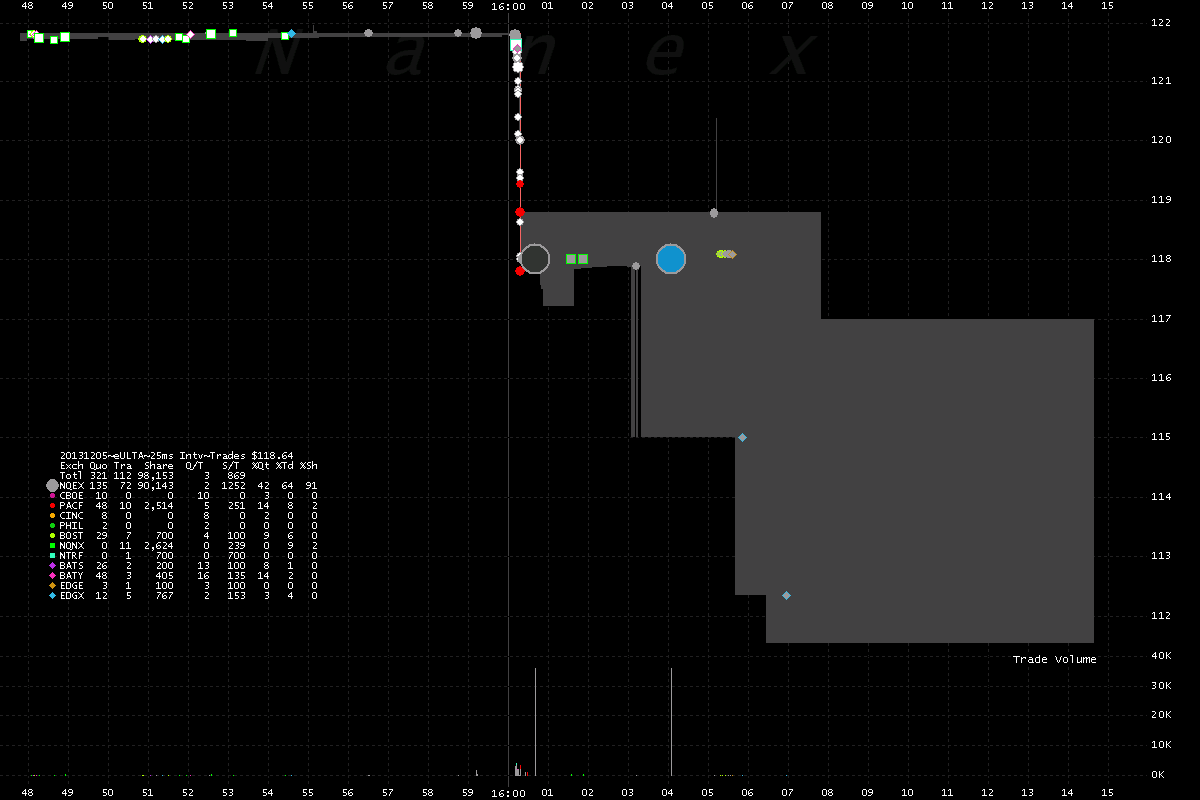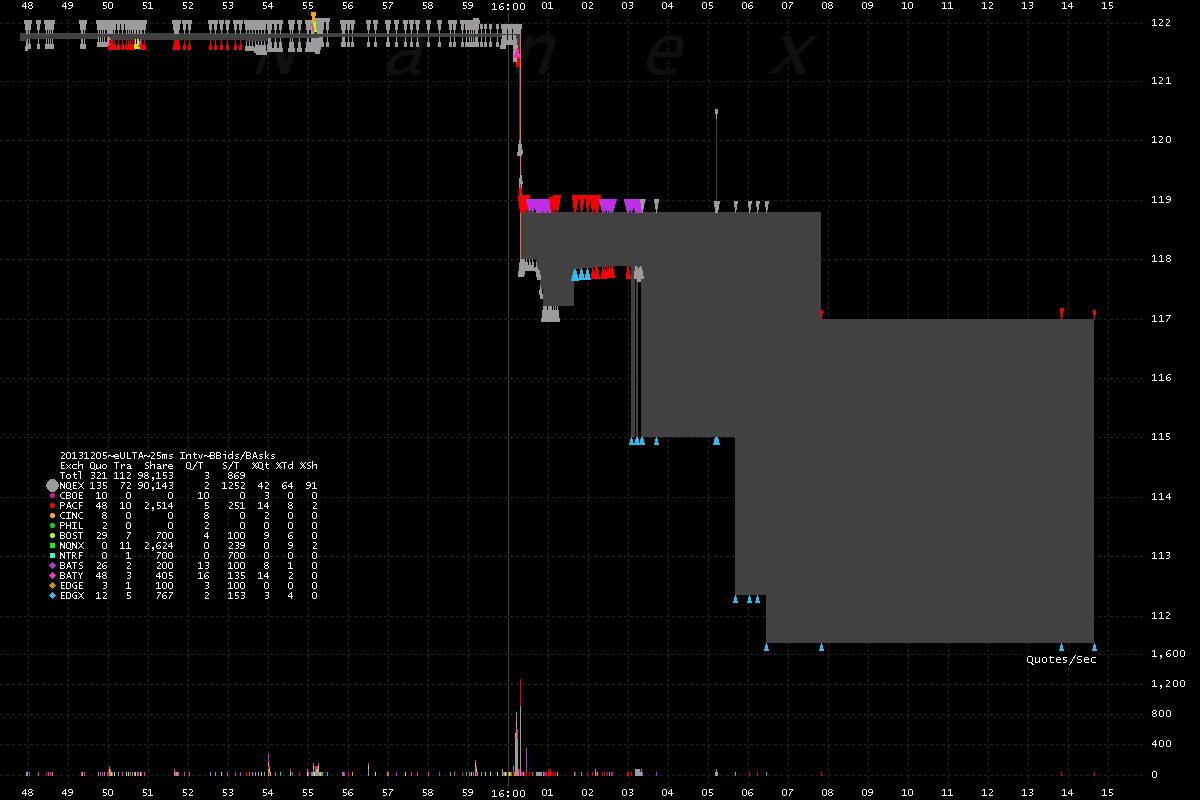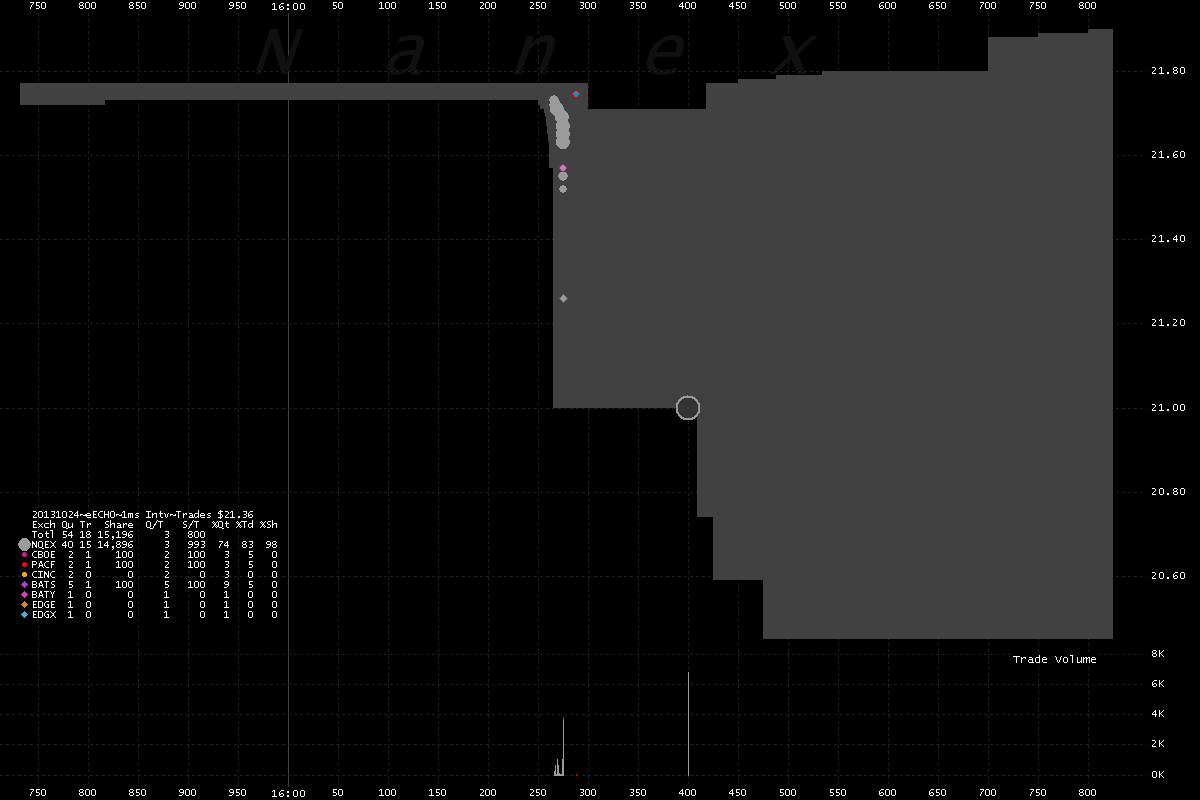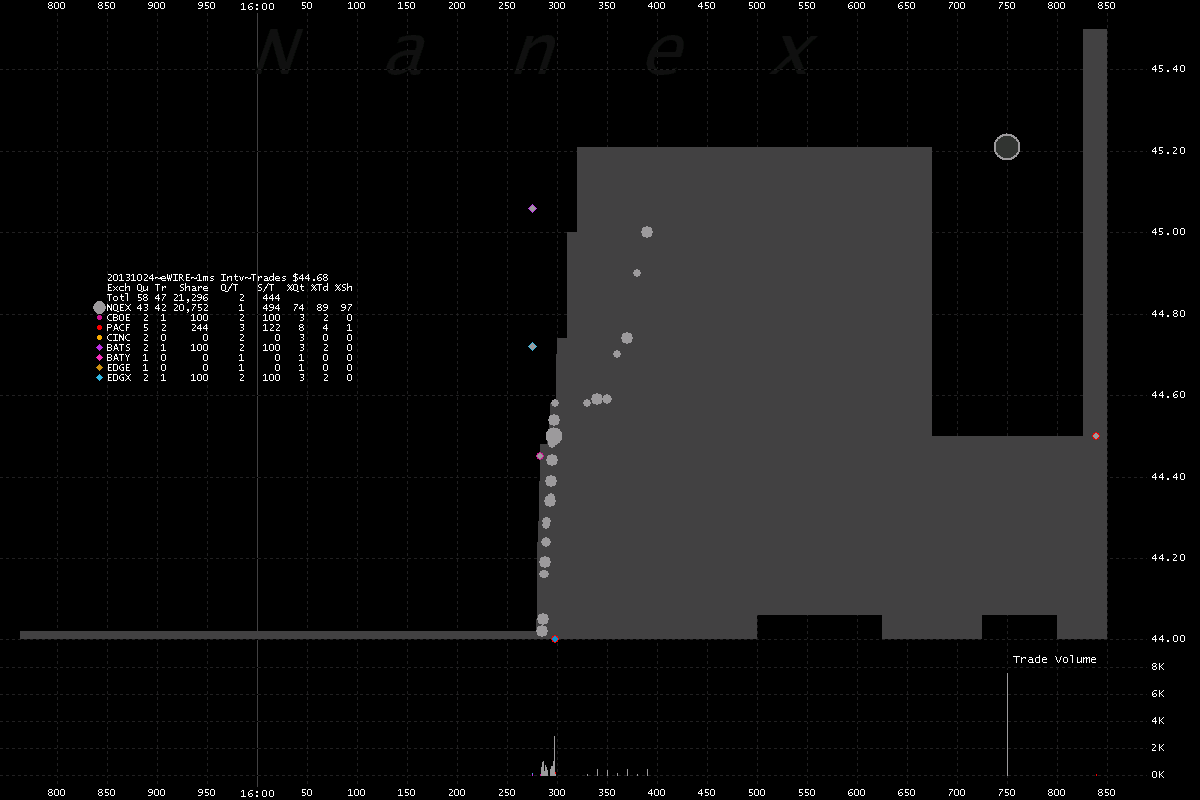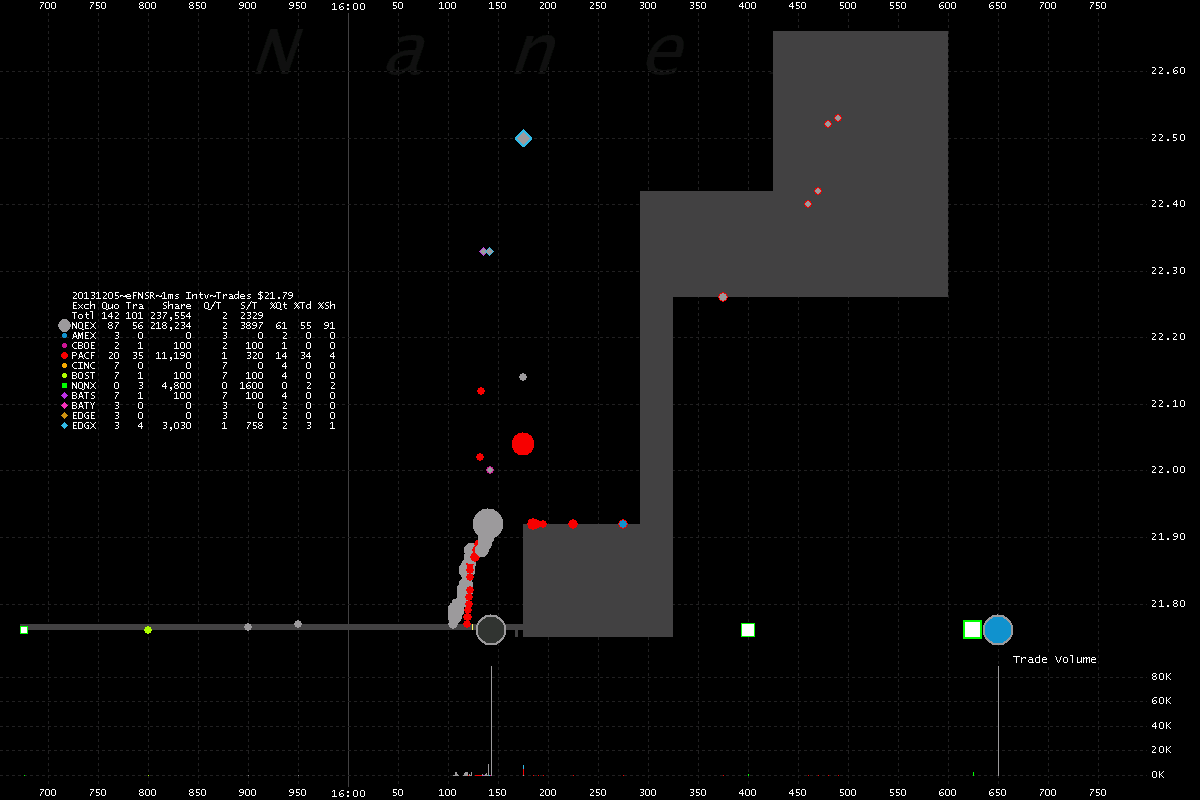
Numbers in brackets [] correspond to labels on Chart 1 and '#' column in Timeline.
- Why was there a large price movement ($3) in Nasdaq [4] and NY-ARCA [5] well after the 16:00 close [1] and after Earnings release [2]?
- Why was the Nasdaq Closing Cross influenced by trading well after 16:00?
- What determines how trades are tagged with the Form-T condition? (Form-T means "after hours").
- Why did regular [4] and ISO trades [5] appear after Form-T trades[3]? (ISO means Intermarket Sweep and is used during regular hours trading).
- Interesting: the NY-ARCA official closing print [7] matches the size (1,092 shares) and price ($118) of the Nasdaq ISO print [6] that immediately precedes it.
1. ULTA - NBBO (gray/red shading) and trades (dots colored by reporting exchange) during 1 second at market close. Numbered labels correspond to Timeline table.
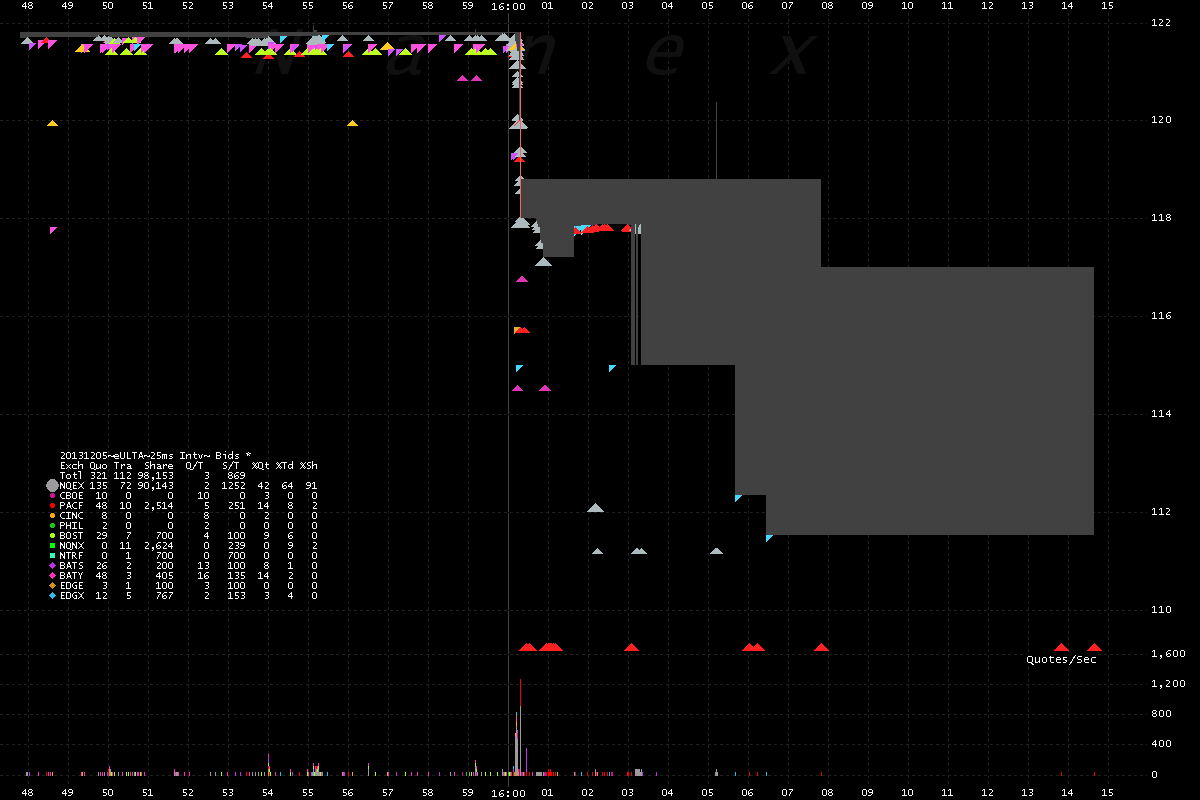
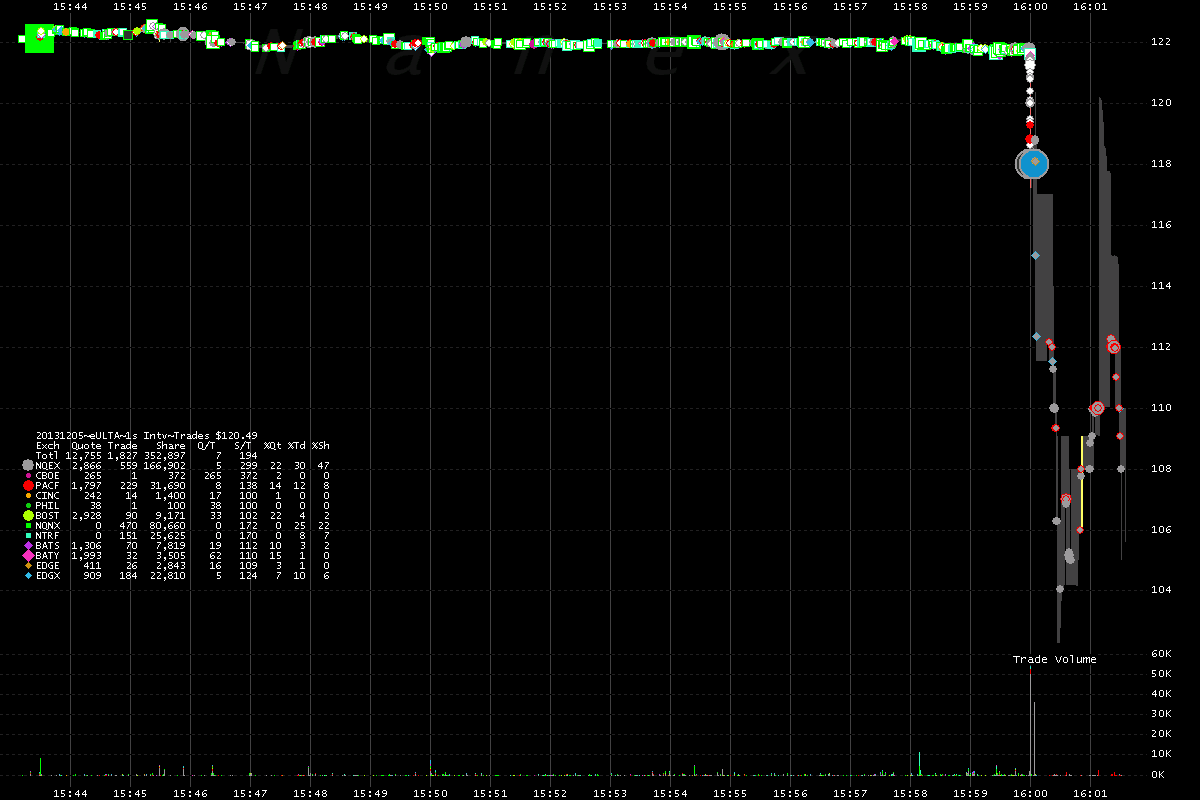
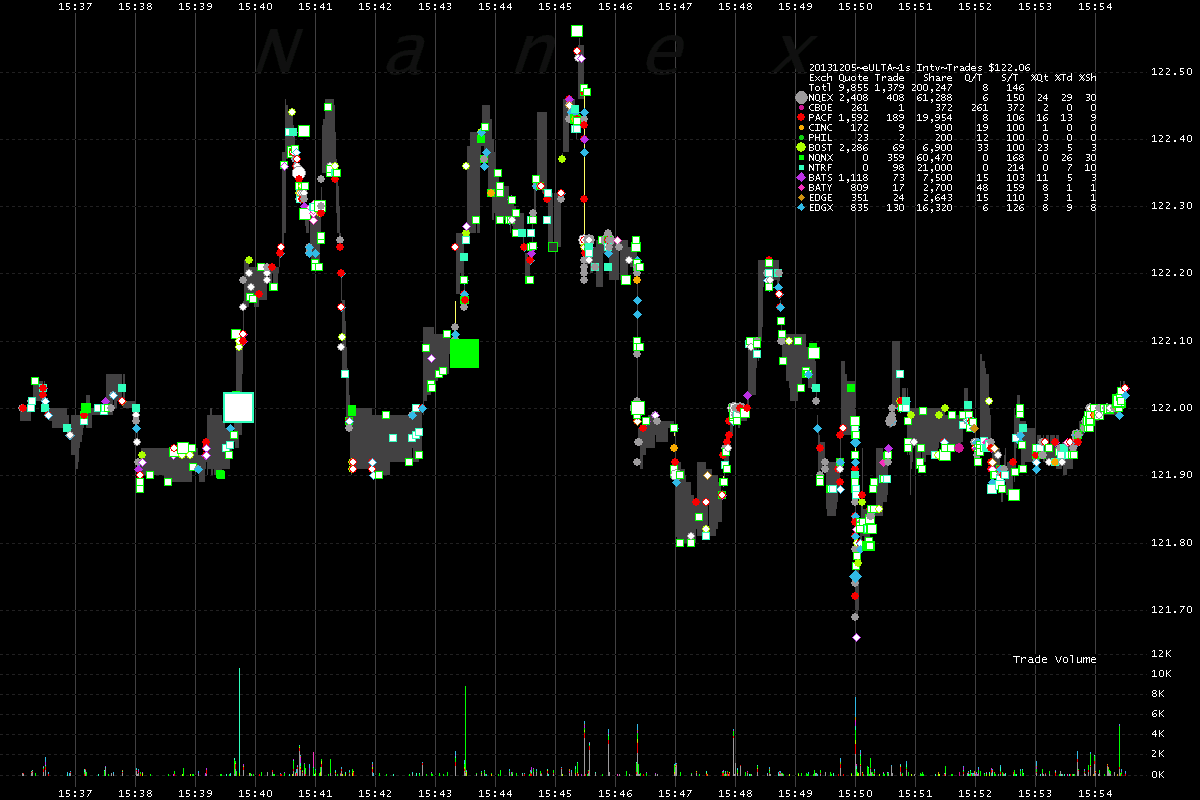
# Event Note Last trade before 16:00 was $121.80 at 15:59:59.223 Not shown on chart 1 - doesn't fit! 1 Market closing time - 16:00 Eastern Shouldn't see any more regular/ISO trades after (to the right). 2 Earnings released by high speed machine readable news services About 175 milliseconds after closing time. 3 Form-T trades from EDGE and BAT-Y An indication that the market has closed. 4 Regular trades from Nasdaq Shouldn't see these here, the market should be closed! 5 ISO trades from NY-ARCA Shouldn't see these here, the market should be closed! 6 1,092 share ISO trade from Nasdaq Shouldn't see this here, the market should be closed! 7 1,092 share NY-ARCA "official closing" print Exactly matches ISO print on Nasdaq? 8 Nasdaq Closing Cross: $118 at 16:00:00.688 Over $3 lower than 16:00 price.
