Nanex Research

Nanex ~ 19-Dec-2013 ~ FOMC Fallout
A collection of charts showing market failure during the December 18, 2013 Federal Reserve
FOMC news release (14:00:00 ET).
Check back often for new charts
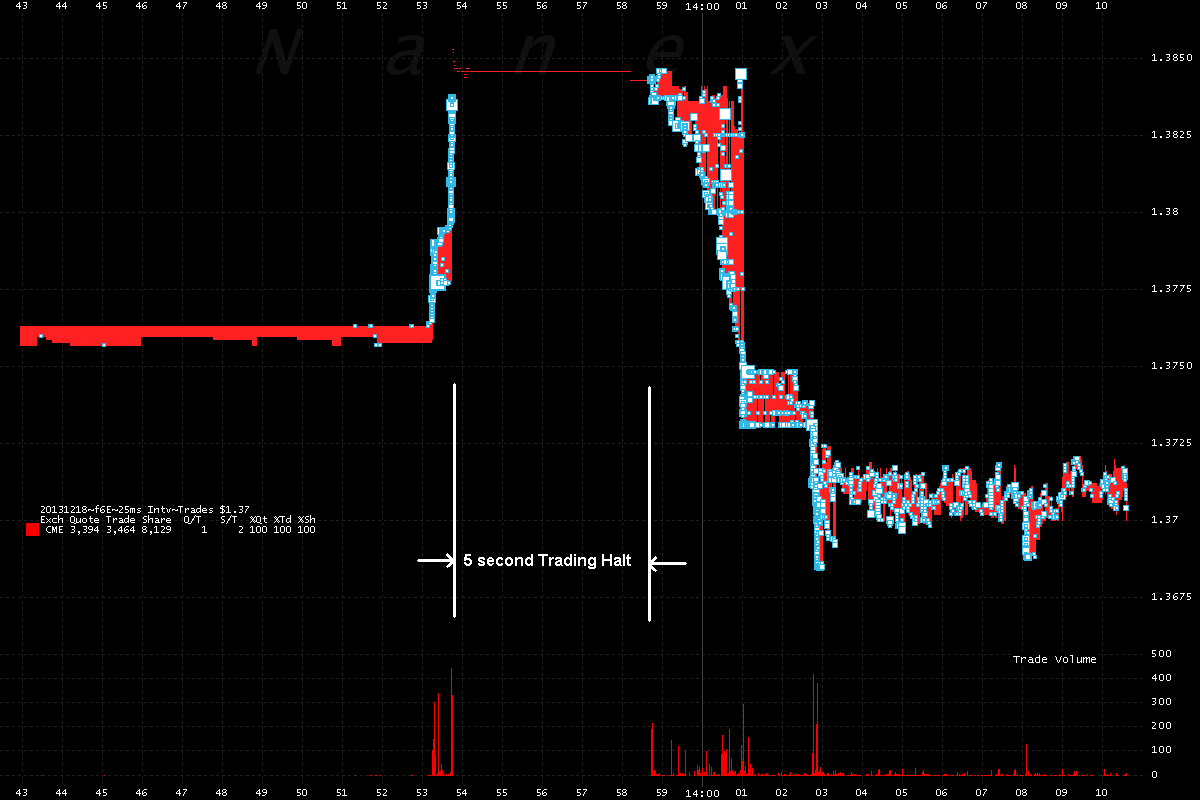
1. March 2014 Euro (6E) futures.
Note the 5 second halt which started at 13:59:53, which was 7 seconds before the official
release time.
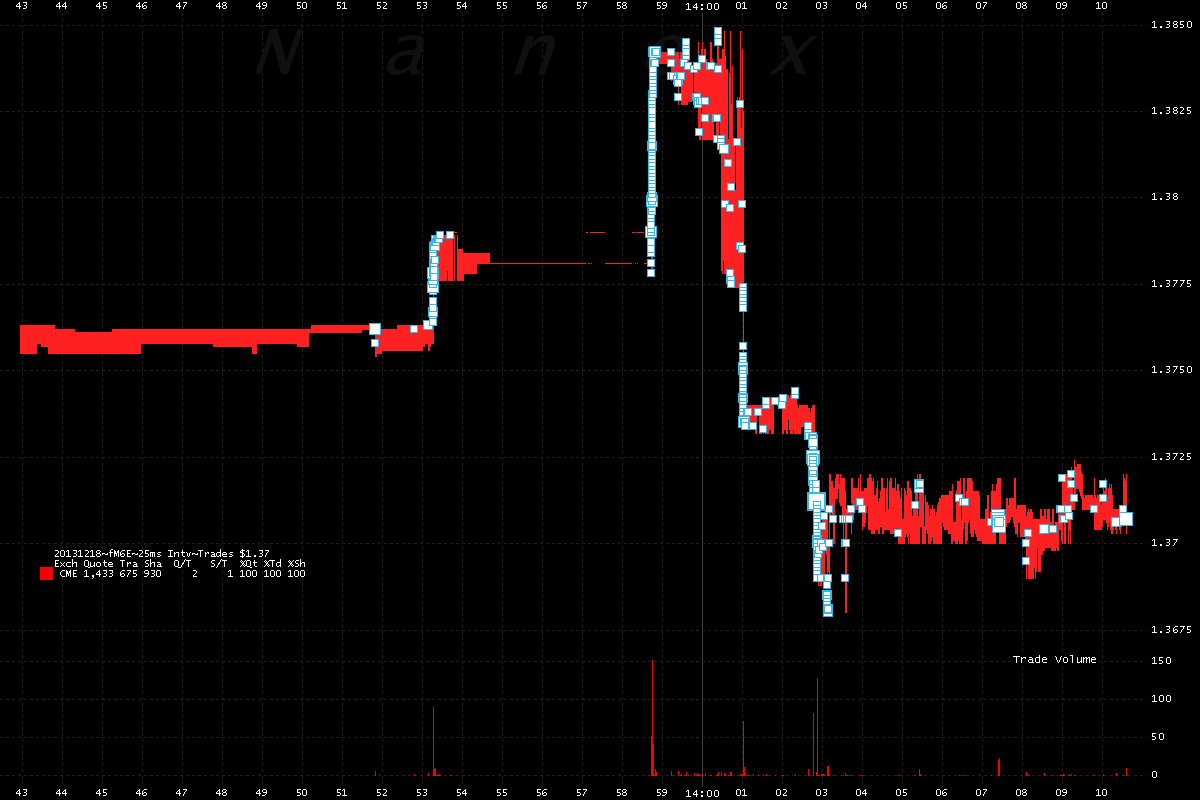
2. March 2014 Micro Euro (M6E) futures.
Halts along with 6E (chart 1) - note however, this contract price surges after the halt,
whereas the 6E does not.
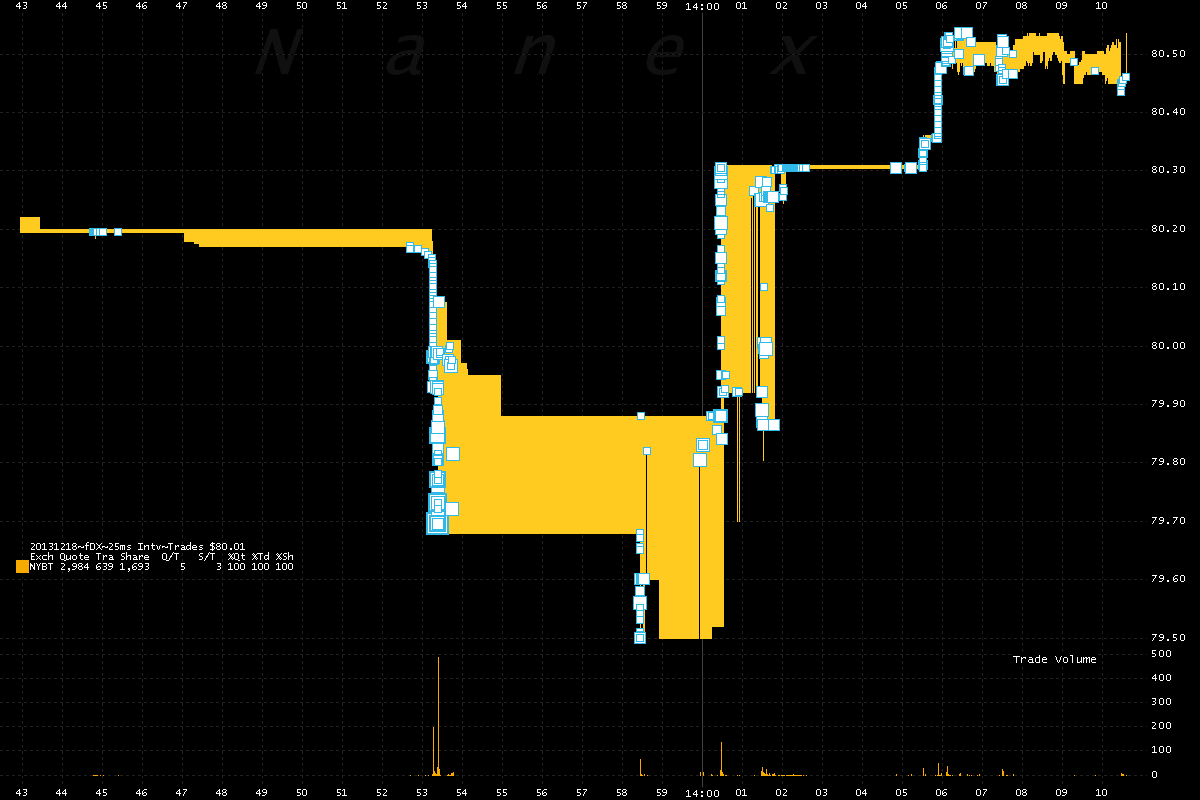
3. March 2014 Dollar Index (DX) futures.
Unsure if this market was halted, or it stopped trading in sympathy with euro futures.
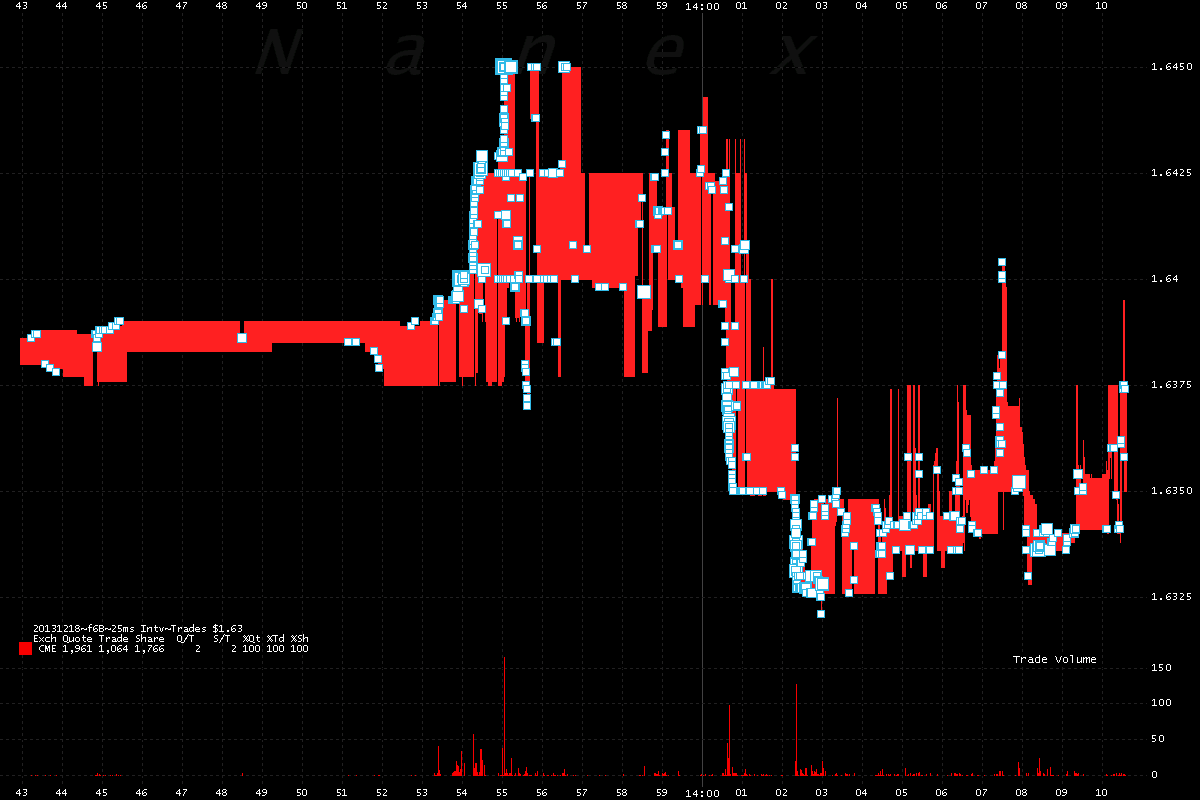
4. March 2014 British Pound (6B) futures.
Just look at that spread! And trades are executing all over.
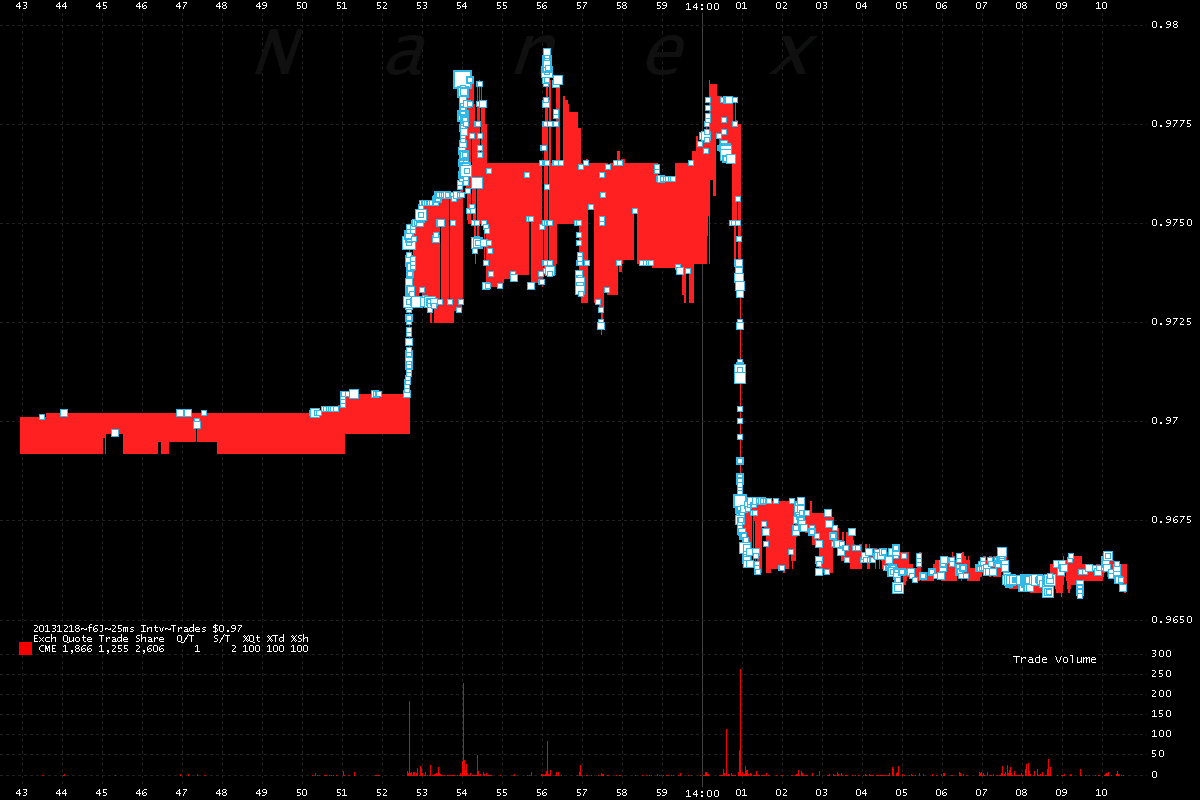
5. March 2014 Japanese Yen (6J) futures.
Similar to British Pound futures - wide spread and trades executing to and fro.
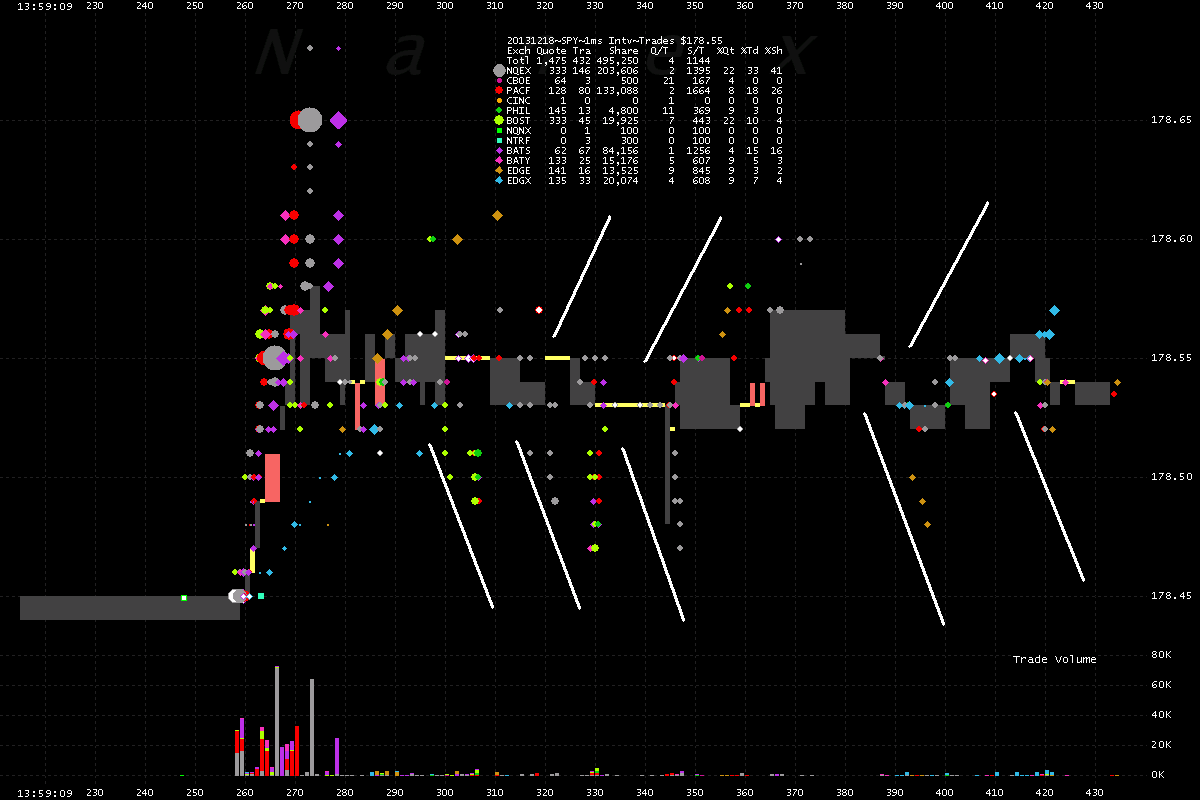
6. SPY Trades and NBBO over 1/5 of a second of time starting 13:59:09.230 -
50 seconds before 14:00.
Note the up and down oscillations indicated by the white diagonal lines.
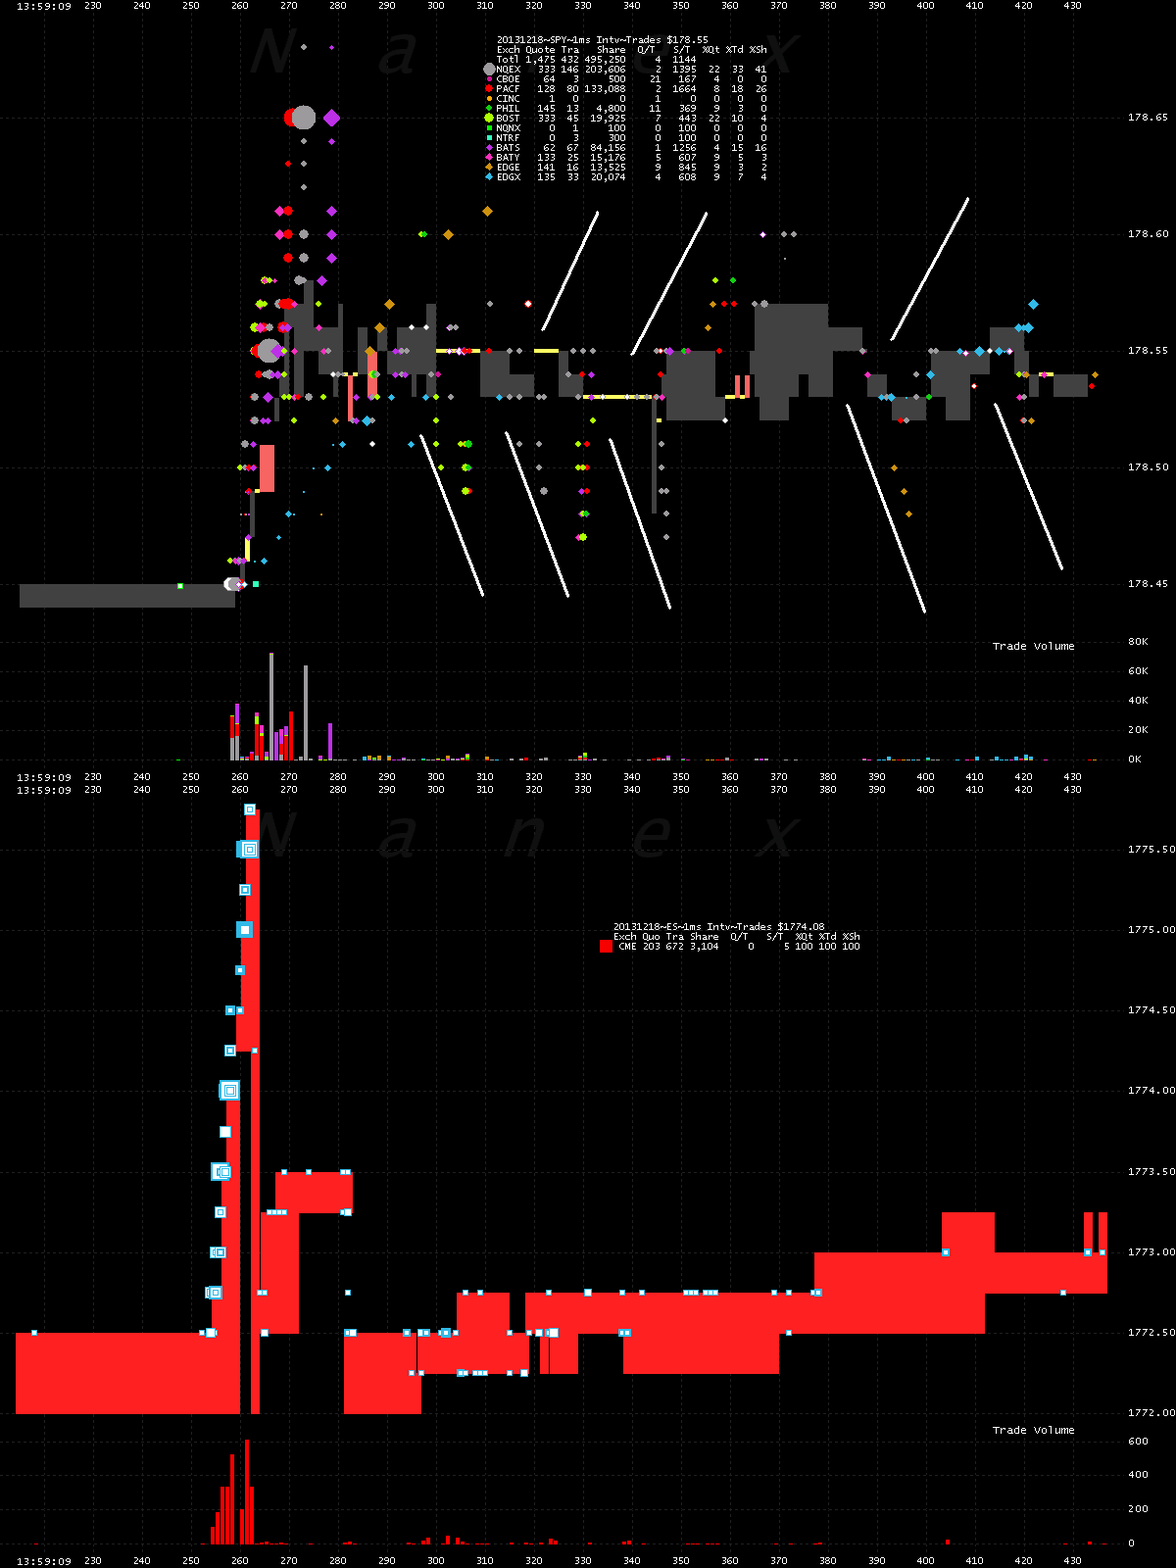
7. Chart above (SPY) alternating with March 2014 eMini (ES) futures
The eMini (ES) in Chicago moves about 6 milliseconds before SPY in NY - which means
ES moved first and SPY is reacting when that information reaches New York.
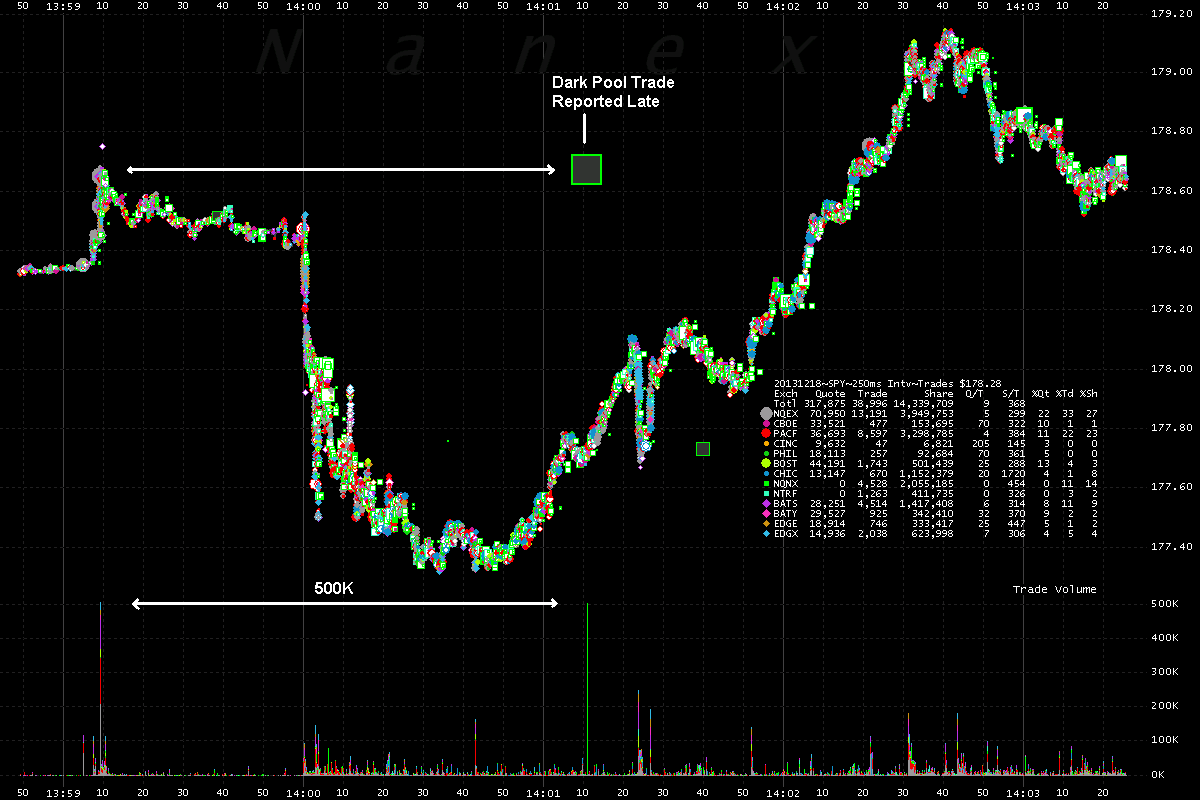
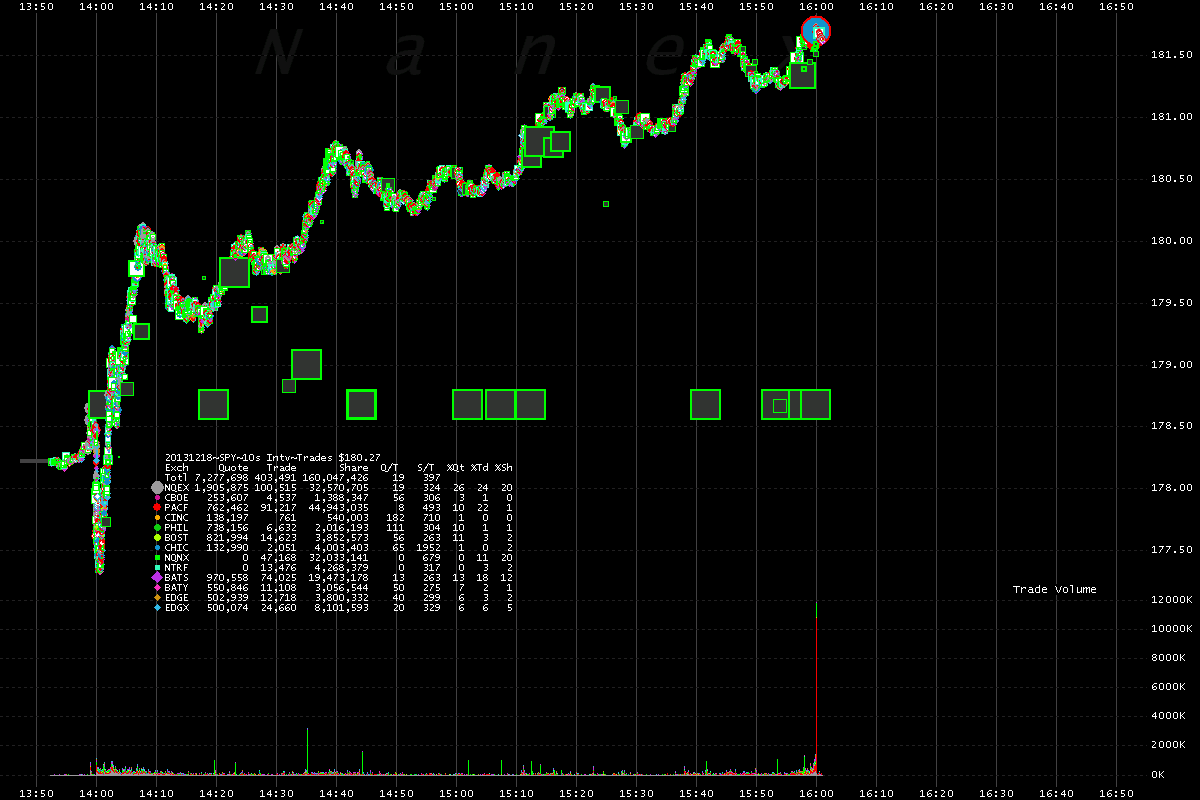
8. SPY Trades.
Note the huge (500,787 share) trade (obviously) reported late from a dark pool - nearly
identical to the number of shares recorded during the sudden jump at 13:59:09.
9. SPY Trades from 13:50 to the Close.
Note the many huge (500K share) trade dark pool trades.
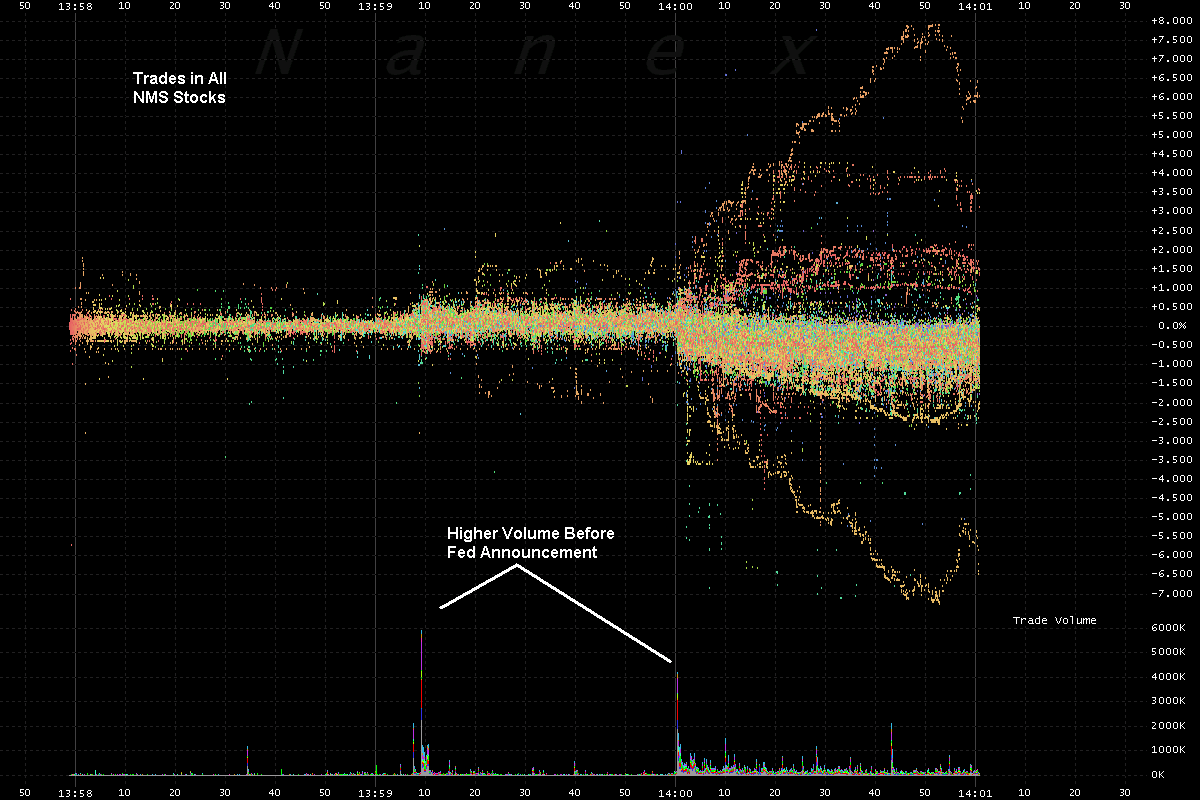
10. Trades in All (~8000) NMS Stocks.
More shares trade at 13:59:09 than when Fed news is released at 14:00:00.
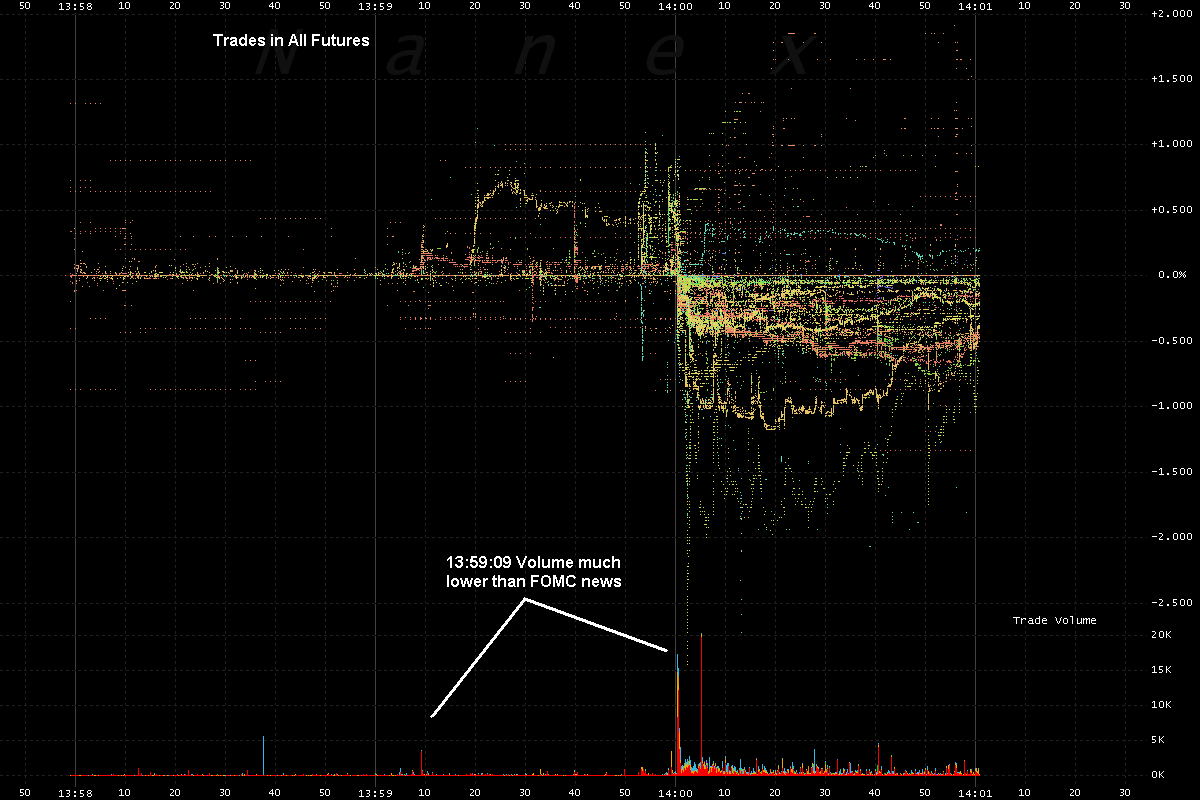
11. Trades in All Futures.
Nanex Research
Inquiries: pr@nanex.net


