Nanex Research

Nanex ~ 03-Jan-2014 ~ Diabolical Manipulation in AutoZone (AZO)
Every so often, a High Frequency Trading (HFT) manipulation pattern will clearly emerge,
such as on January 3, 2014 shortly after 15:30 Eastern Time in the stock of AutoZone,
Inc (symbol: AZO, market cap: $16 Billion). This particular manipulation pattern matches
an event we spotted on July 10, 2013 in Apple.
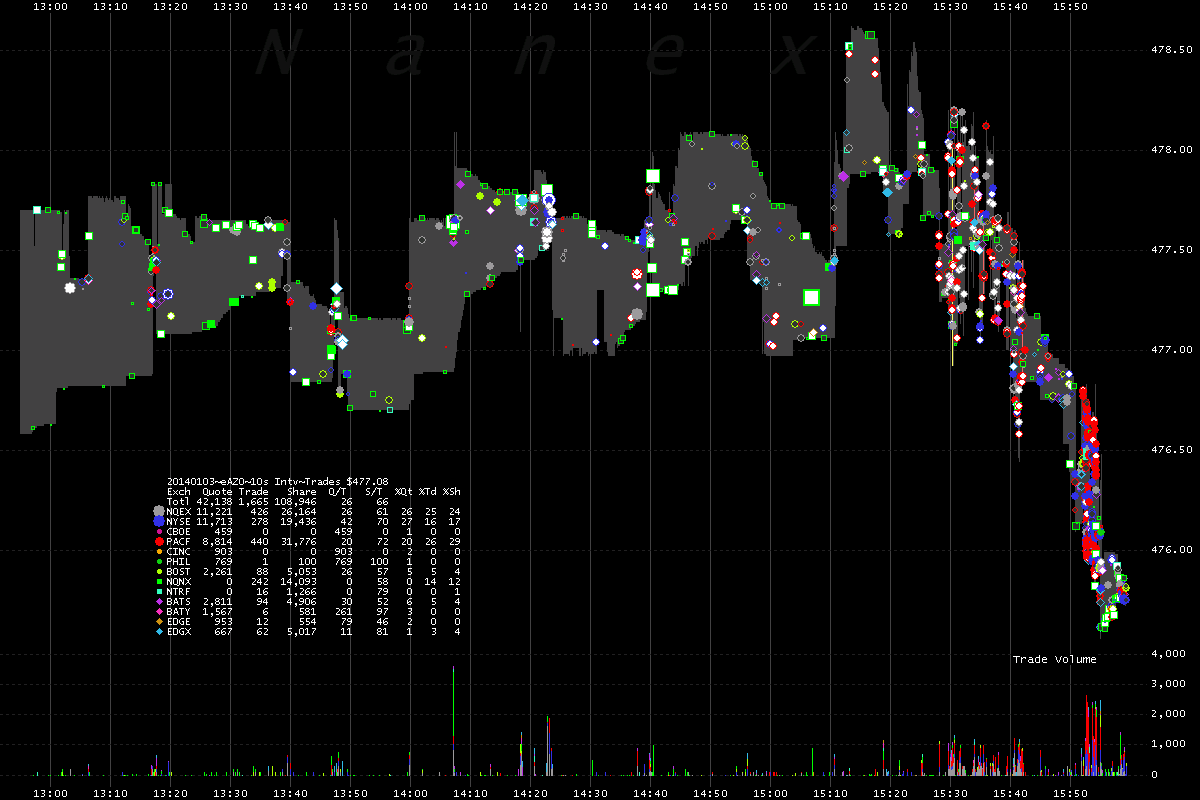
1. AZO - Trades color coded by reporting exchange and NBBO (gray shading).
Note the sudden change after 15:30.
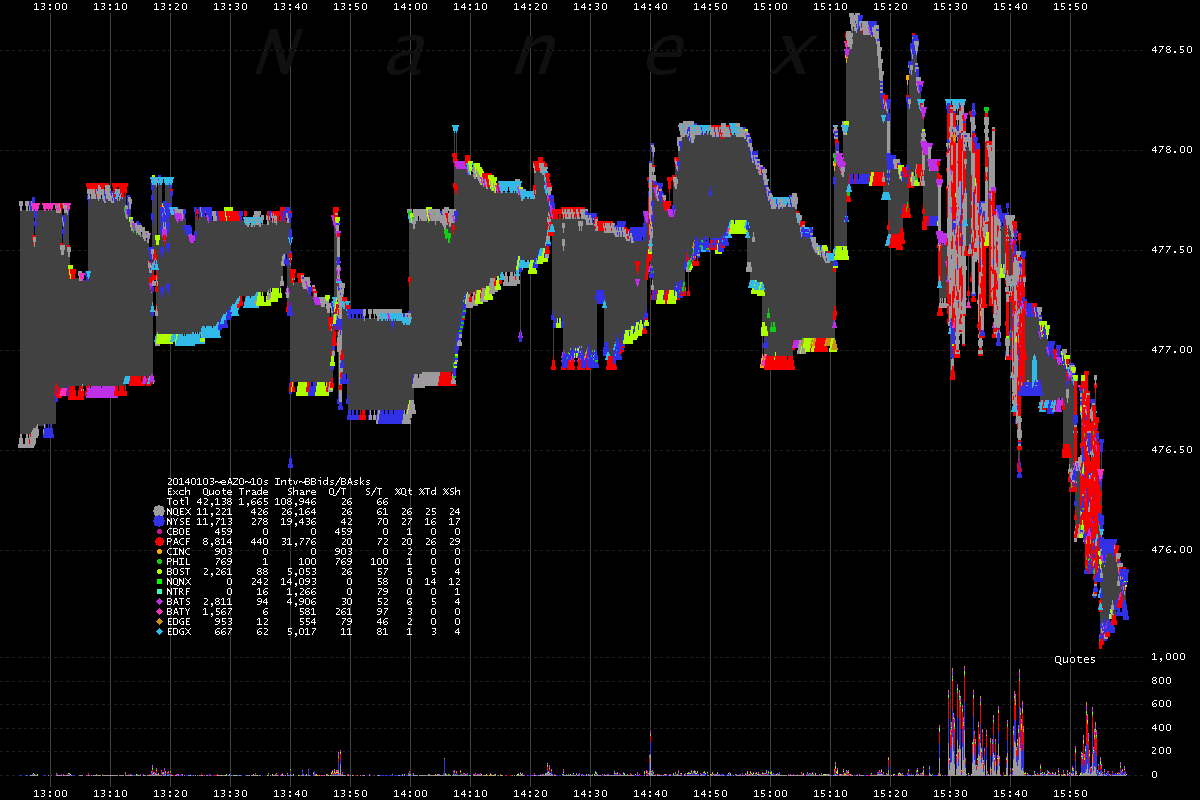
2. AZO - Best bids and asks color coded by reporting exchange and NBBO (gray
shading).
It's easier to spot the sudden change by looking at the extreme jump in quote
activity.
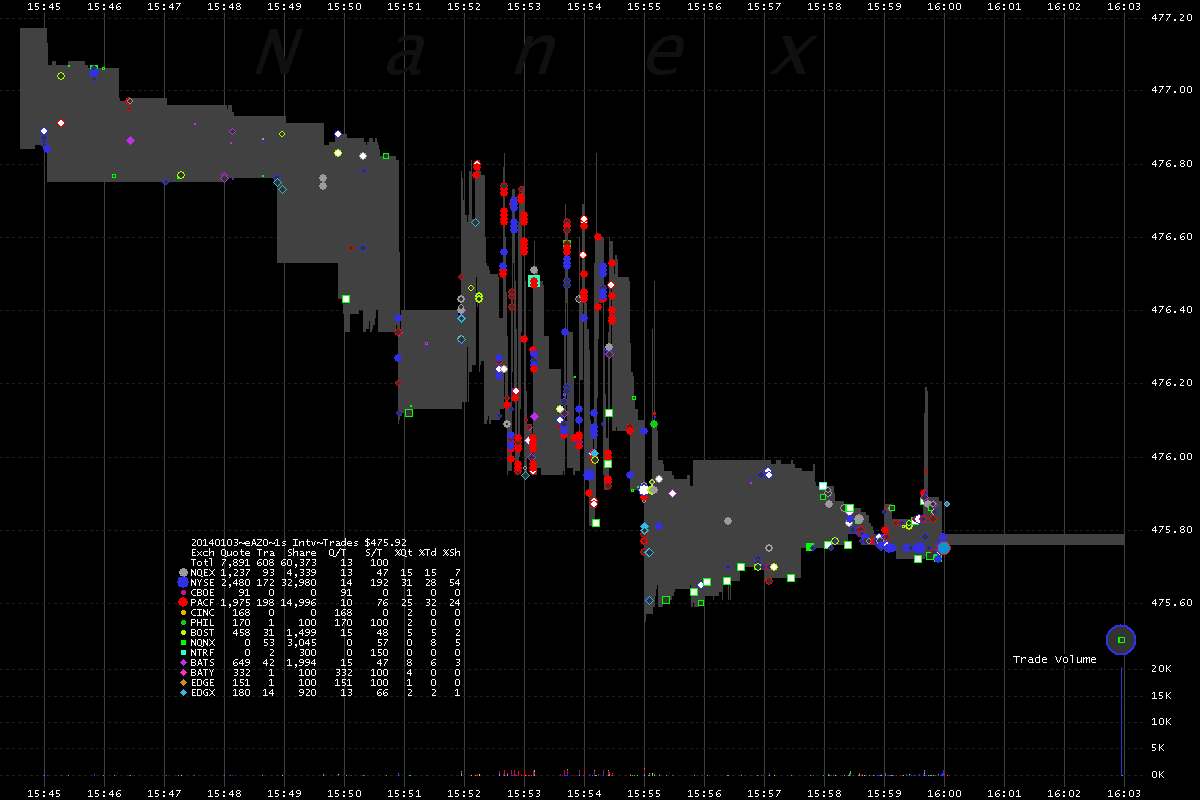
3. AZO - Zooming in on 17 minutes of Chart 1.
Prices suddenly start oscillating rapidly over a wide range.
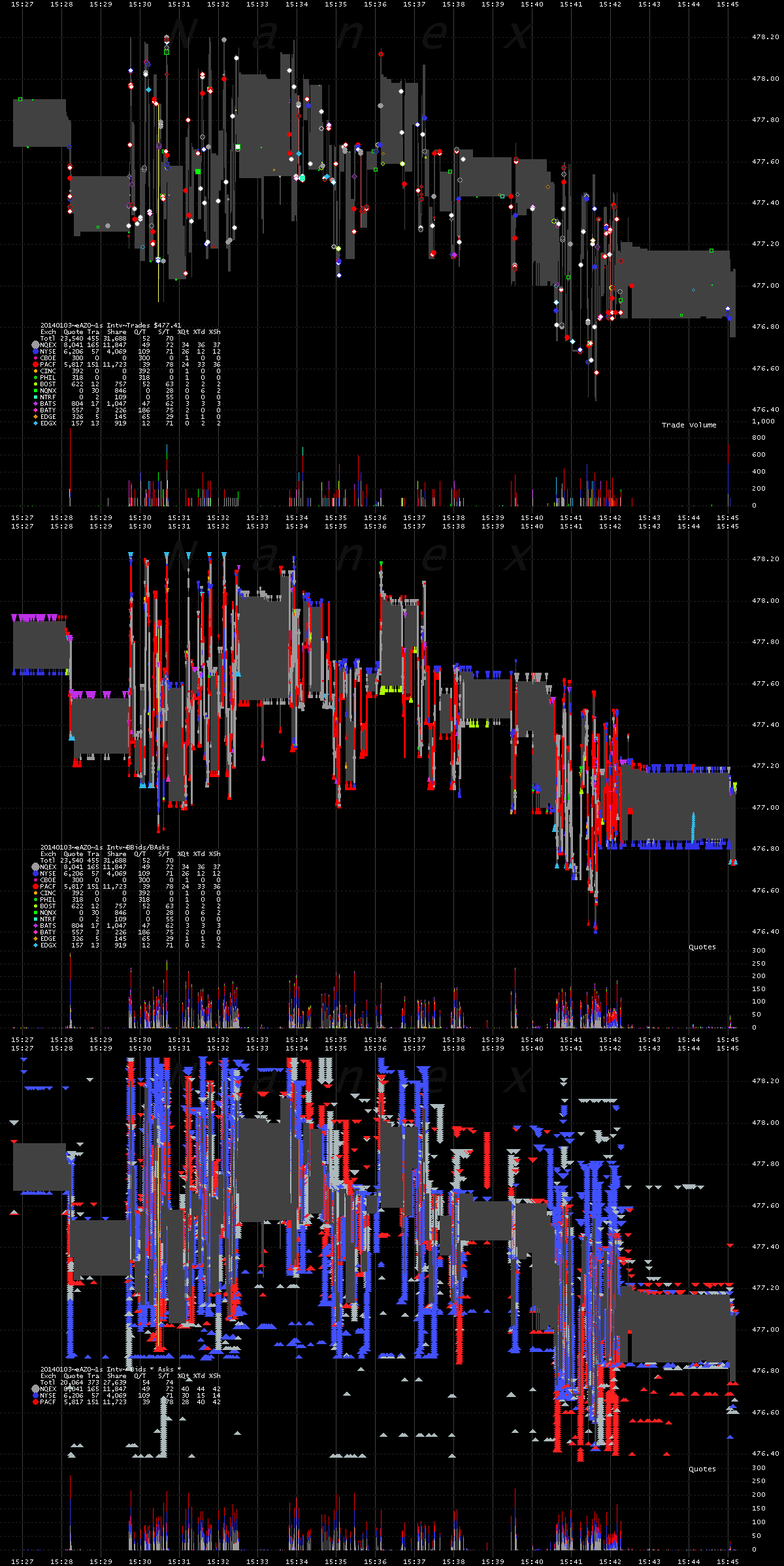
4. AZO - Zoom of about 17 minutes. Image alternates between trades,
best bids/asks, and all bids/asks.
Most of the quotes are from NY-Arca (red), Nasdaq (white) and NYSE (blue). Is it the
4th of July?
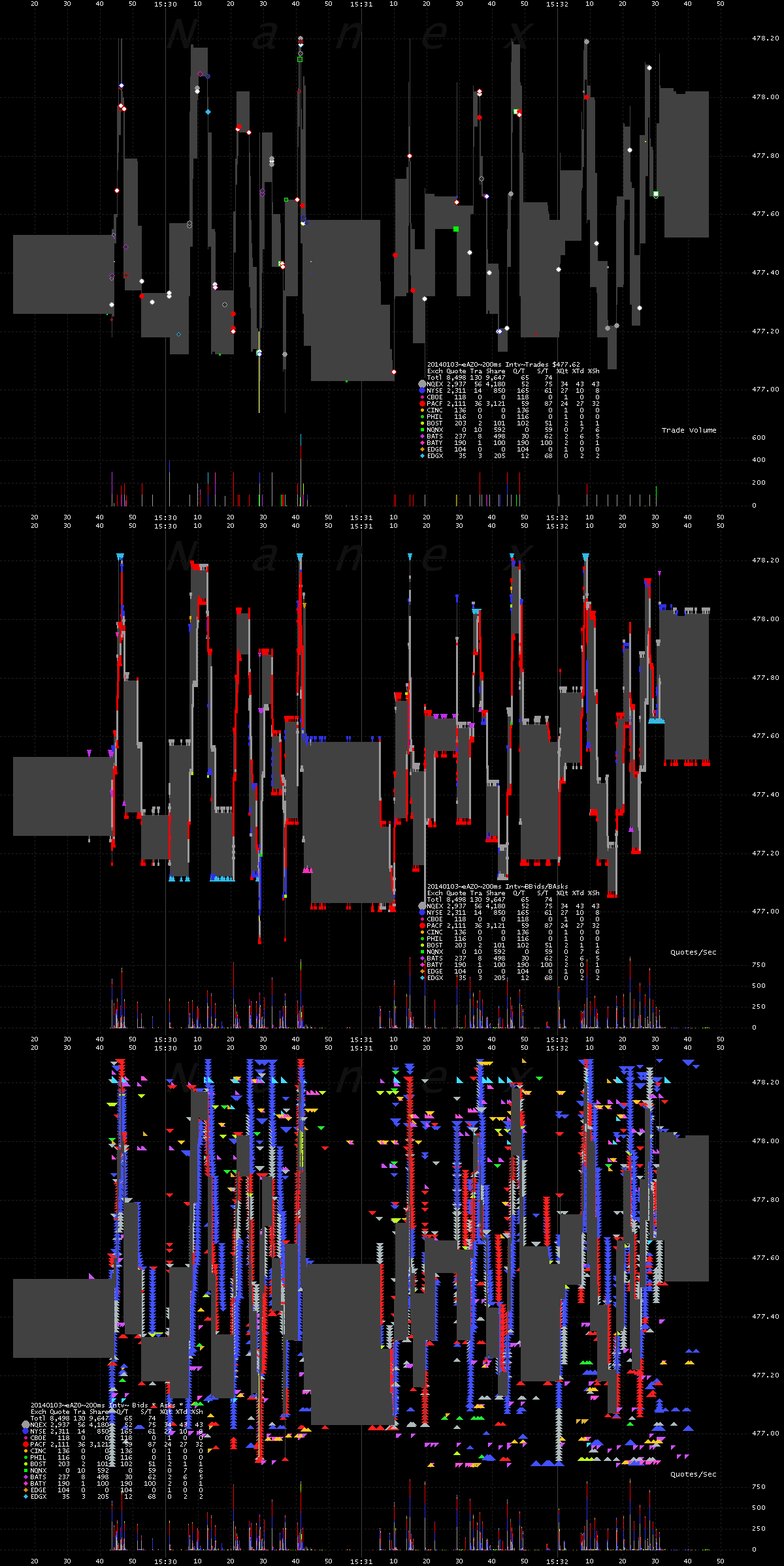
5. AZO - Zoom of about 4 minutes. Image alternates between trades, best
bids/asks, and all bids/asks.
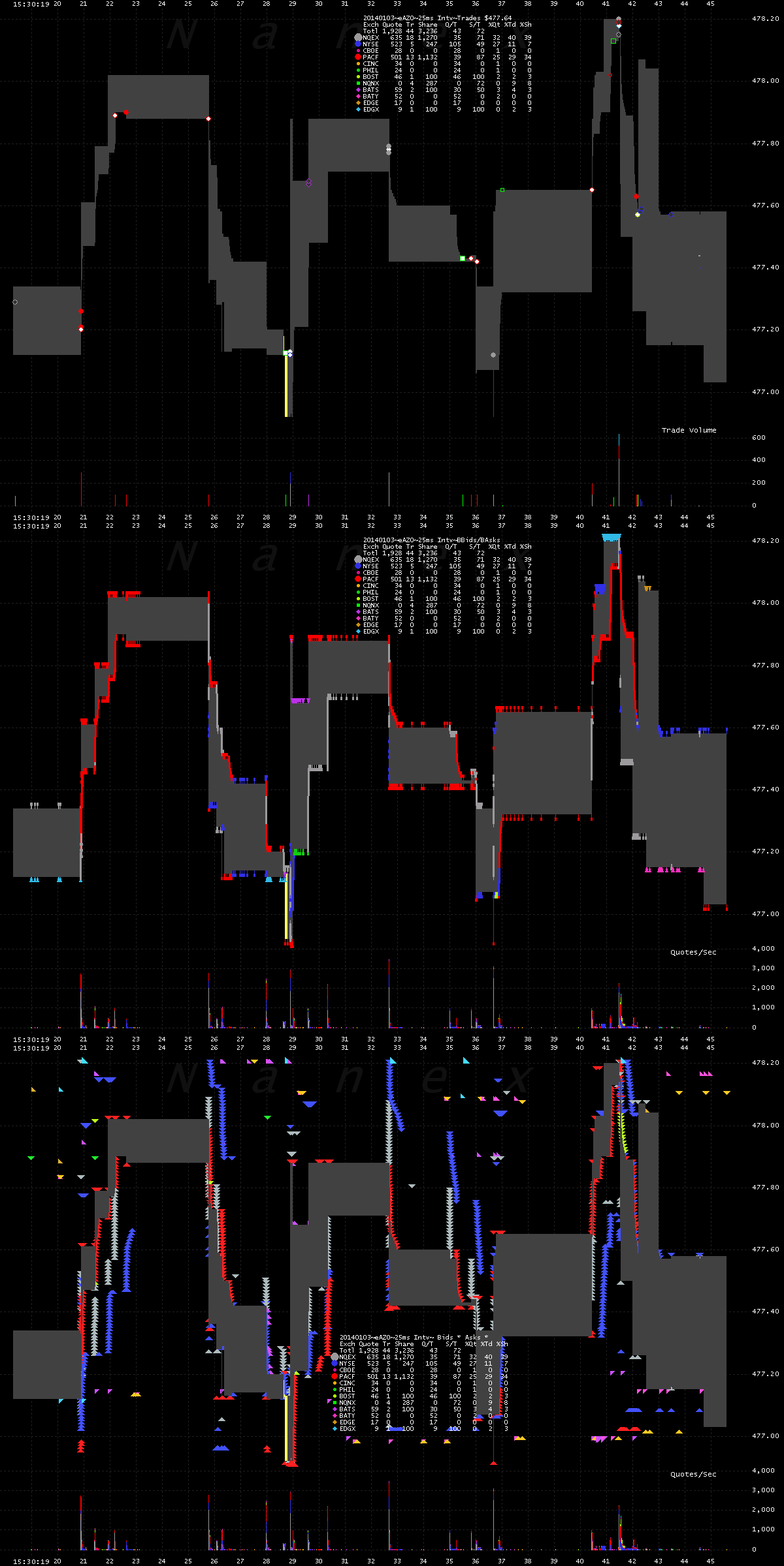
Looking closer, it's pretty clear that this HFT manipulation scheme induces
other algos (and humans) to buy high and sell low. Ingenious.
6. AZO - Zoom of about 30 seconds. Image alternates between trades, best
bids/asks, and all bids/asks.
Nanex Research
Inquiries: pr@nanex.net


