Nanex Research

Nanex ~ 07-Jan-2014 ~ Facebook Liquidity

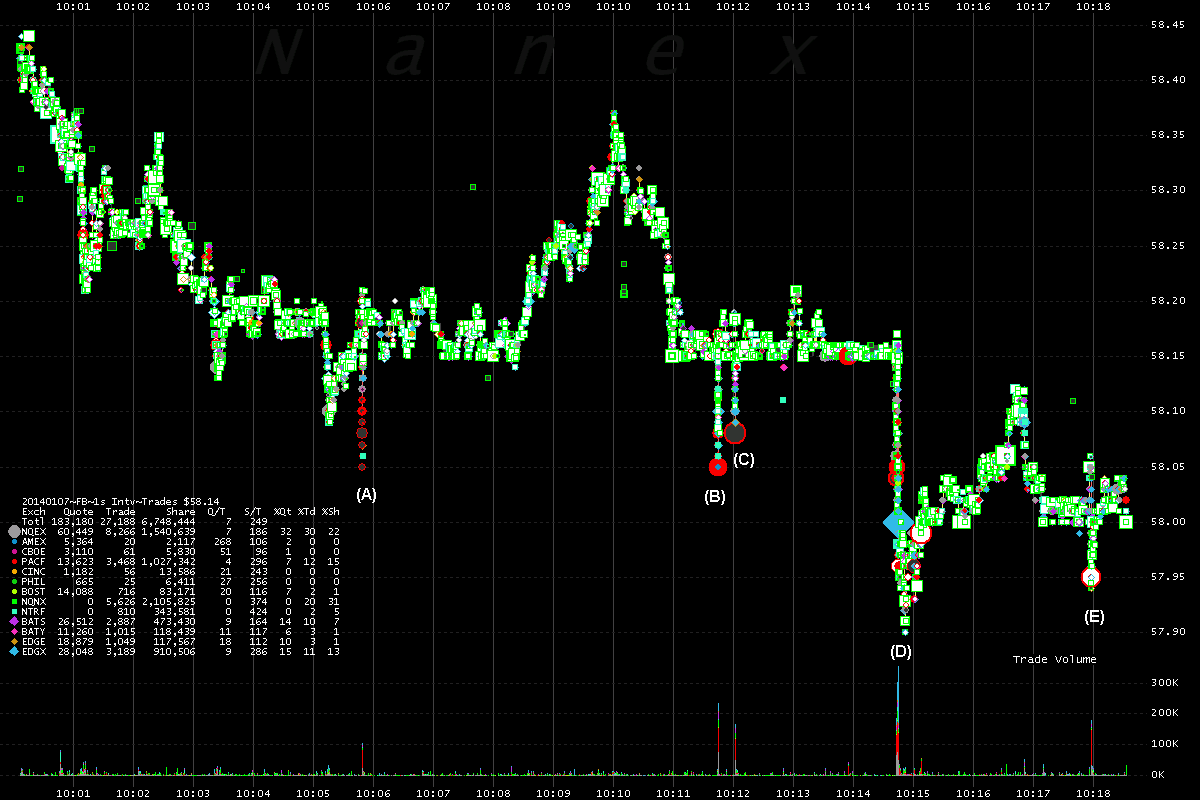
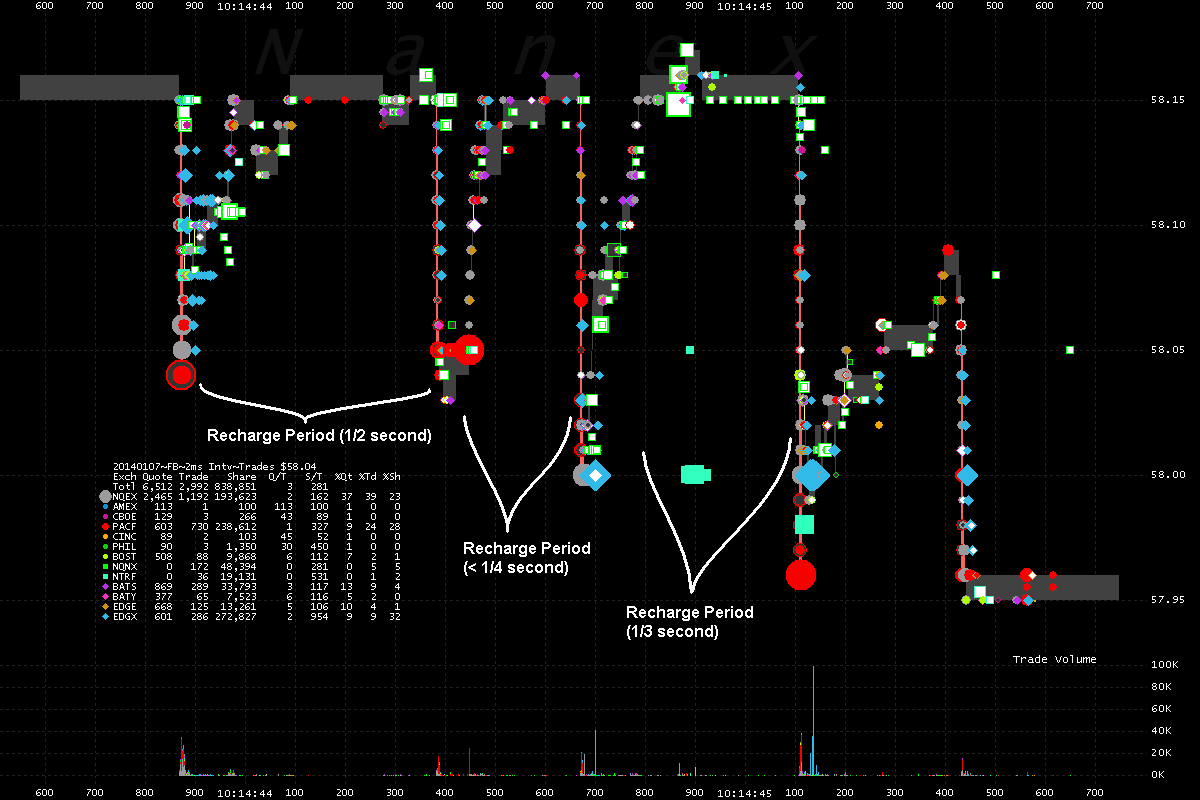
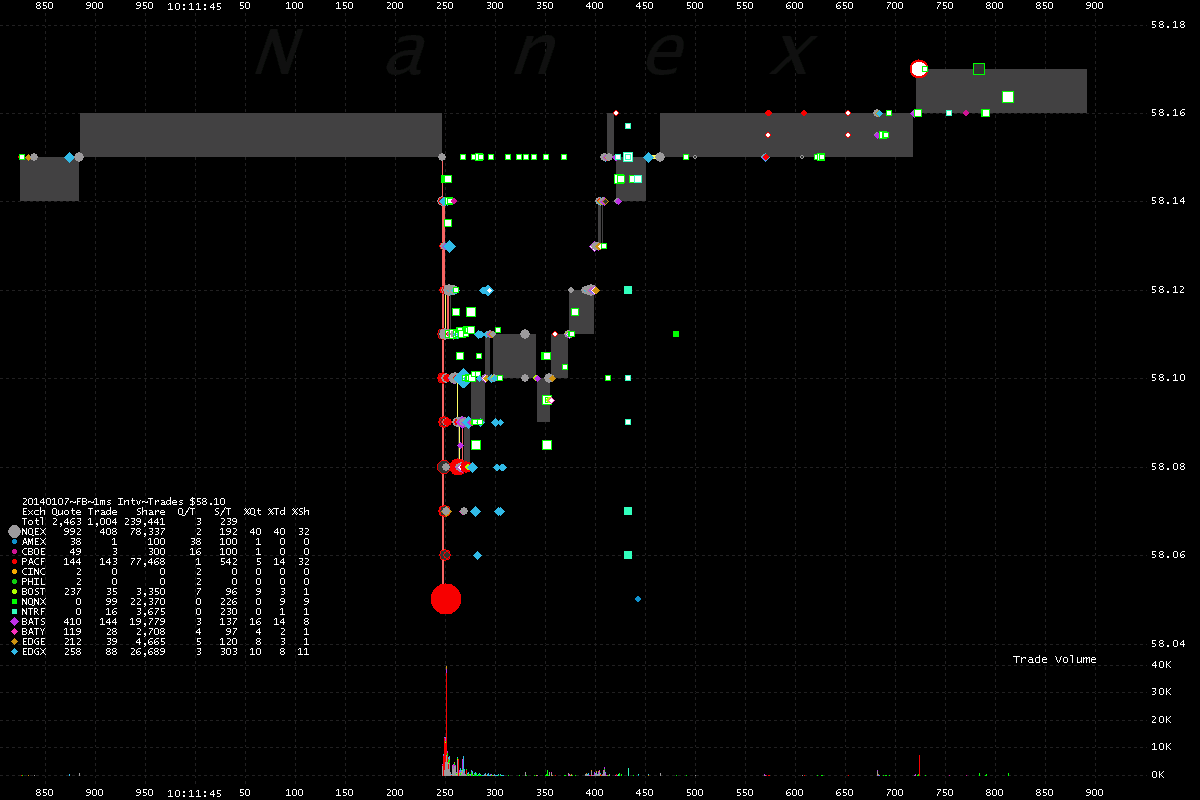
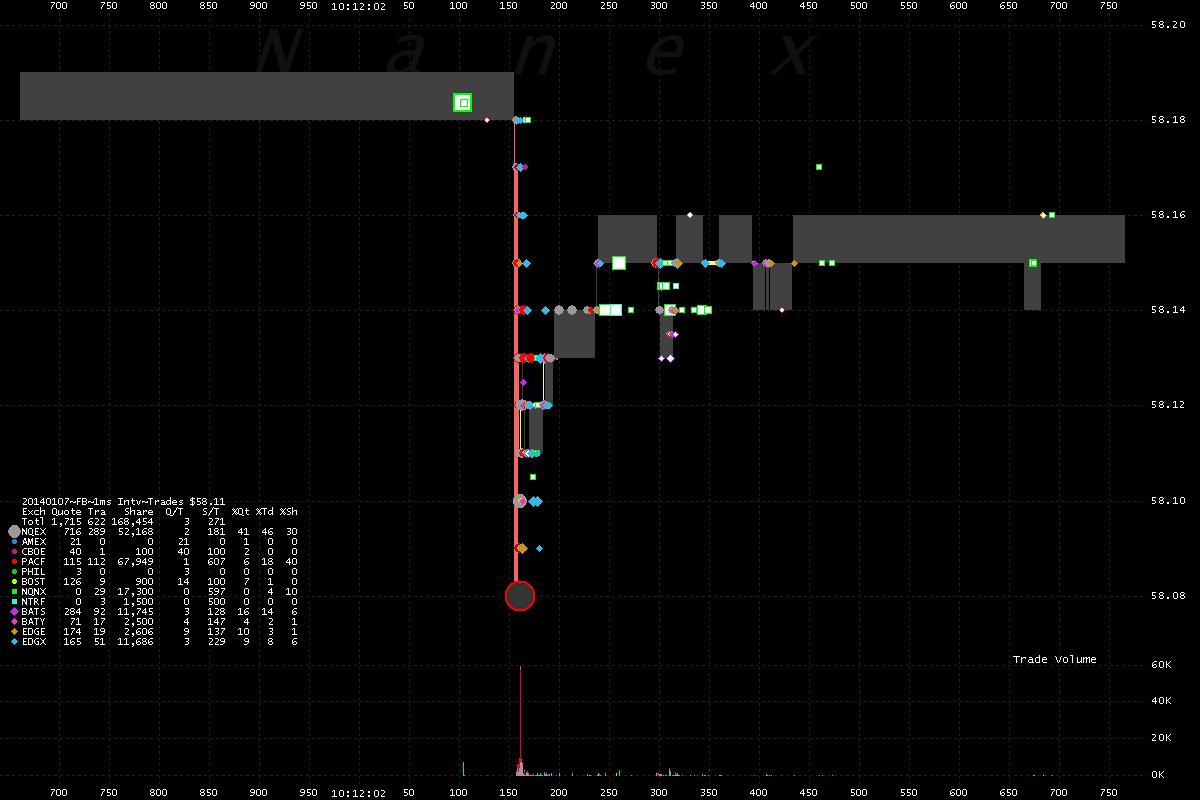
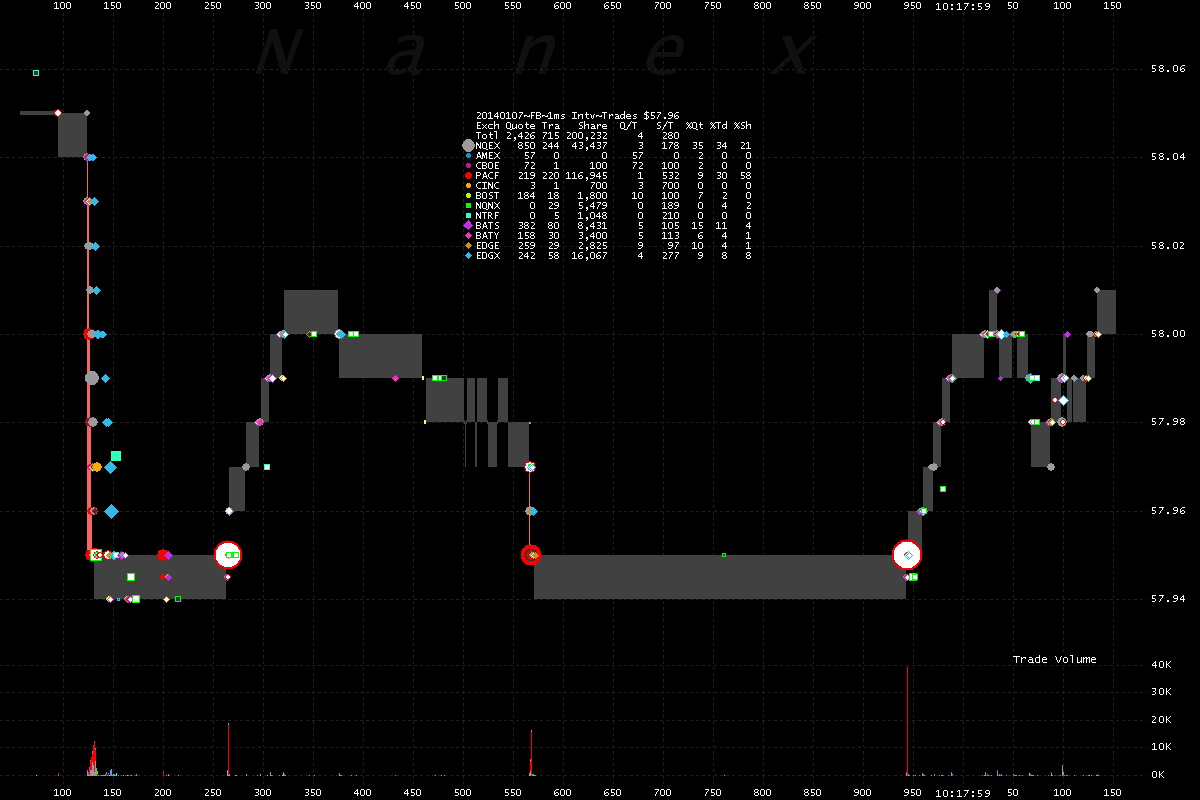
On January 7, 2014 there was unusual trading in the stock of Facebook shortly after 10am ET. Sudden bursts of trades would tear through the order book. In one case, this repeated 4 times in 2 seconds, allowing us to see how fast liquidity returns (and therefore could disappear).

1. FB - Trades color coded by reporting exchange and NBBO (gray shading).
We will zoom in on the labels (A) through (E) in the charts below.


2. Zoom of a 2-second period of trading in Facebook (D).
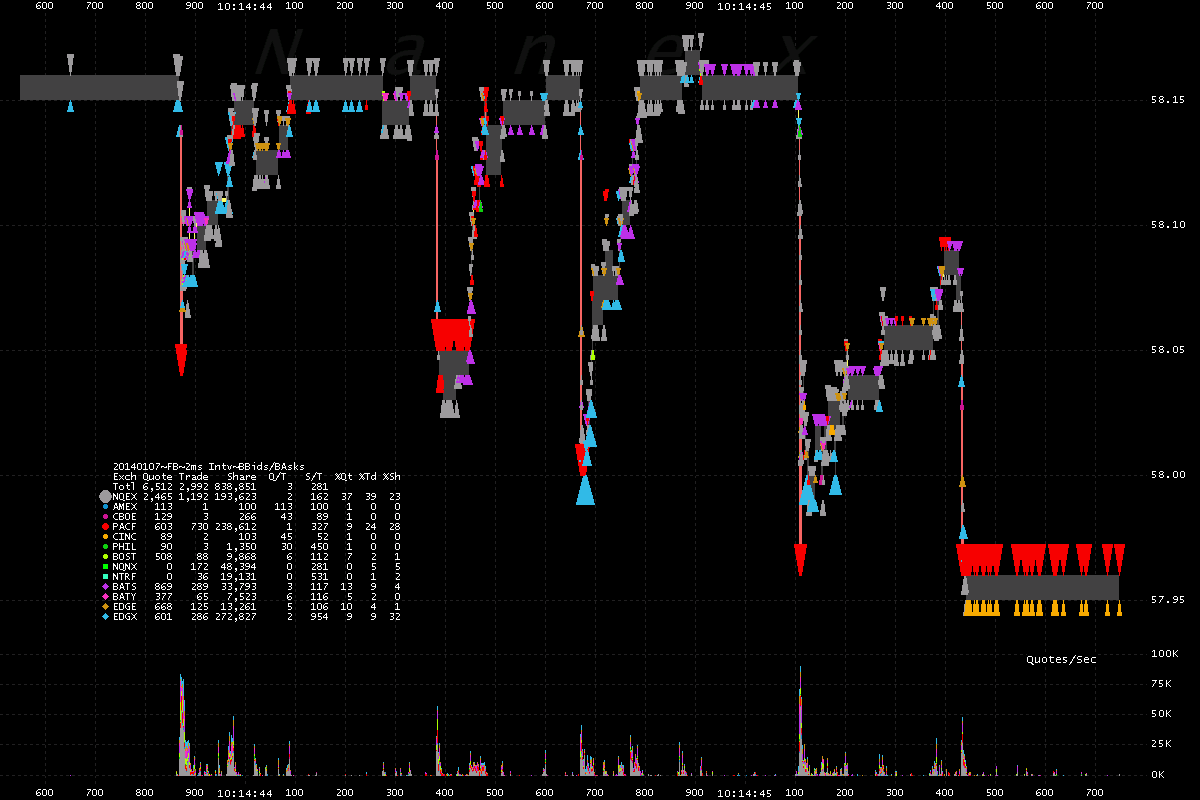
This is a fascinating chart. Notice that orders must have populated order books in a fraction of a second after each sudden drop (because those orders would have executed during the drop). We can see how easily malleable the price of the stock is - by how much the price moves in response to the burst of trades.


3. Zoom of period (D) - showing best bids and asks.


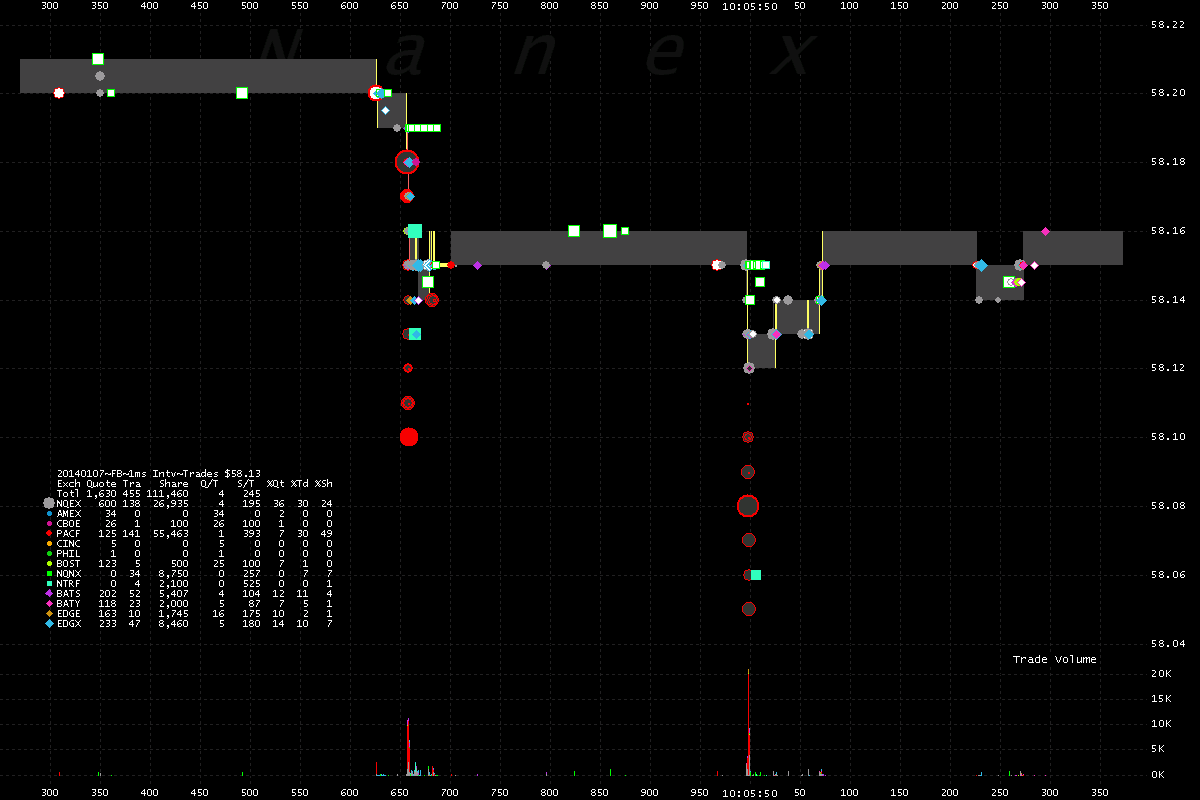
4. Zoom of a 1-second period of time (A).


5. Zoom of a 1-second period of time (B).


6. Zoom of a 1-second period of time (C).


7. Zoom of a 1-second period of time (E).


An additional 11 charts of Facebook later on the same day showing the same phenomenon.
Each chart shows 2 seconds of time. Note that the blue diamonds (trades reported by Direct Edge), often appear shifted to the right of other trades. These are simply getting reported late by the exchange.


Facebook Trades and NBBO's by reporting exchange for the regular trading session.

Charts alternate between showing NBBO and Trades. The first 2 show all reporting exchanges, followed by a pair of charts for each reporting exchange. Note that some exchanges (e.g. EDGE and BATY) rarely set the NBBO, but have a significant number of trades. The last 2 charts show trades from TRF's (Trade reporting facilities, which is how Dark Pools report trades). Dark Pools do not post quotes, so there are no corresponding NBBO charts for those.

The legend (right) gives useful information on Quote, Trade and Share counts and ratios of these, such as Shares/Trade which gives the average trade size for all exchanges (Totl column) as well as individually for each reporting exchange.


Nanex Research

Inquiries: pr@nanex.net