Nanex Research

Nanex ~ 15-Jan-2014 ~ Salesforce.com's $1.3 Billion Rise
and Fall
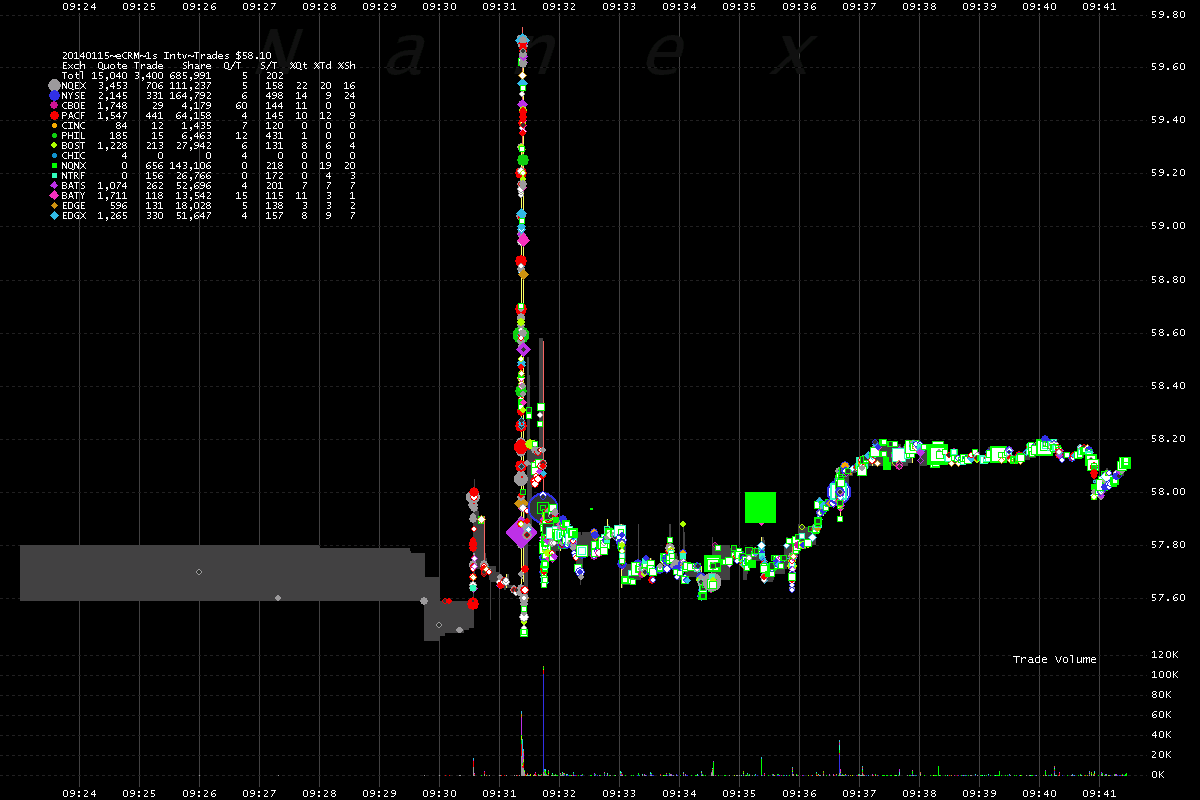
Shortly after market open (9:31:22) on January 15, 2014, the stock of Salesforce.com,
Inc (symbol: CRM, market cap $35 Billion, give or take a billion) rocketed from
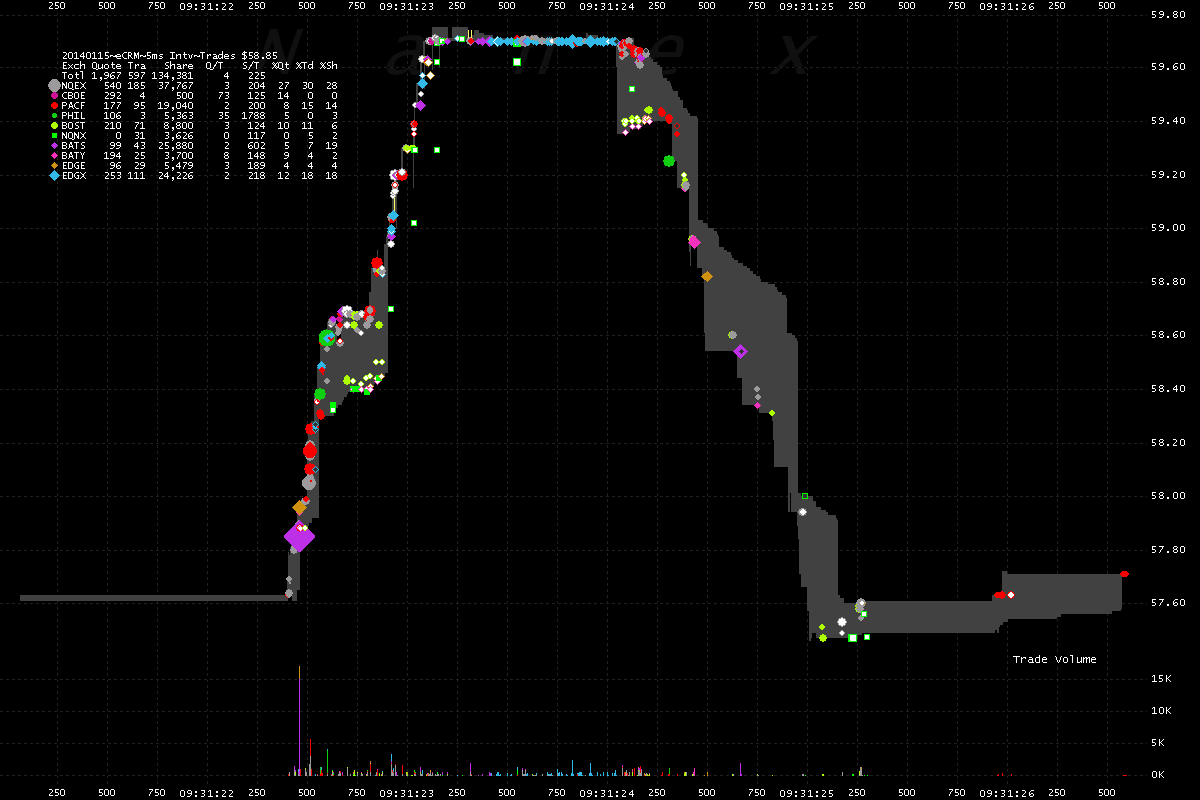
57.63 to 59.71 (almost 4%) in about 3/4 of a second..
There were 10 exchanges loaded
with hungry high frequency traders (HFT) and an unknown number of
dark pools: all providing liquidity, to the tune of approximately 100,000 shares and 400 trades.
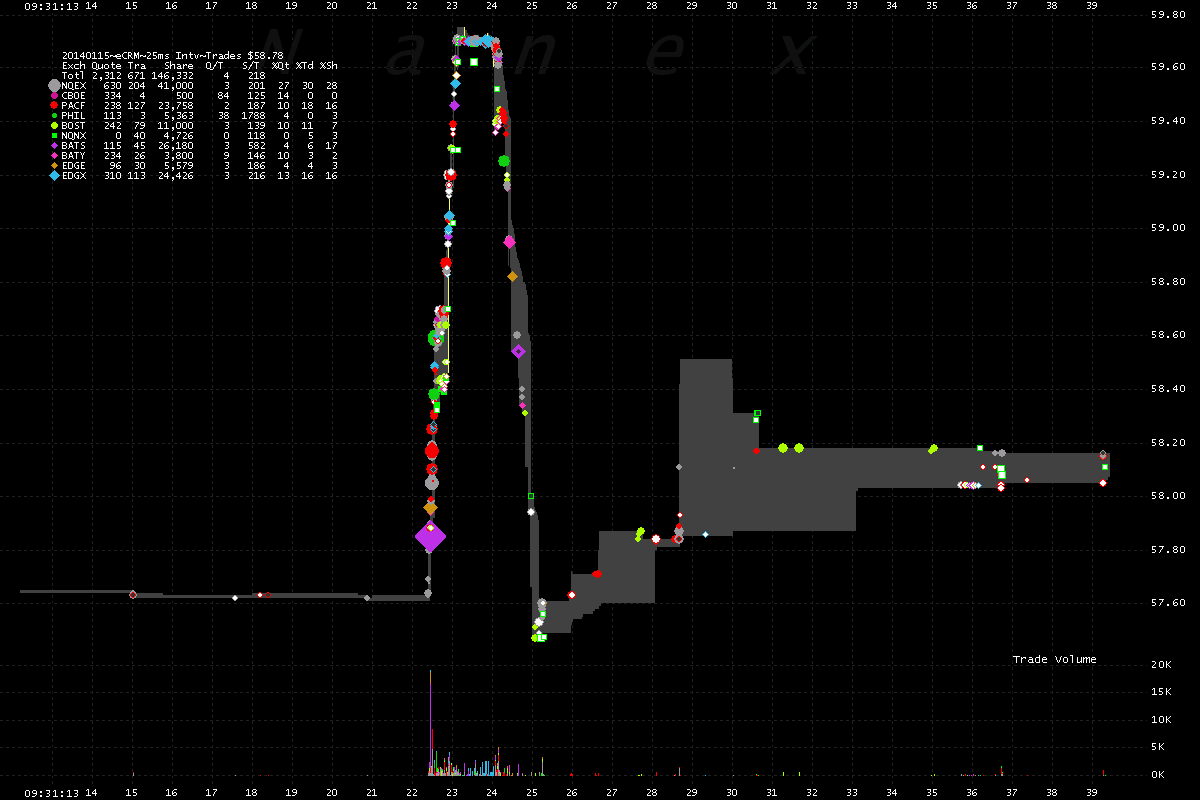
Within 2 seconds, the price collapsed and the stock traded
down to 57.47 which was below where it start just a few seconds earlier. This wasn't the result of a glitch, or fat
finger, or one of the myriad of other excuses offered by proponents of high frequency
trading (HFT). To HFT, this event was picture perfect.
For anyone to claim this behavior is anything but alarming, they would either have to
be ignorant, or lying, or both. The reason why
these events continue to happen, is because high frequency trading (HFT) crowds
out other market participants (those unwilling to spend $100K a month on networking
and data fees) which prevents others from taking advantage of these extreme pricing
dislocations. By the time most people saw what had happened, it was already over. For
those with stop orders or trading systems that key off of market prices, events like
these are a nightmare. How did we let our stock market deteriorate to this level?
1. CRM Trades color coded by reporting exchange from 9:24 to 9:41 Eastern Time.

2. CRM Trades color coded by reporting exchange. Zooming into about 1/2 minute
of time.

3. CRM Trades color coded by reporting exchange. Zooming into about 5 seconds
of time.

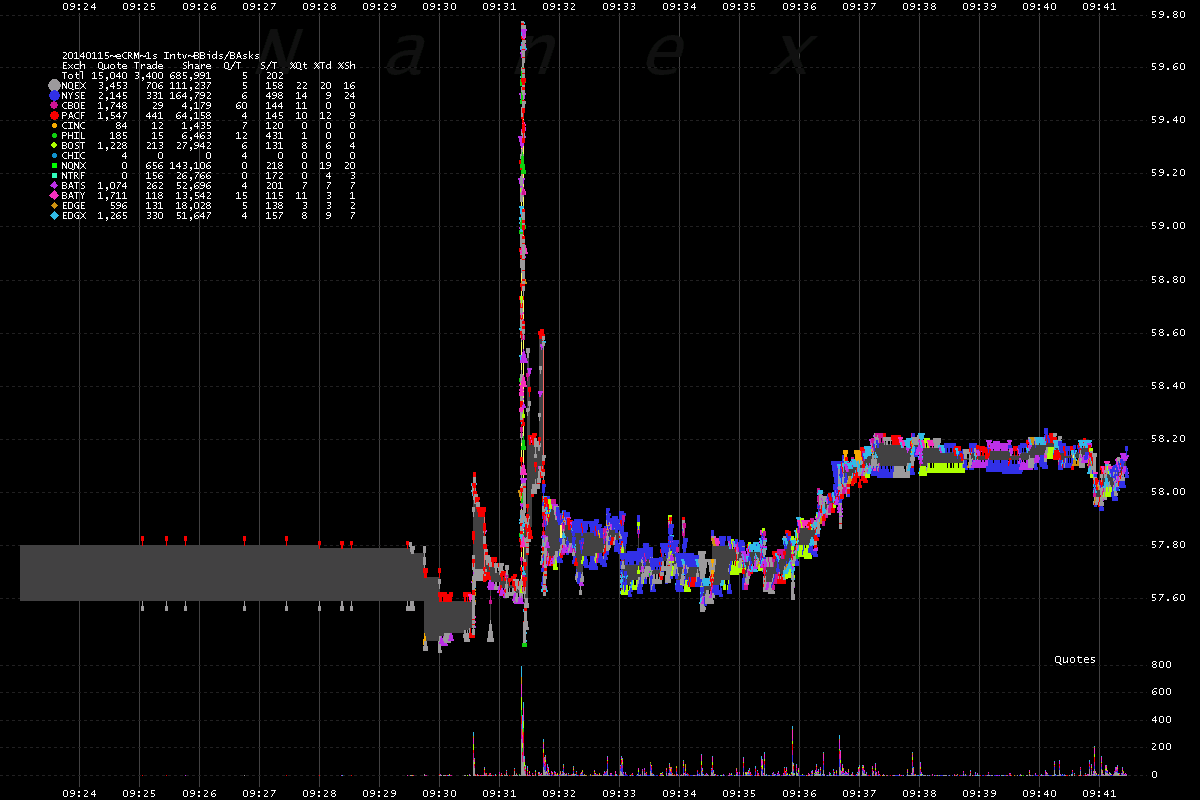
4. CRM National Best Bids and Asks (NBBO) color coded by reporting exchange.
The NBBO tracked the price all the way up, and all the way back down. In a nice tight
range.

Nanex Research
Inquiries: pr@nanex.net


