Nanex Research

Nanex ~ 28-Jan-2014 ~ Dark Pool Echo Curves
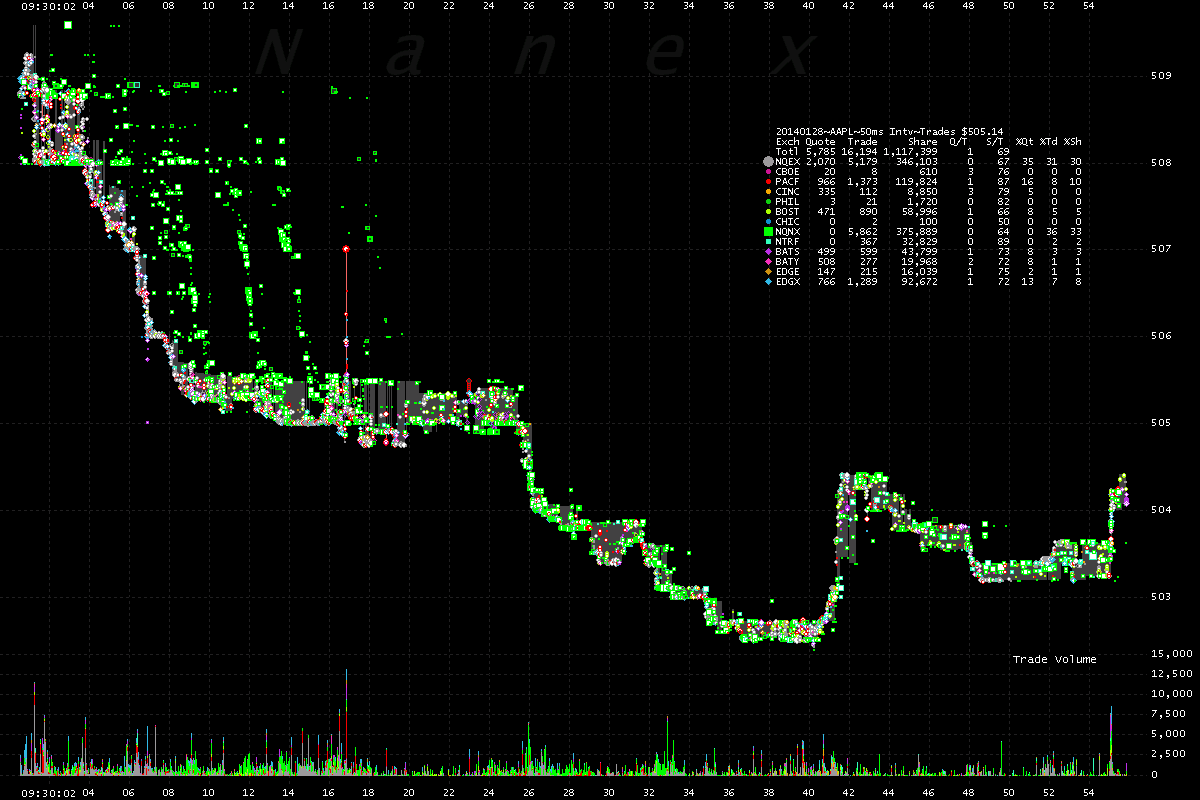
1. AAPL - Trades color coded by reporting exchange between 9:30:00 and 9:30:54.
The green squares are trades reported on Trade Reporting Facilities - these are executions
from Dark Pools and Internalizers (retail).
Note the 4 distinct echo curves - green dots forming a line mimicking the price action
of real-time, but shifted to the right. The amount of shift indicates the magnitude
of the delay in reporting those trades from one particular source. Each curve is delayed about 2 seconds more than the one before it (to the left). Who the sources are for each
echo curve are of course, unknown.

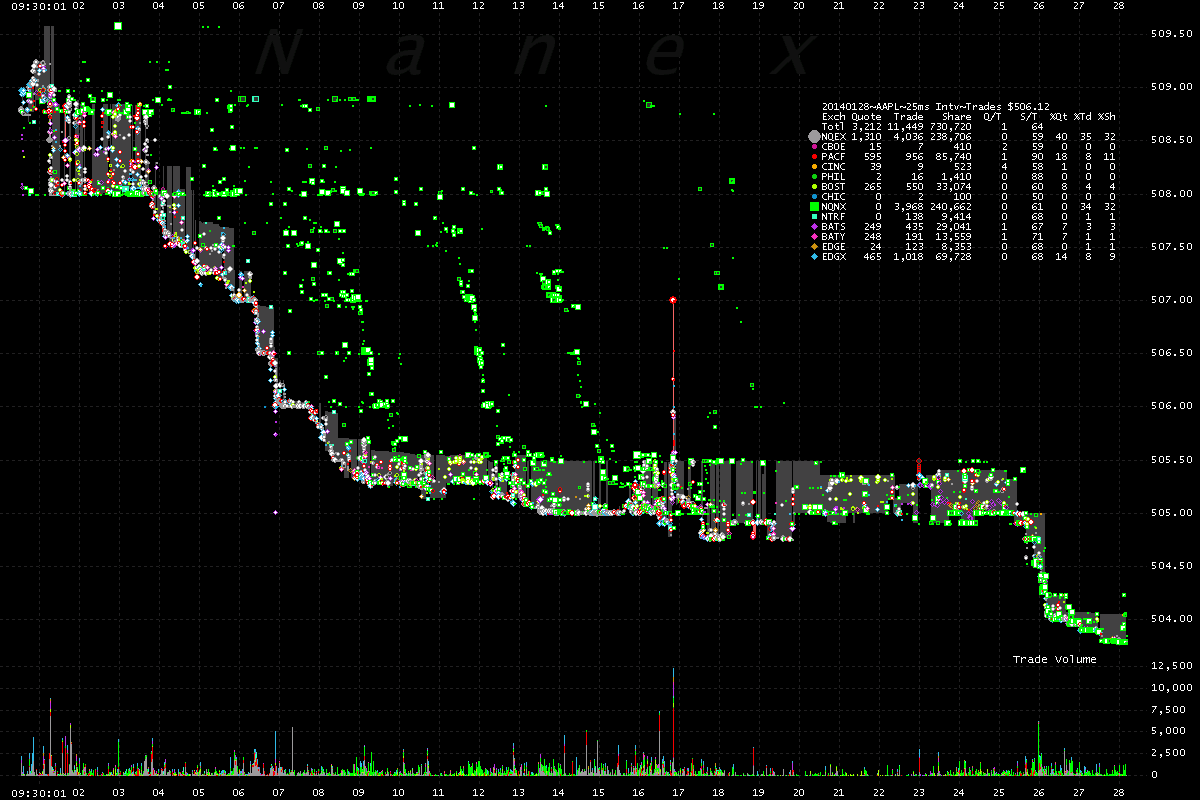
2. AAPL Zooming in to about 30 seconds of time.
The gray shading is the NBBO (National Best Bid/Offer).

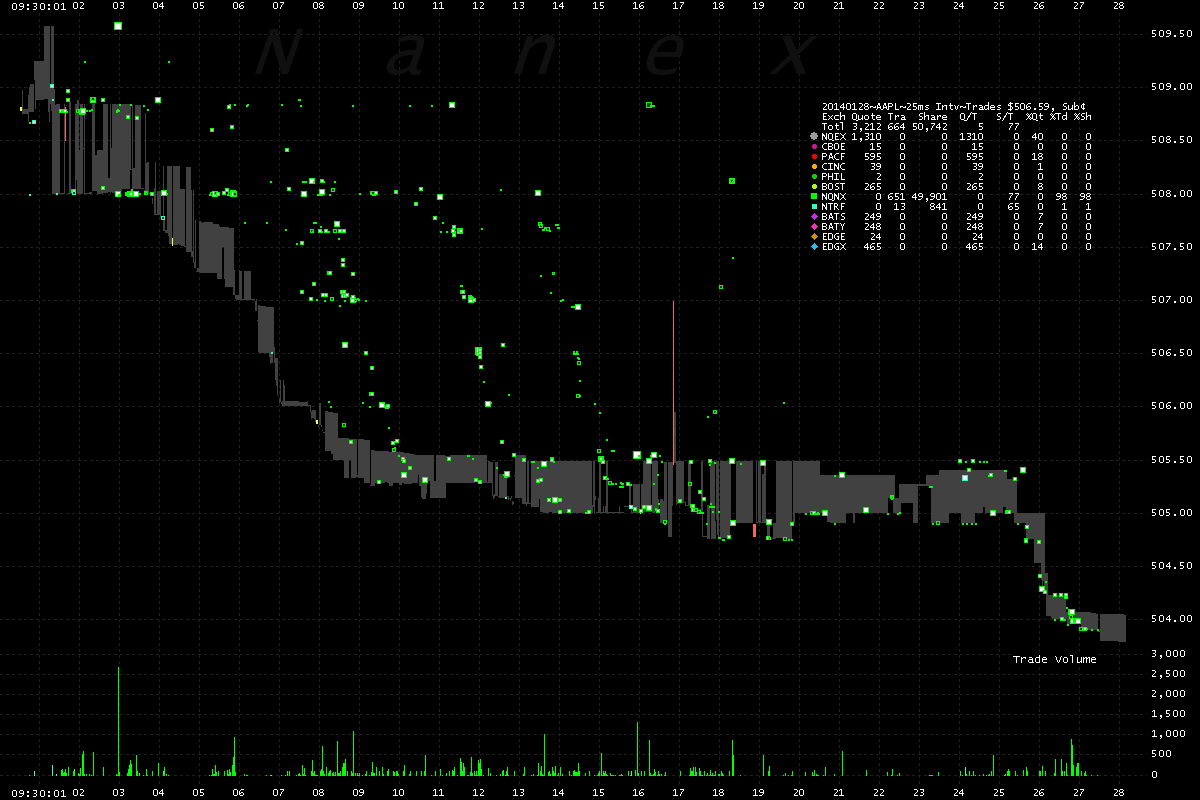
3. AAPL Showing Sub-penny prints - which are "price improvements" on retail
trades.
More about price improvement here.

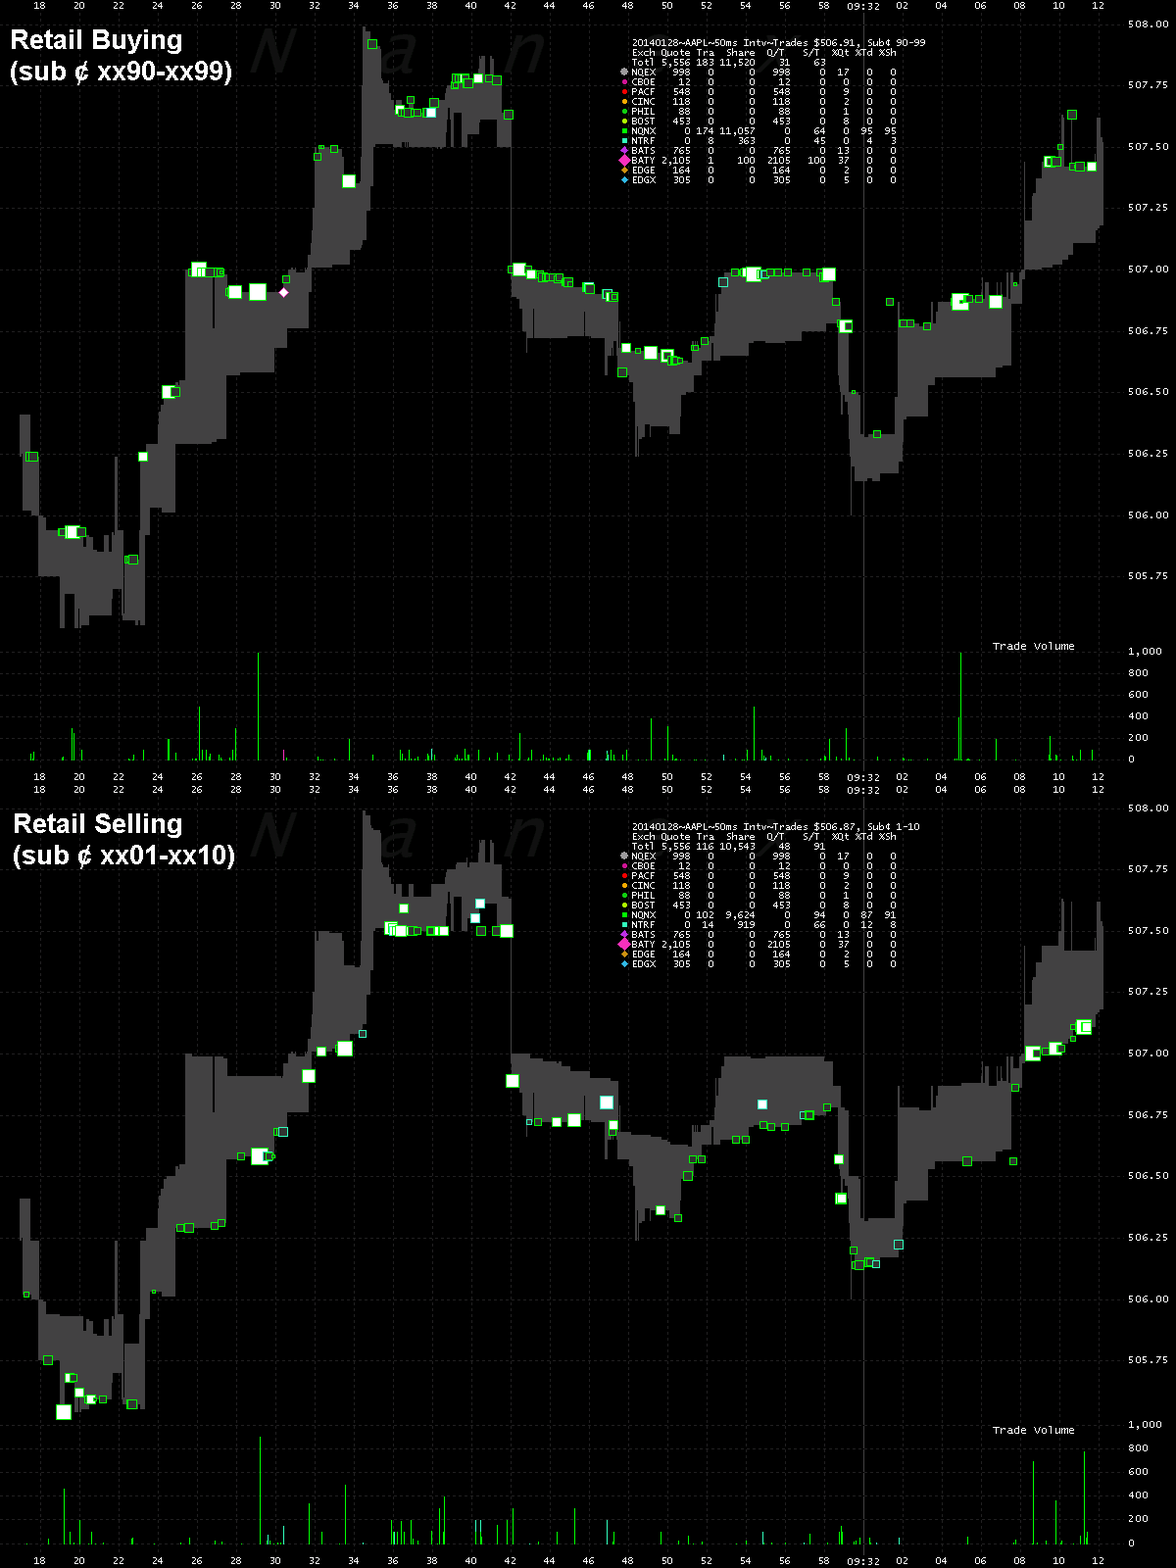
4. AAPL - Image alternates between Retail buying and selling at the market.
Note how retail buy market orders always execute near (but a fraction of a penny below)
the top of the NBBO (top of gray shading) and retail sell market orders always execute
near (but a fraction of a penny above) the bottom of the NBBO. This is where other limit
orders that set the NBBO are getting front run by internalizers. For details on how
this works, read
sub-penny pricing which explains what "retail price improvement" is really
all about.

Nanex Research
Inquiries: pr@nanex.net


