Nanex Research

Nanex ~ 29-Jan-2014 ~ Low Liquidity Warning
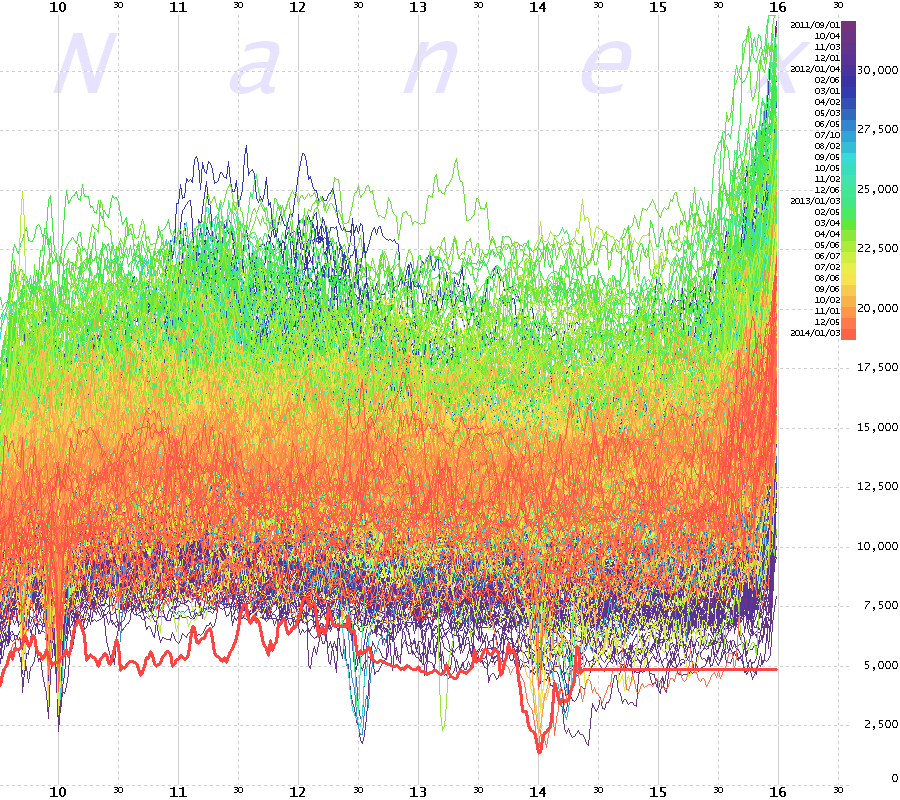
The following chart shows the total number of contracts in all 10 depth of book levels averaged over each minute of the day (9:30 to 16:00 ET) between September 2011 (dark purple) and January 29, 2014 (bright thick red). Older days colored towards the violet end of the spectrum,
while more recent days colored towards the red end. Liquidity has never
recovered to former levels, probably due to increased asymmetry in the trading speed
of participants: for example, faster communication (fiber to microwave) between Chicago
and New York.
See also this page.
1. Liquidity in eMini - September 2011 to January 29, 2014 (14:05)
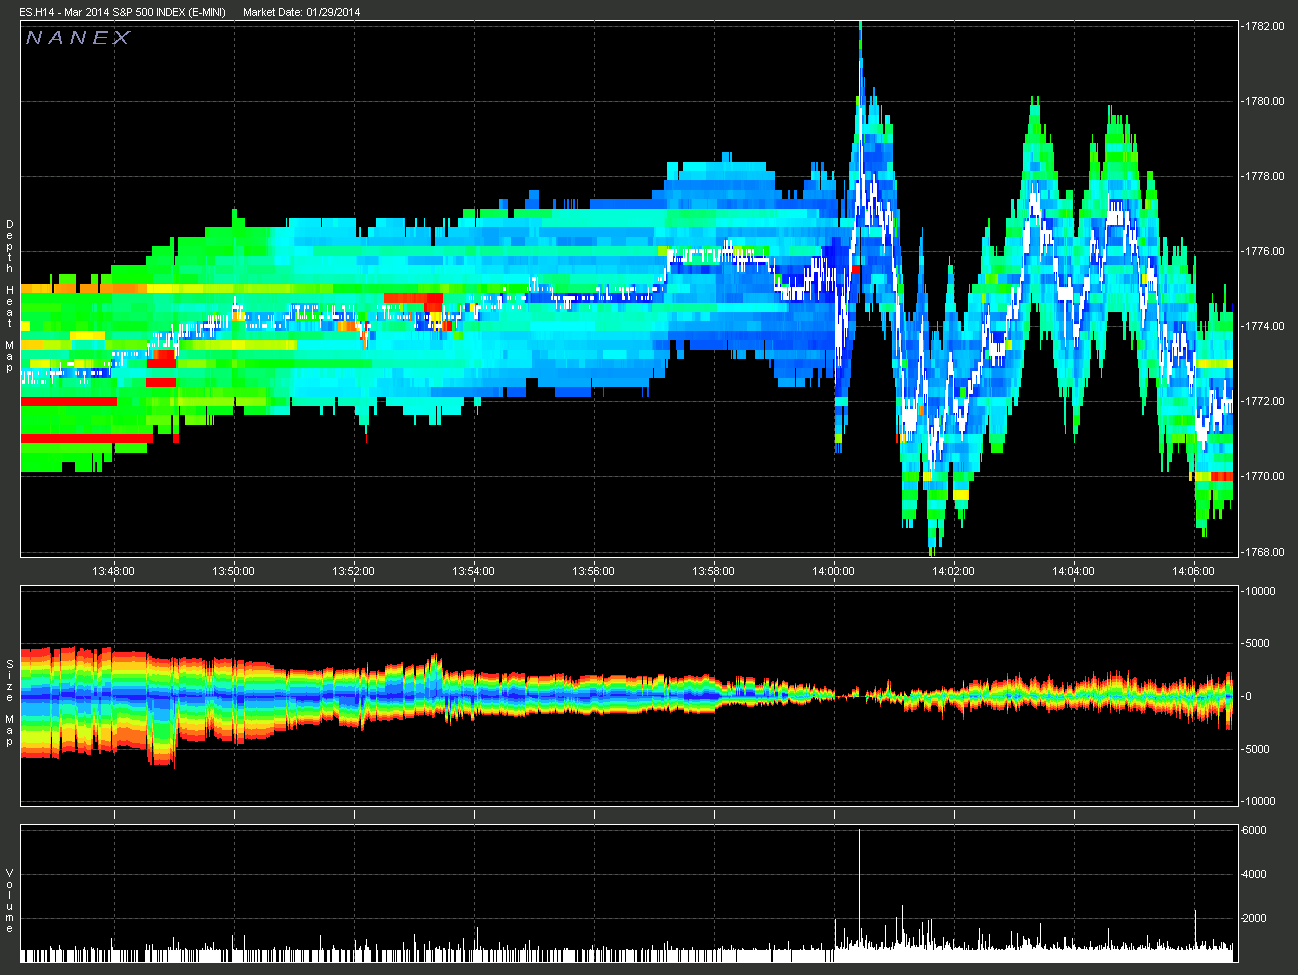
Liquidity at lowest point since August 2011. Heading into a Fed Annoucement at 2pm the
same day.

2. March 2014 eMini (ES) Depth of Book

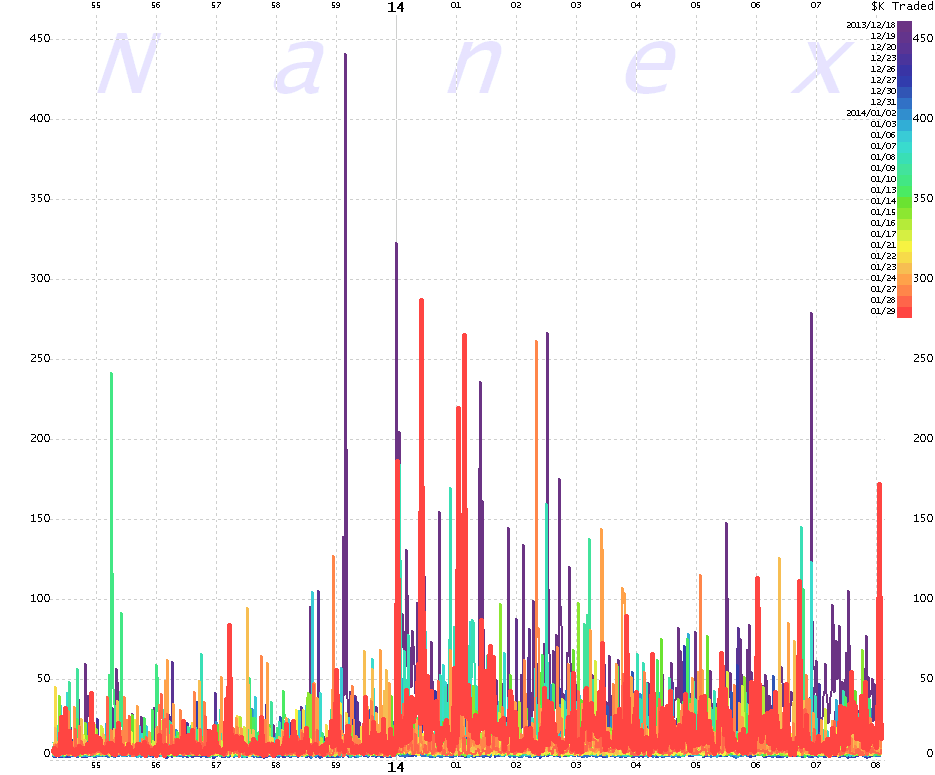
3. Thousands of Dollars Traded per Second - December 18, 2013 (purple) (last FOMC) to January 29, 2014 (red)

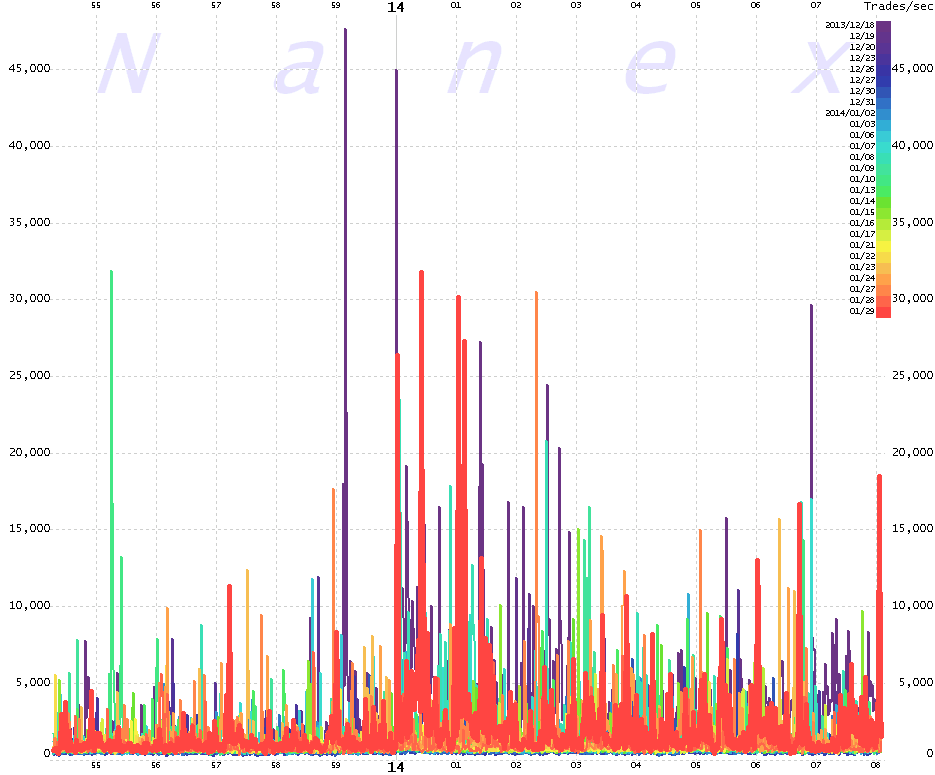
4. Stock Trades per Second - December 18, 2013 (purple) (last FOMC) to January 29, 2014 (red)

Nanex Research
Inquiries: pr@nanex.net


