Nanex Research

Nanex ~ 30-Jan-2014 ~ Chaos at 1/1000th of a Second
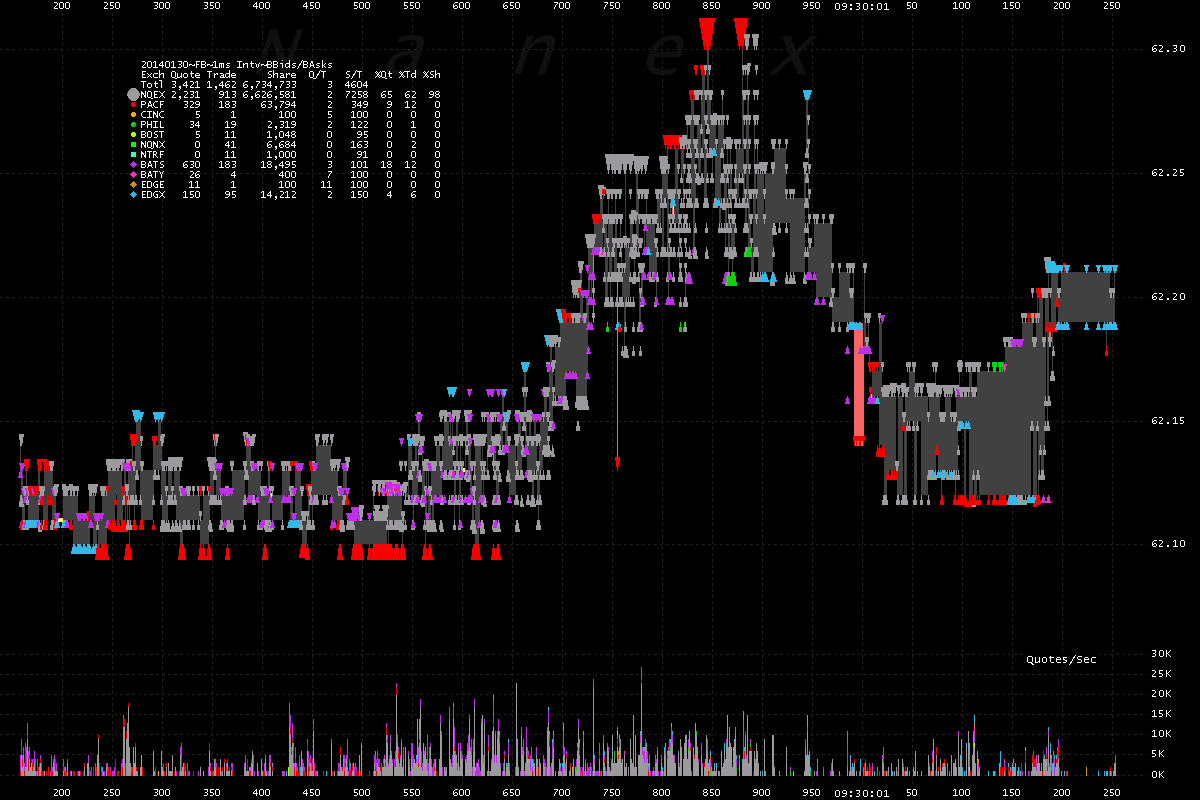
Charts 4 and 5 show a new level of "trading" we haven't encountered before.
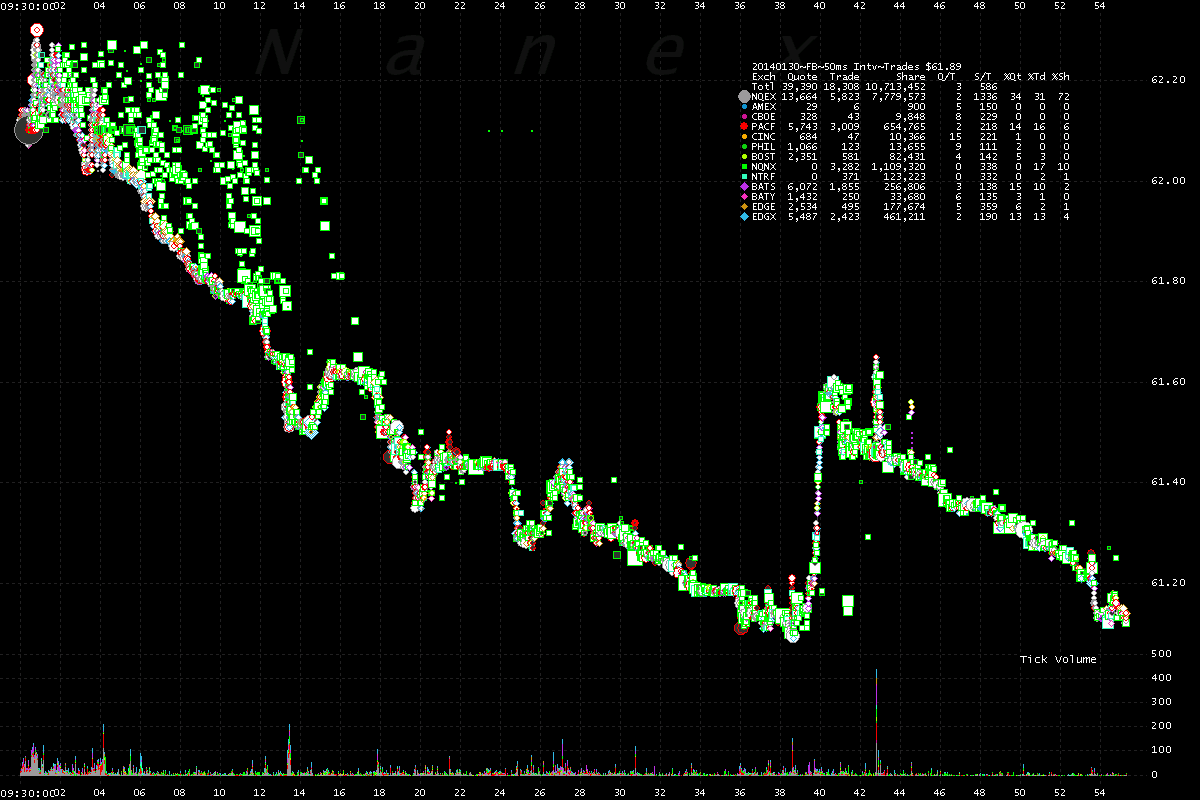
1. FaceBook trades color coded by reporting exchange during the first 54 seconds
of trading on January 30, 2014.
The green squares are from trade reporting facilities. These are retail and dark pool
trades that were obviously reported many, many seconds late.
Apple had a similar pattern just days earlier.
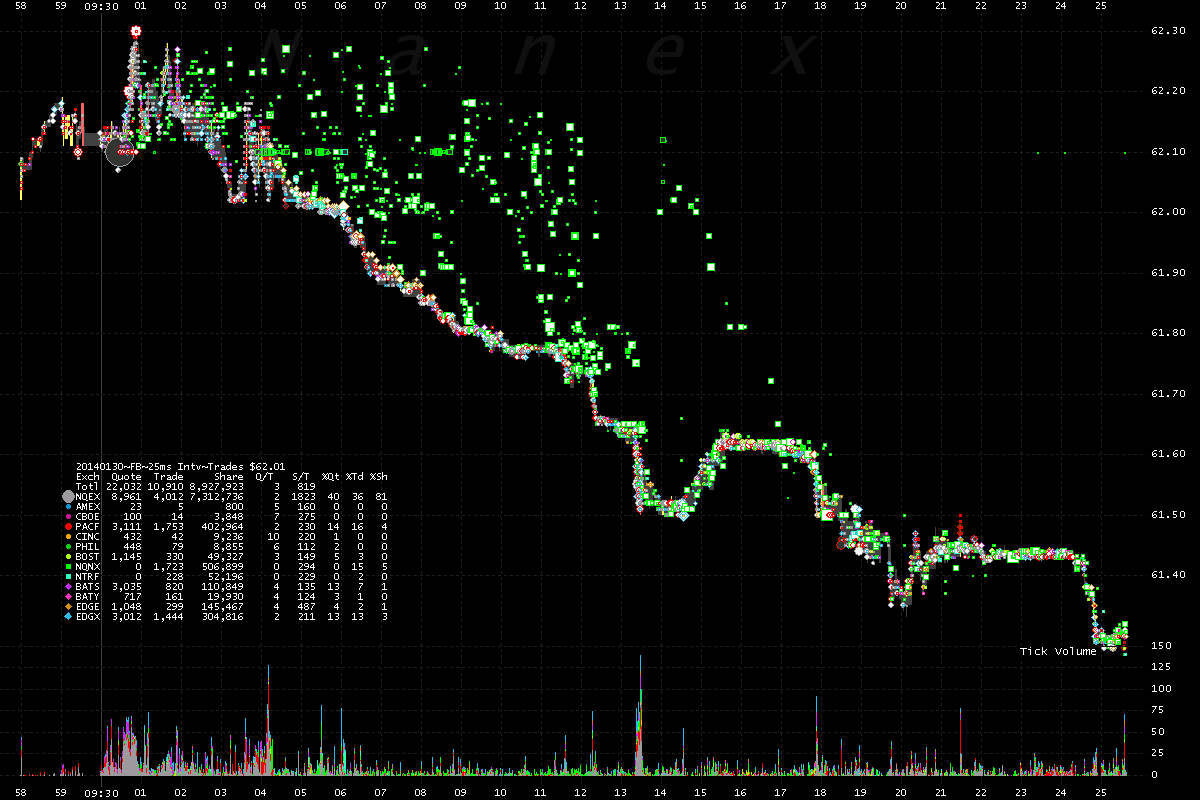
2. Zooming in to 27 seconds of time.
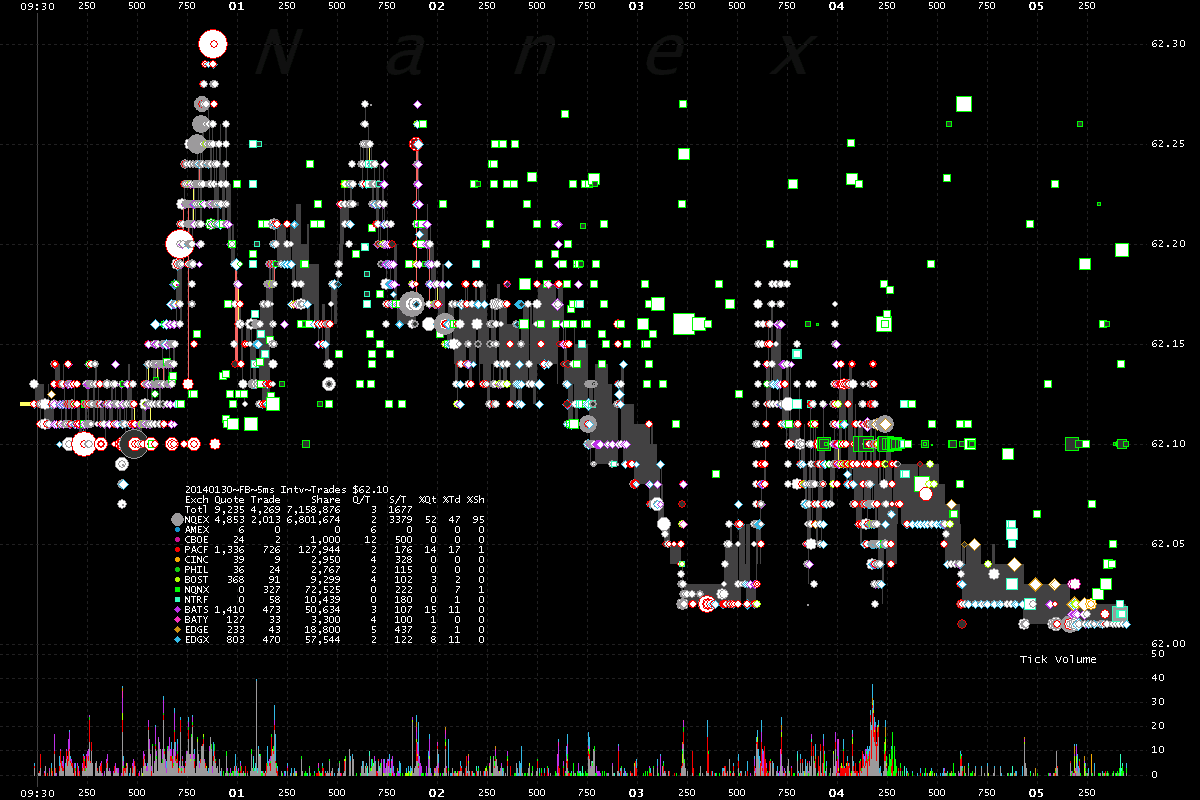
3. Zooming in to 5 seconds of time. Each dot is a trade, color coded by reporting
exchange.
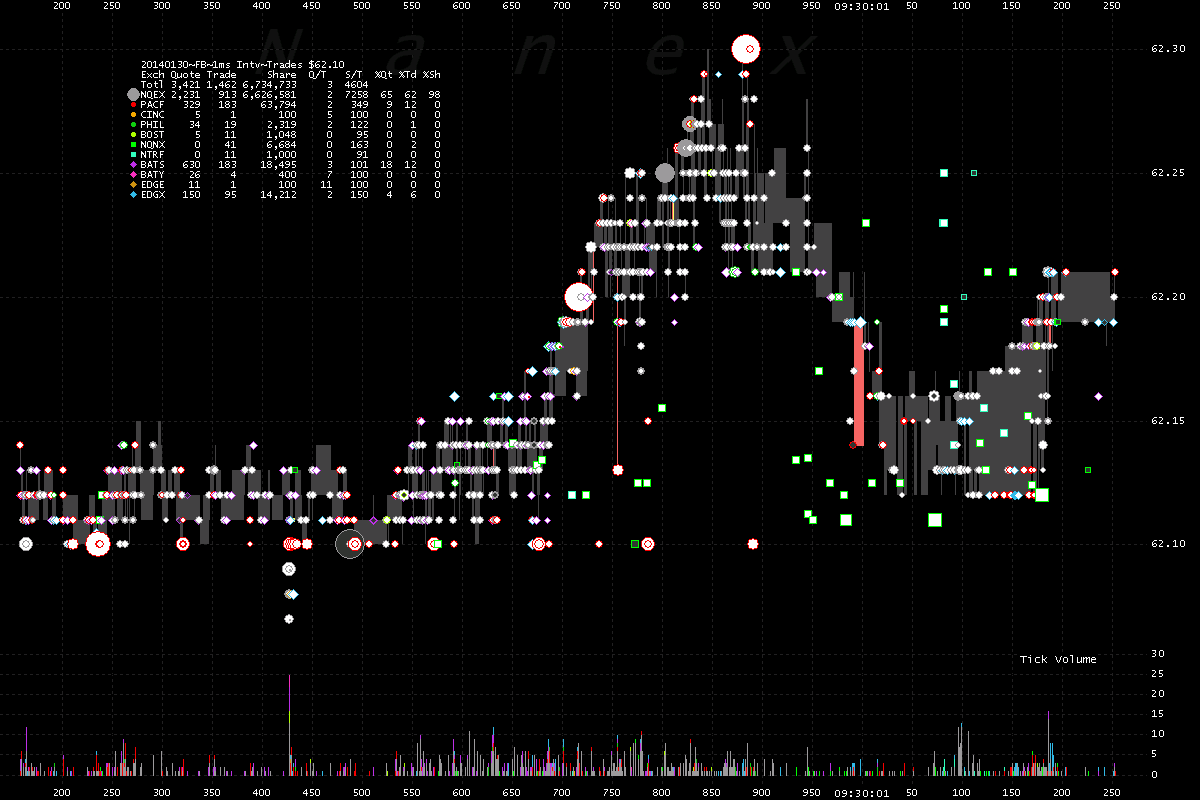
4. Zooming down to 1 second of time we see prices rapidly changing in 1 millisecond or less.
Note: In 1 millisecond (1/1000th of a second), information can only travel
about 186 miles due to basic laws of physics. It takes sound 30 milliseconds to travel
across a trading pit (10 meters, or 33 feet).
The lines of solid dots at several different price levels are all trade executions bouncing
from price to price on multiple exchanges. There are 1,462 trades shown in this one
second of time. For more on how to read this type of chart, watch
this 30 minute tutorial.
5. Same chart as above, but showing the best bids and offers (NBBO).
Not only
does the best bid and offer price change rapidly, but so too does the exchange designated
as having the best bid/offer (what a smart order router needs to know, and quickly).
Keep in mind that it takes about 50 milliseconds for this information to travel to an investor
in California. By the time California sees a new quote, it has already
changed hundreds (maybe thousands) of times again in New York. Here's a video of an animation that nicely illustrates
this concept.
Nanex Research
Inquiries: pr@nanex.net


