Nanex Research

Nanex ~ 30-Jan-2014 ~ HSBC
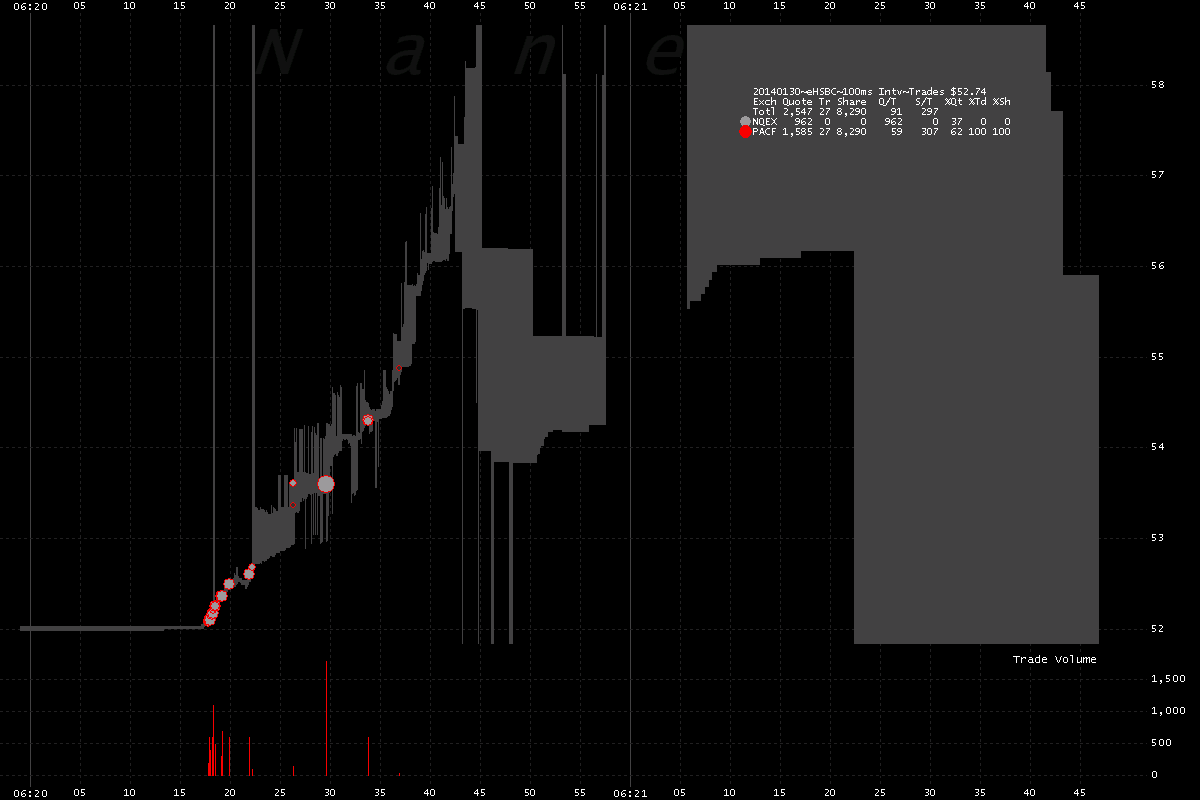
On January 30, 2014, starting at 6:20:17 (11:20:17 GMT) the stock of HSBC Holdings plc
(symbol: HSBC, market cap: $205 billion) rallied sharply from $52.07 to $54.87 in 20
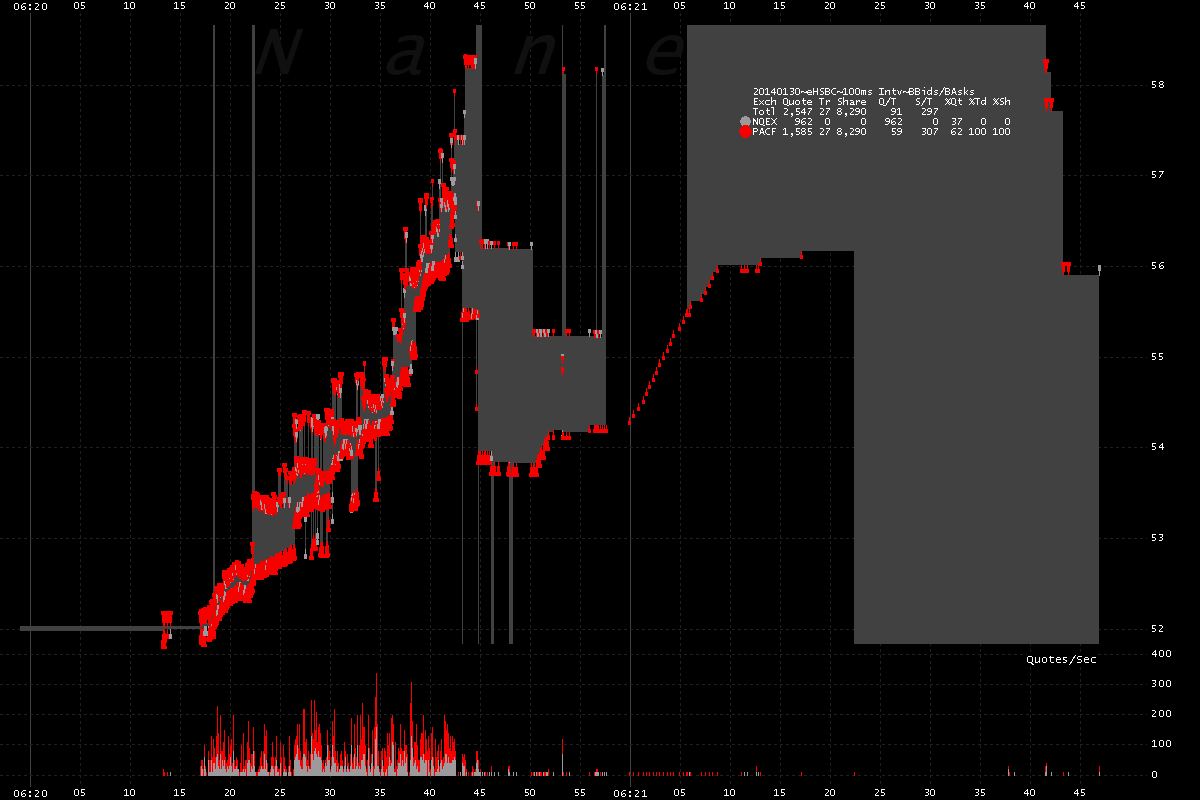
seconds on the NYSE. The National Best Bid reached a high of $56.81 at 6:20:42, which was 25
seconds after the move began. News reports stated that this was a "fat finger" event
on the London Stock Exchange (LSE). Although we haven't looked at data from the LSE,
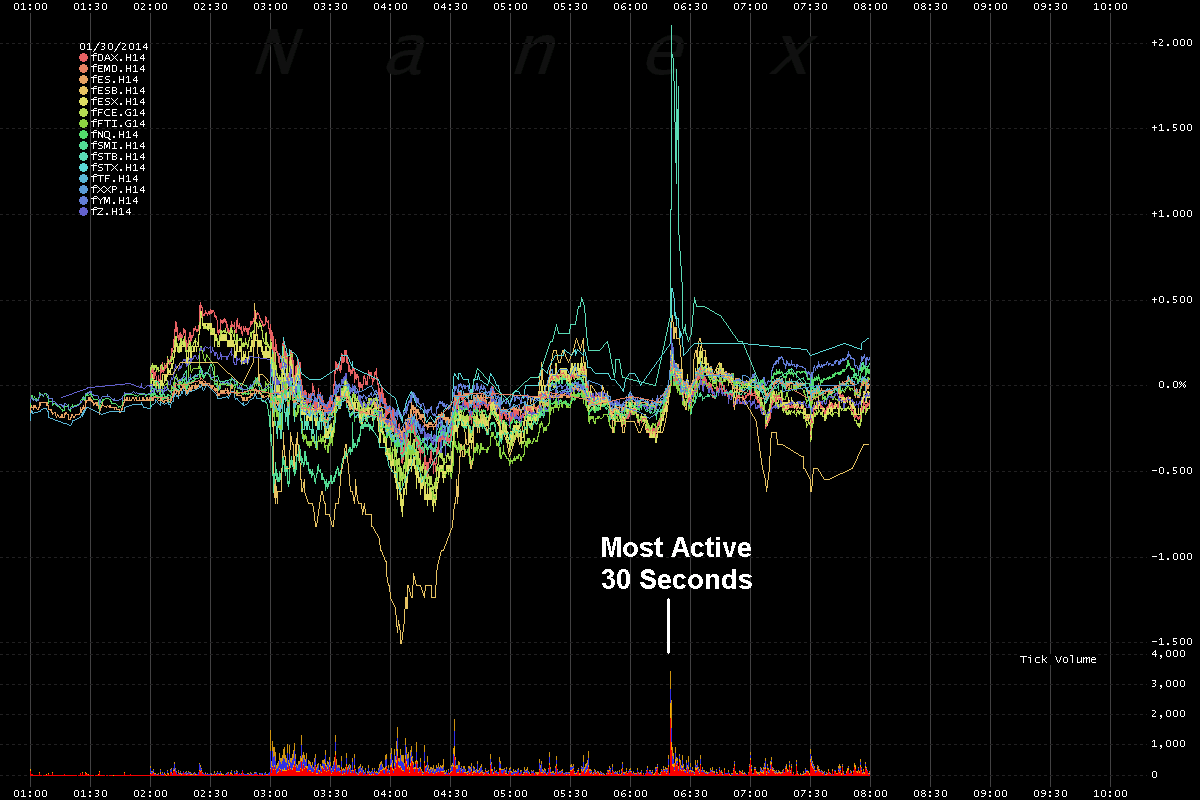
we can be sure that prices on the NYSE tracked those on the LSE due to arbitrage activities. We also note the extreme activity and price moves in several stock index
futures in Europe and the United States.
For this to have been a fat finger, we'd have to believe a trader keyed in an order
that didn't get rejected by the trading software, and then remained oblivious
to a significant run up that unfolded almost immediately in HSBC stock, the FTSE, and
other widely followed stock indexes, for nearly 25 seconds.
Update - February 5, 2014
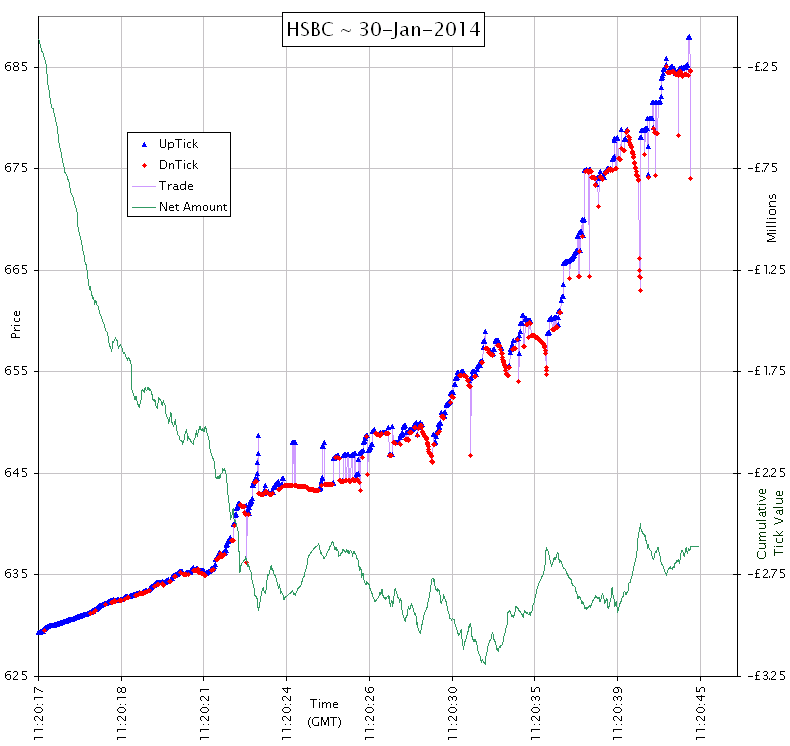
We've obtained the time and sales data for HSBC on the LSE. As suspected from NYSE and
other data, this
event was not the result of a market order or algo that simply bought everything in sight. The price bounced up and down all the way up to when it tripped
a 10% trading halt. The red dots in the
chart below show trades that were likely from sell orders (downticks), and the blue dots show trades likely from buy orders. The green line shows the cumulative amount (in pounds - £) of all
trades shown (scale runs from £0.25 to £3.25
Million).
The total value of shares bought (estimated from up ticks) was £7.5 million, while total
value sold (estimated from down ticks) was £4.9 million.
This action reminds us of
the dramatic move in Treasury futures
on December 23, 2013.
1. HSBC Trades (dots) and NBBO (shade).
Spread goes from pennies to over $20 in seconds.
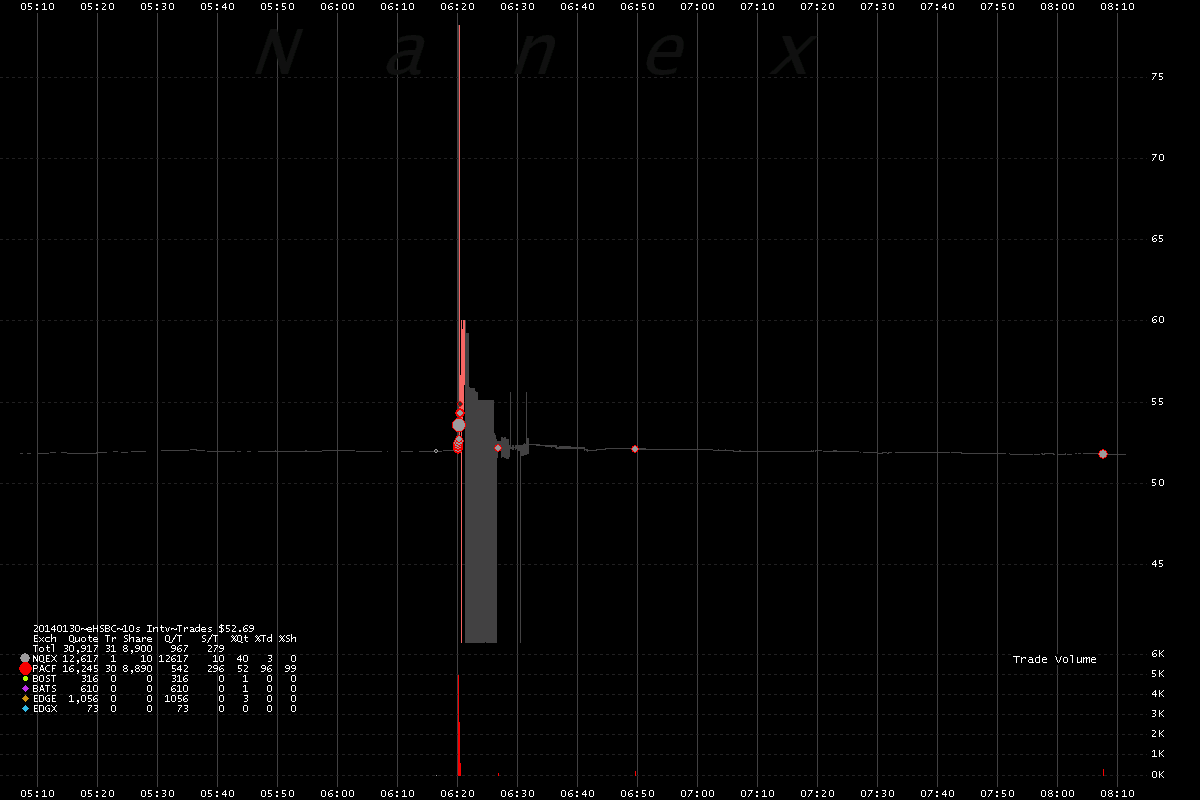
2. HSBC Trades (dots) and NBBO (shade) - Zooming in to 8 minutes of time.
This isn't what a fat finger looks like.
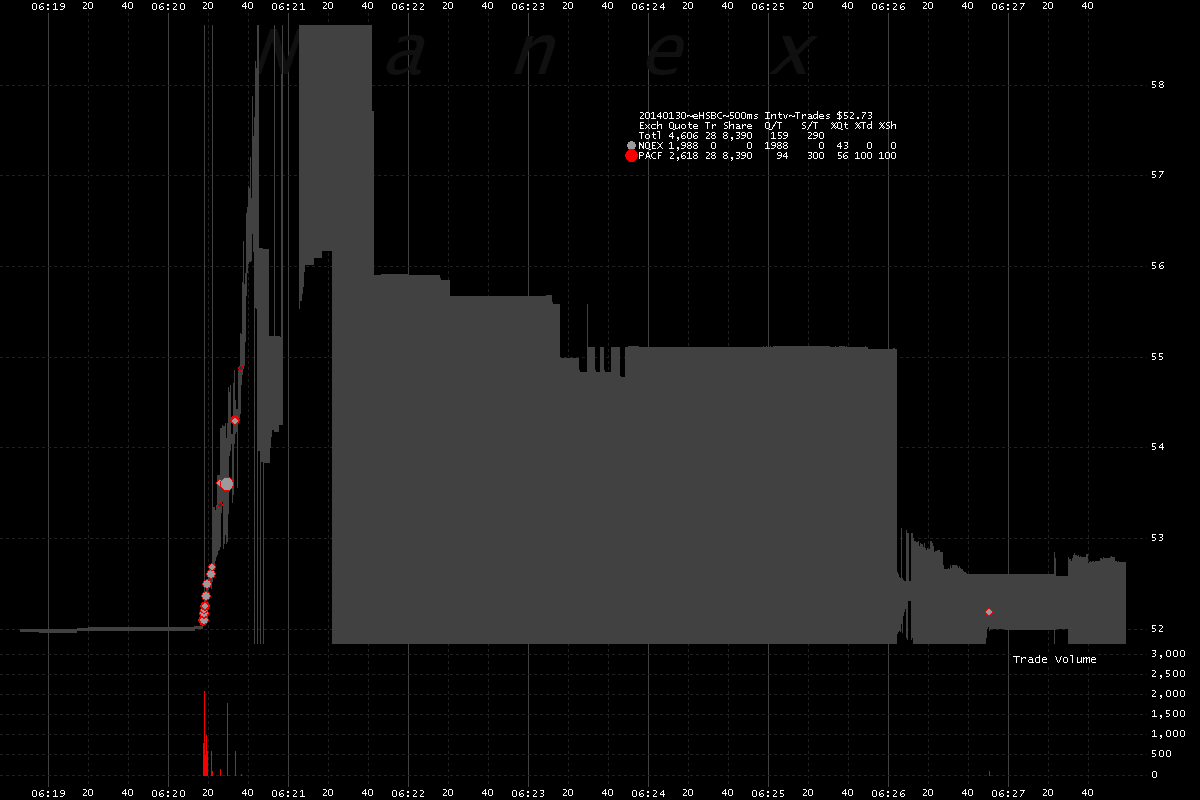
3. HSBC Best Bids and Asks.
You can see when trading "halted" and resumed.
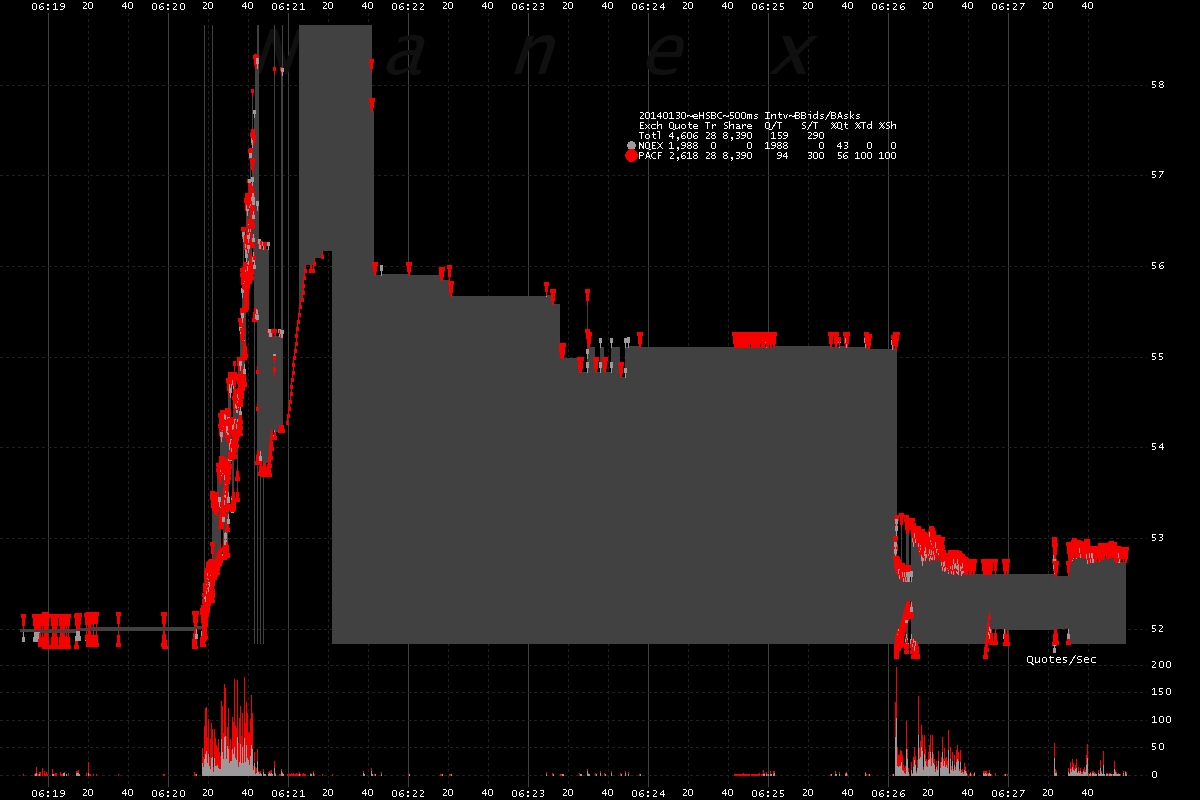
4. HSBC Trades (dots) and NBBO (shade) - Zooming in to about 2 minutes of time.
5. HSBC Best Bids and Asks.
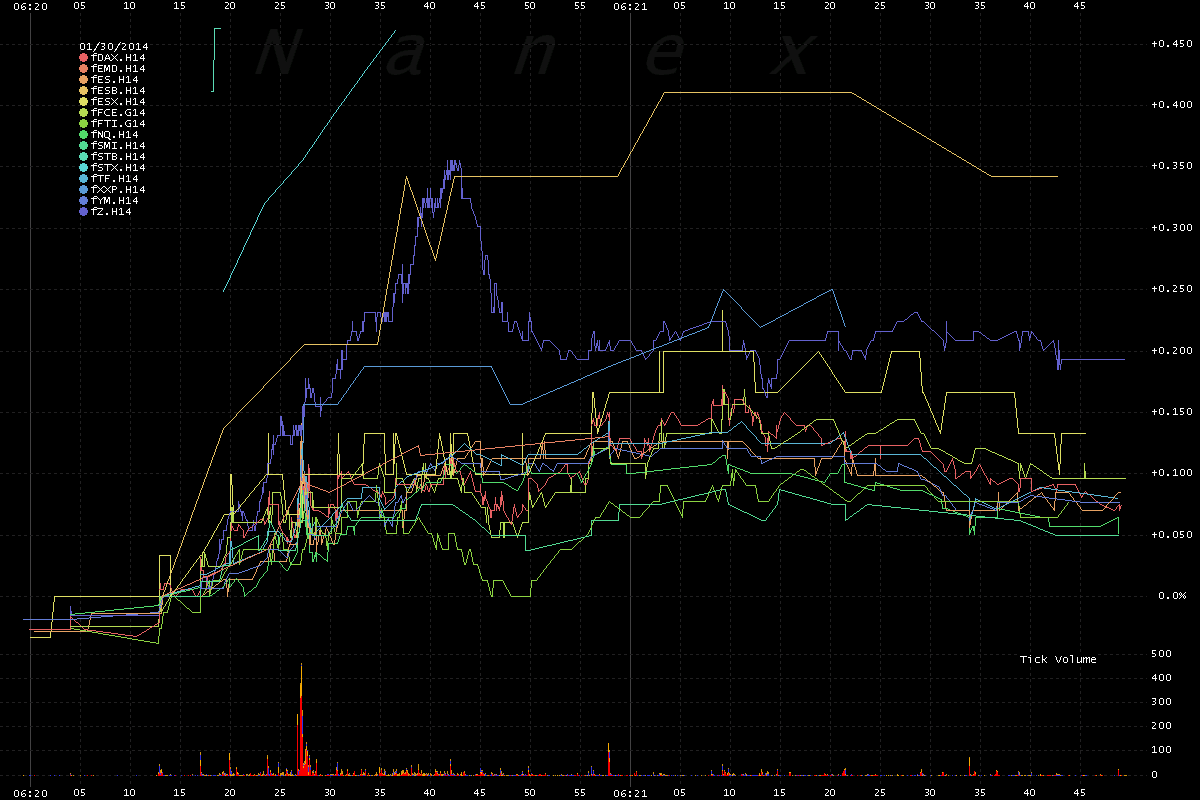
6. The HSBC move triggered high trading activity among many key stock index
futures.
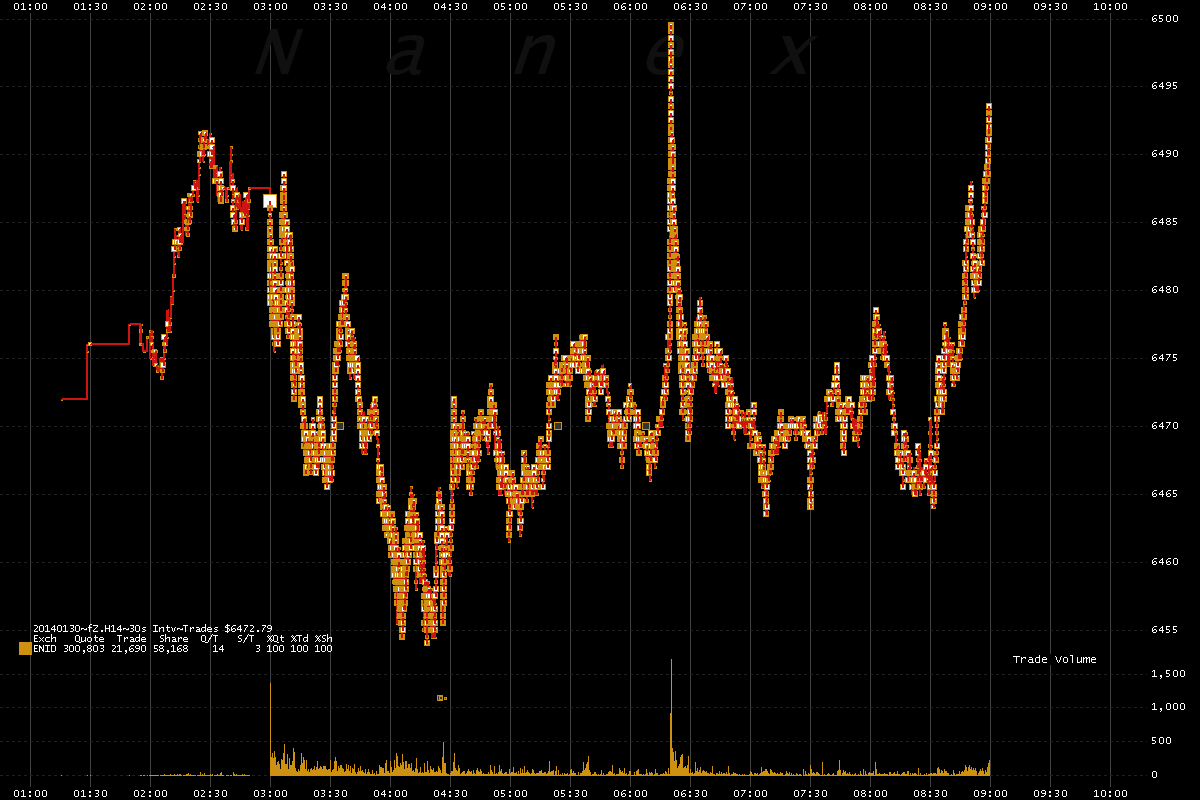
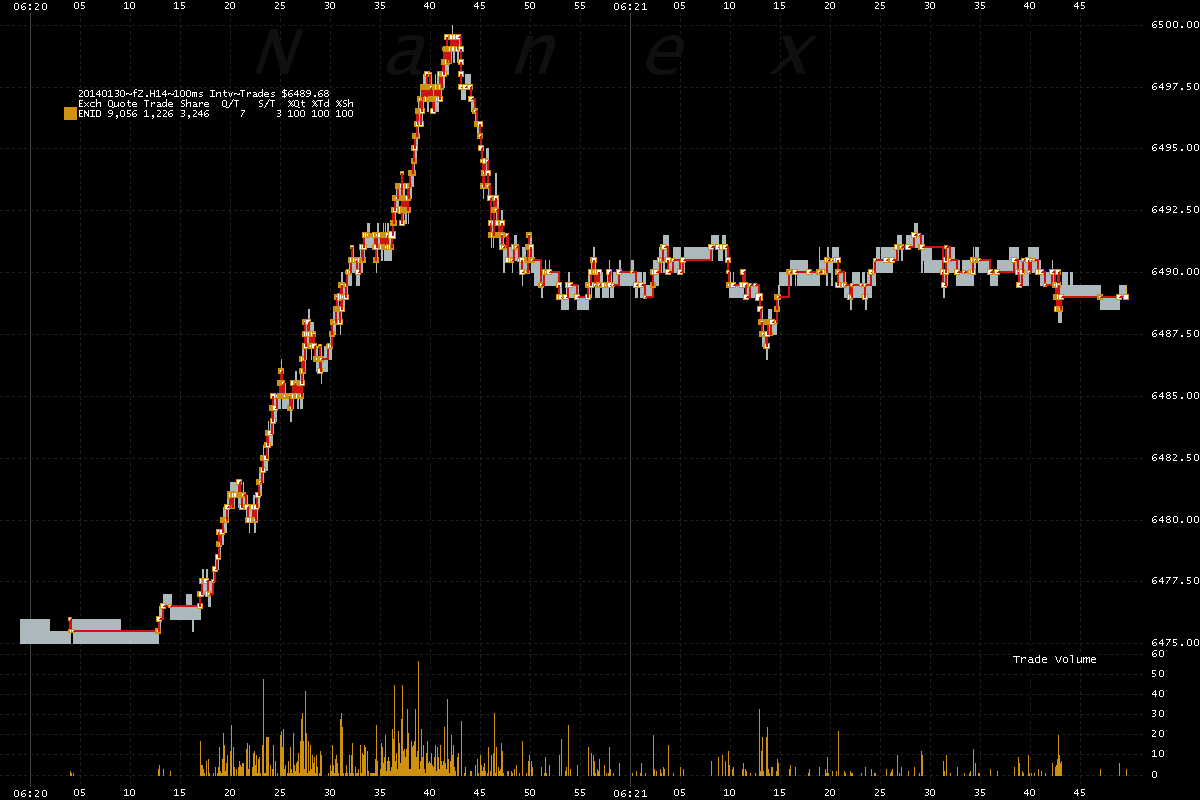
7. The FTSE zoomed higher and fell back almost as quickly.
8. Zooming in on key stock market indexes around the world during the 6:20 AM
(EST) minute.
9. Close up of the FTSE futures.
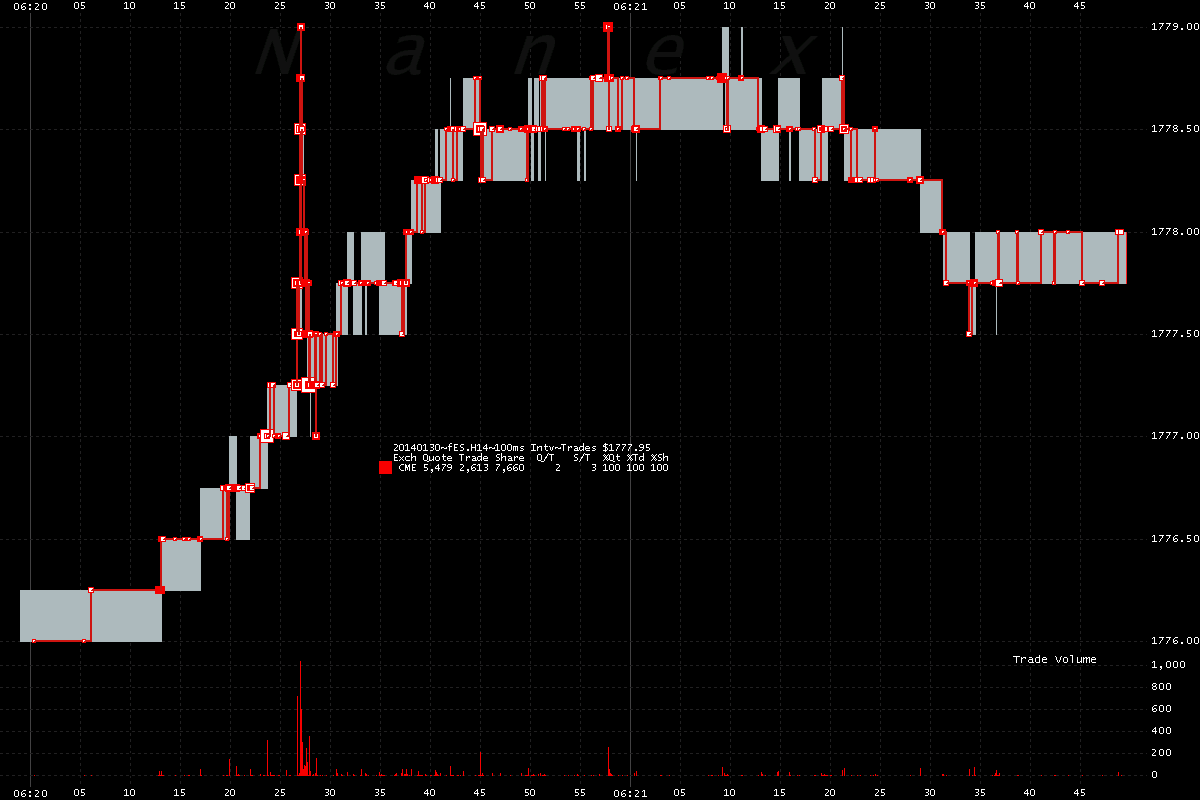
10. The eMini (ES) in Chicago made a sudden jump.
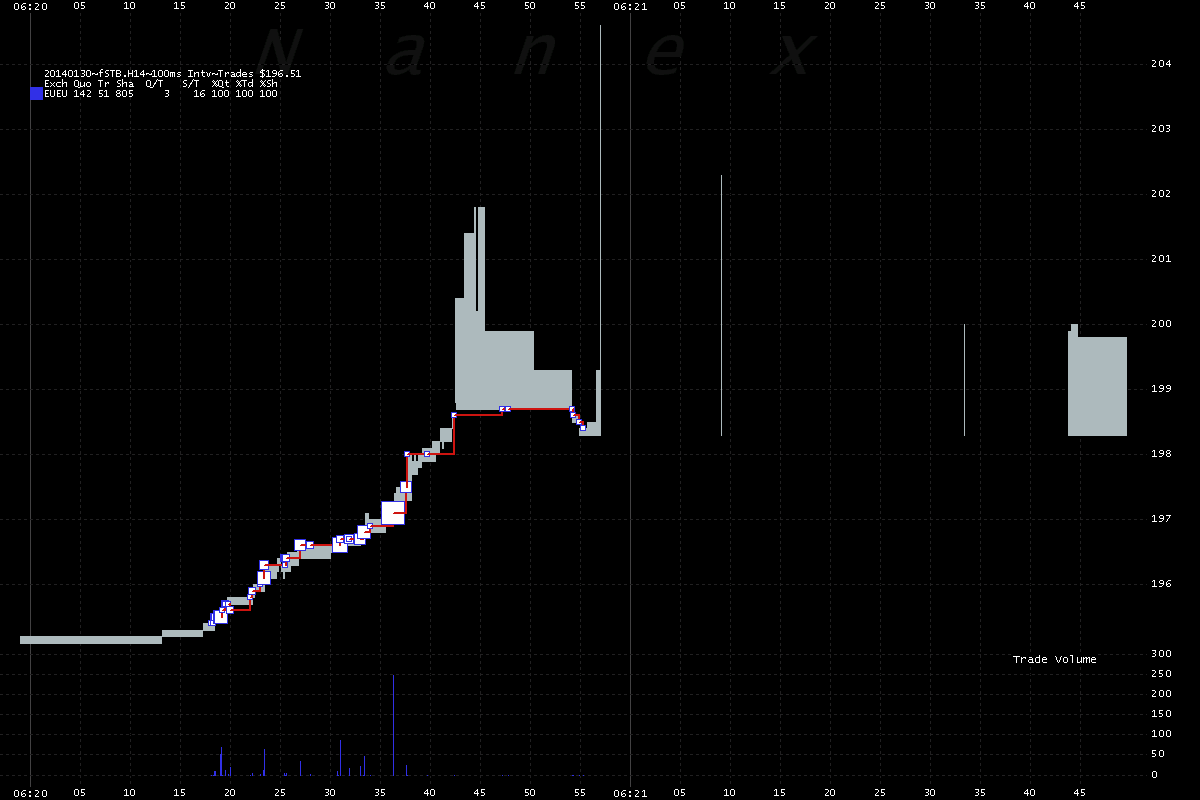
11. Stoxx Europe 600 Banks mirrored HSBC's rapid rally.
Nanex Research
Inquiries: pr@nanex.net


