Nanex Research

Nanex ~ 10-Feb-2014 ~ The New Normal
Lipstick on a Pig - Lowering the bar does not improve
the market
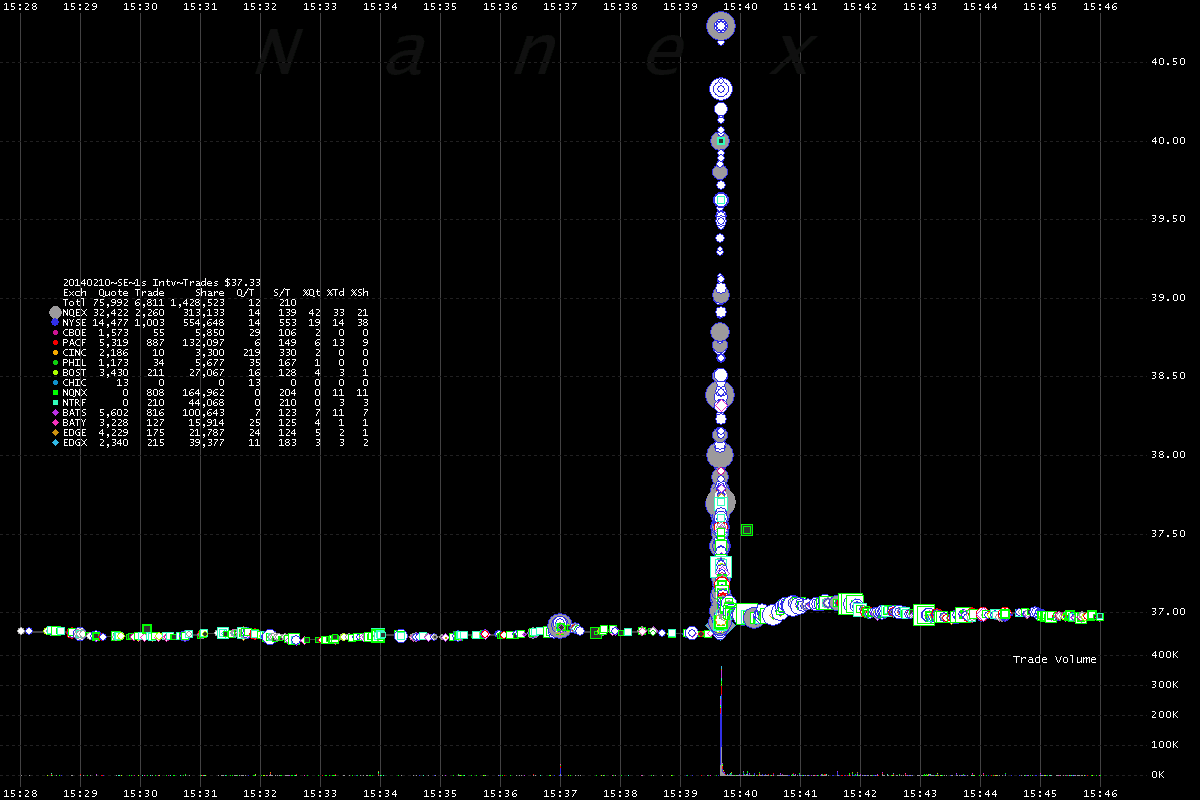
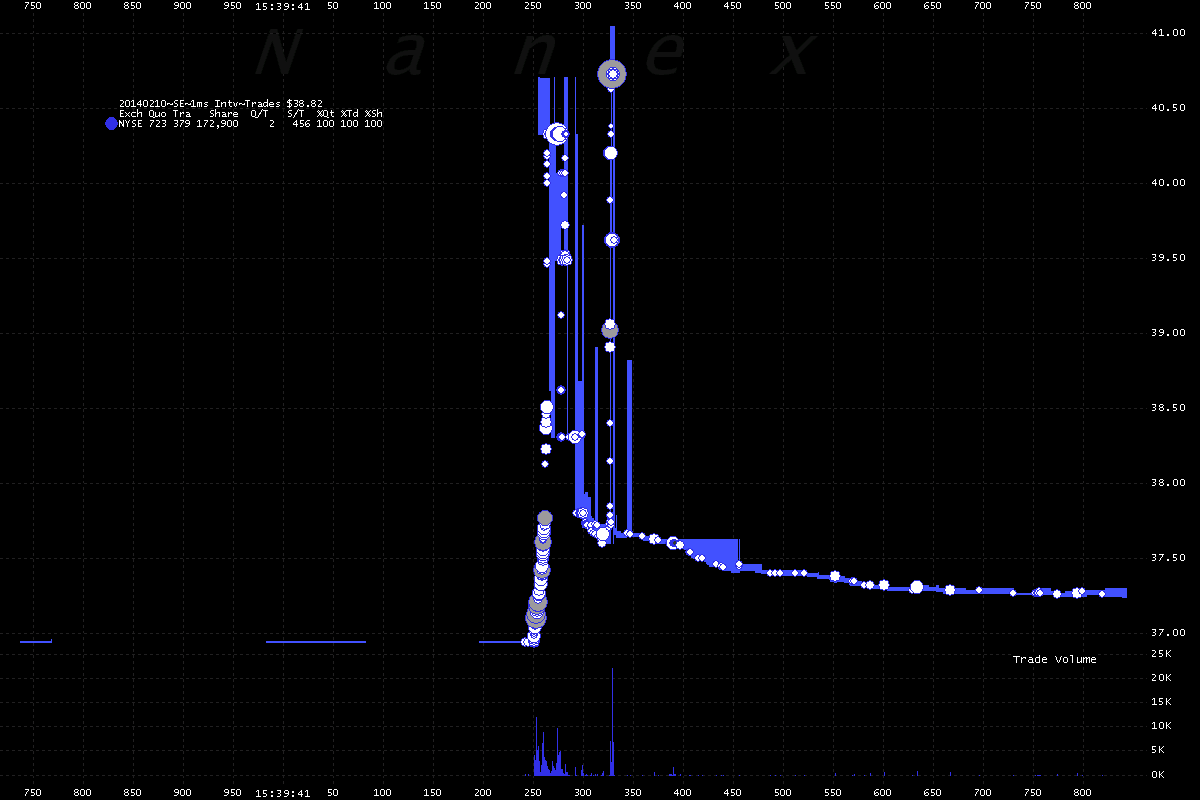
On February 10, 2014, at 15:39:40, the stock of Spectra Energy Corp. (symbol: SE, market cap: $25 to $27.5 billion depending on what millisecond you look at) rocketed from $36.87 to $40.73 (10.4%) and back in seconds. Close inspection shows multiple peaks and a clear
gravitation
towards the upper band of Limit Up/Limit Down (LULD) - the new stock market circuit breakers
designed to prevent another flash crash (except
it was never tested on actual flash crash data). Step through the charts as
we zoom down to increasingly higher resolutions. The price action is shocking.
People who say there are now fewer individual stock flash crashes (such as this one),
base that claim on a lower number of instances where trades are busted because of clearly
erroneous executions (CEE). But CEE's are only on the decline, because LULD essentially
transforms most of them into acceptable trading. Practically speaking,
LULD normalizes deviant behavior by lowering the bar for what is acceptable.
Lower the bar far enough, and every student will get an "A". However, if we use the
same criteria over time,
the number of mini flash crashes is actually on the rise.
This aberrant move in price, classified the stock as a barbarian at the gate,
according to
this article on The Street.com. This
misclassification is but one of the many
side effects from these High Frequency Trading (HFT) induced events.
1. SE - Trades color coded by exchange and NBBO. Chart shows about 20 minutes
of time.
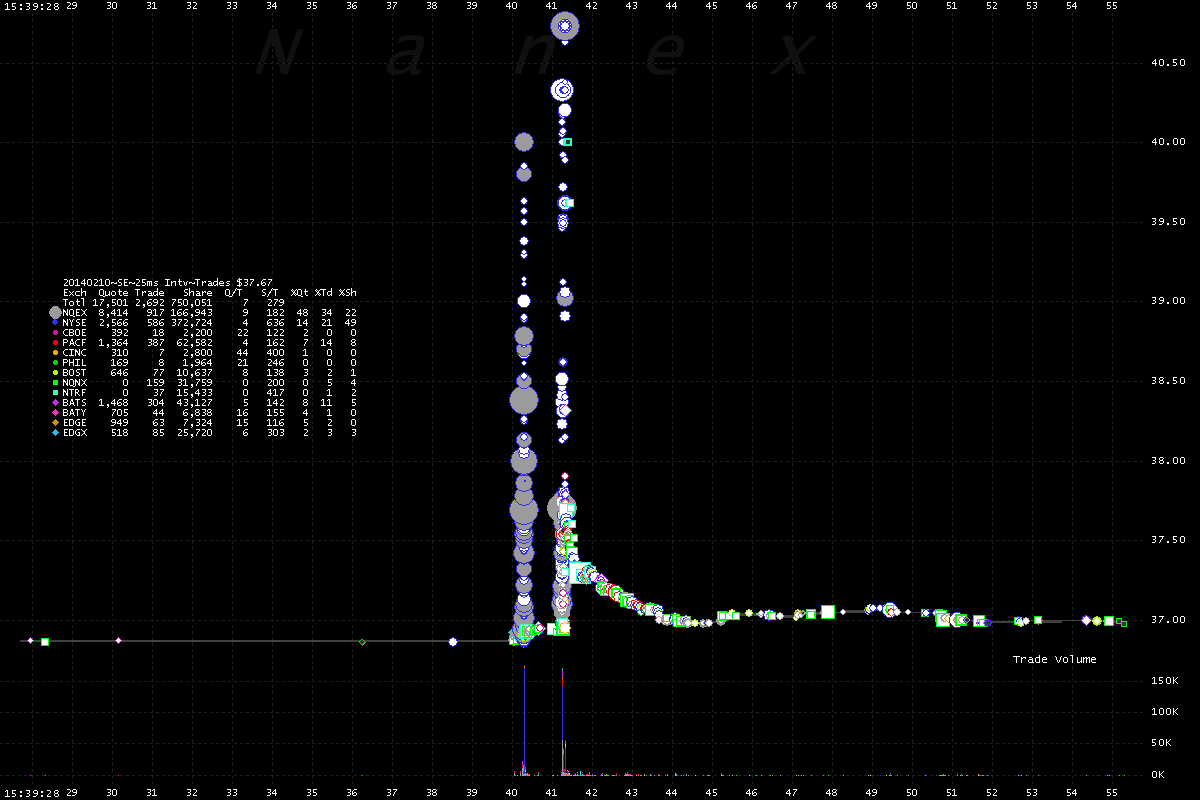
2. Zooming down to about 30 seconds of time.
There is more than 1 peak!
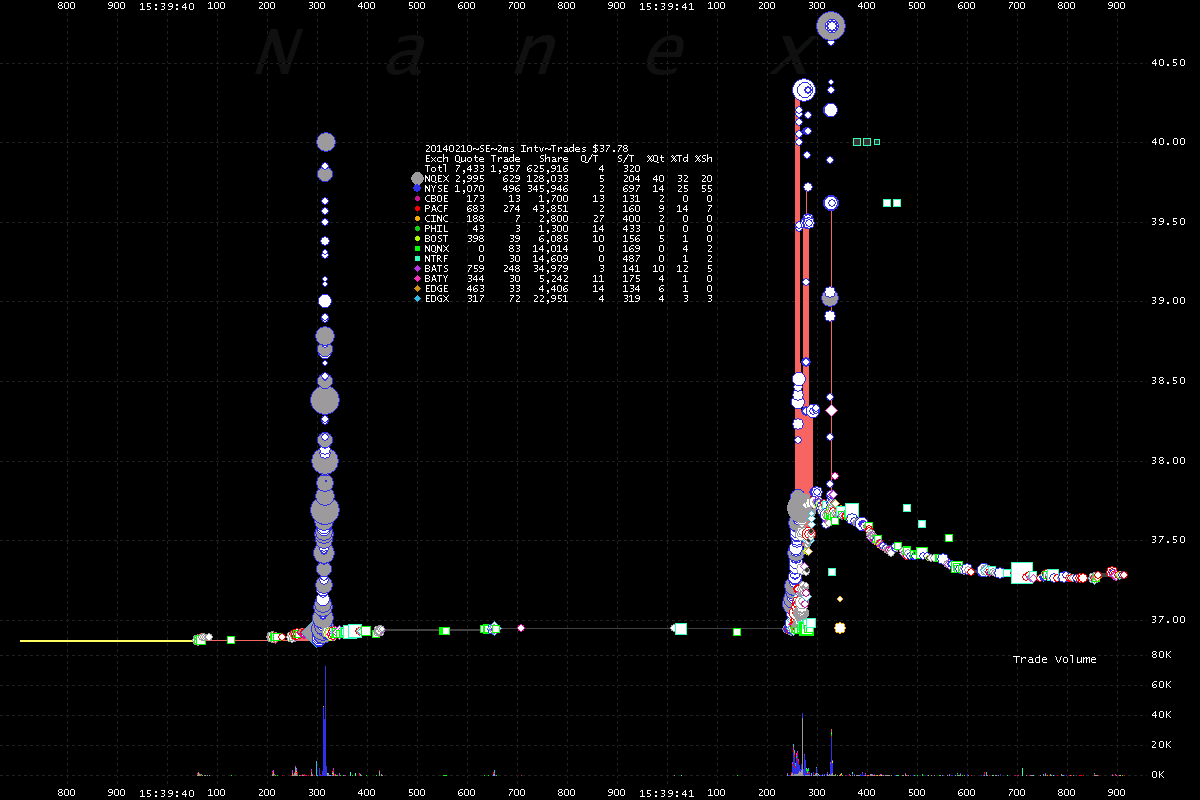
3. Zooming down to 2 seconds of time.
The peak on the right is actually multiple peaks!
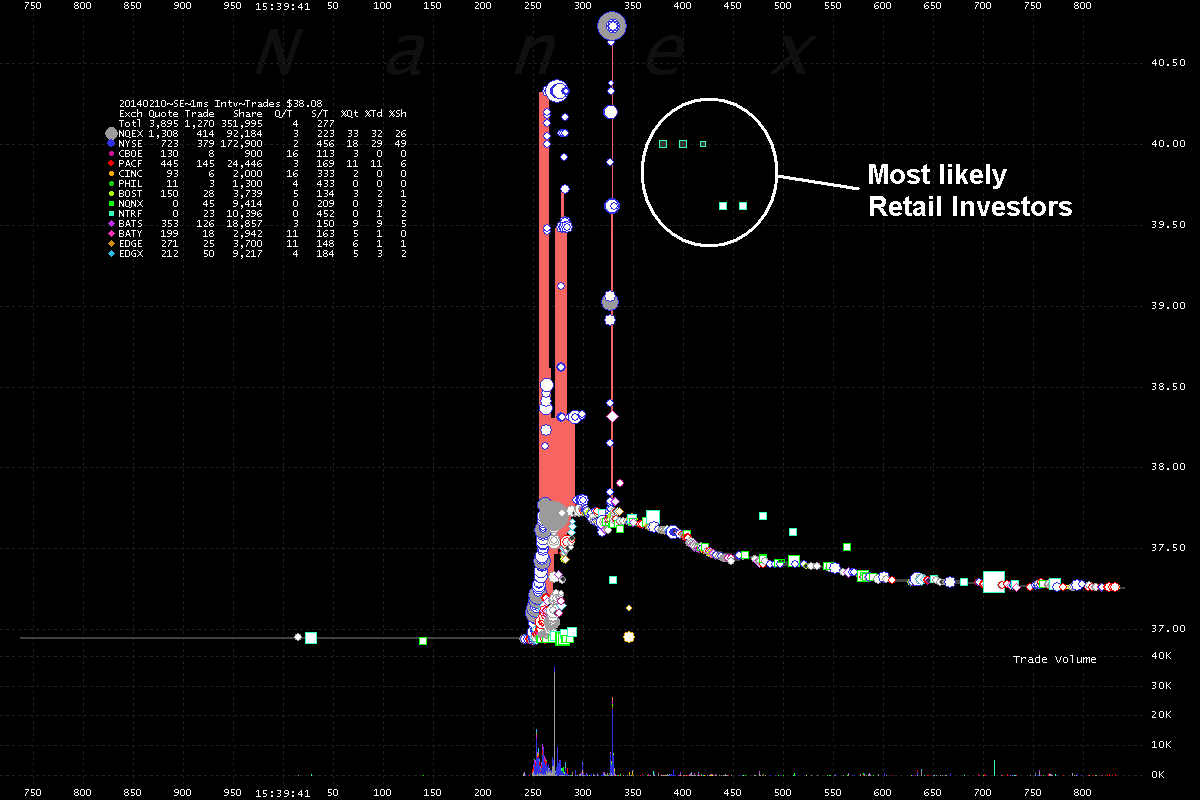
4. Zooming down to 1 second of time.
The green dots are from internalizers or Dark Pools. Most likely from Retail
Investors who won't know what happened for seconds.
5. Same time frame as above, but only showing NYSE trades (circles) and quote
spread (shading).
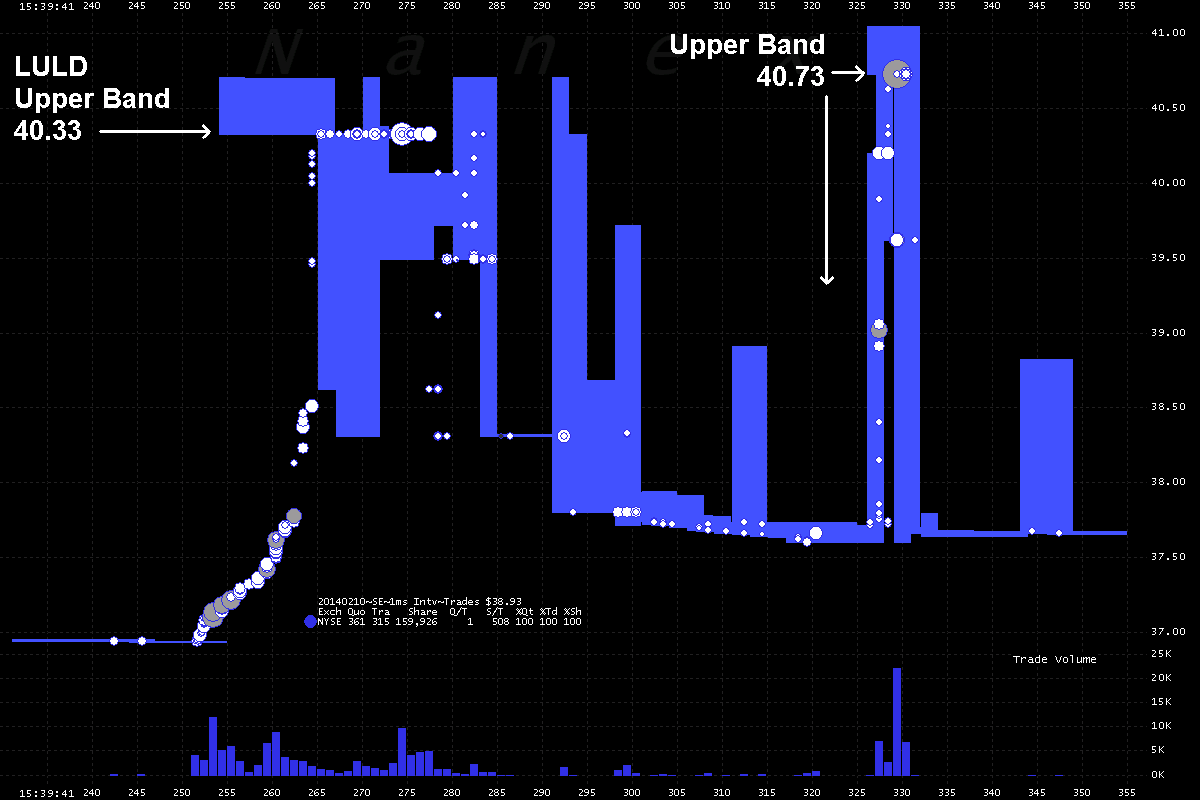
6. Zooming down to 125 milliseconds of time (entire width of chart shows just
1/8th of a second).
The upper band of Limit Up/Limit Down was 40.33 - which is exactly where prices went,
then fell back and forth several times. Almost immediately, when the upper band updated
to 40.73, prices rocketed to exactly 40.73. Note how NYSE trades and quote spread (bottom of shading
is bid, top of shading is ask) oscillates wildly at very short time frames.
7. Video of NYSE Trades. Width of screen is 1 second.
Nanex Research
Inquiries: pr@nanex.net


