Nanex Research

Nanex ~ 26-Jan-2014 ~ Locking the Market

Update: 17-Mar-2014

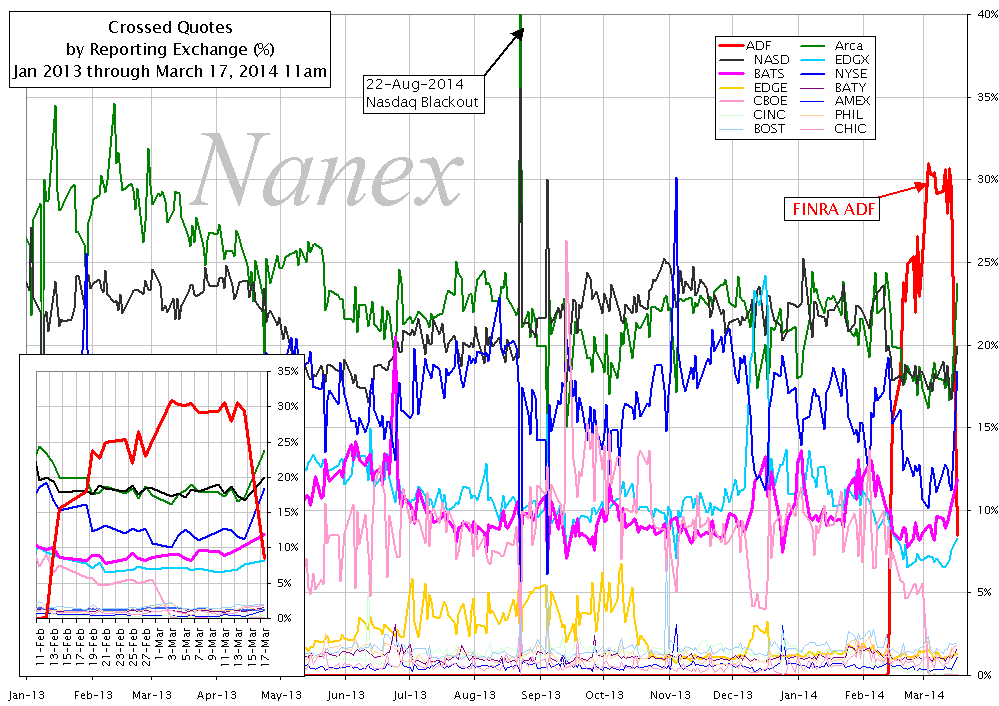
A noticeable drop in crossed/locked quotes from FINRA's ADF started March 17, 2014 -- see 1st chart below.

Update: 06-Mar-2014

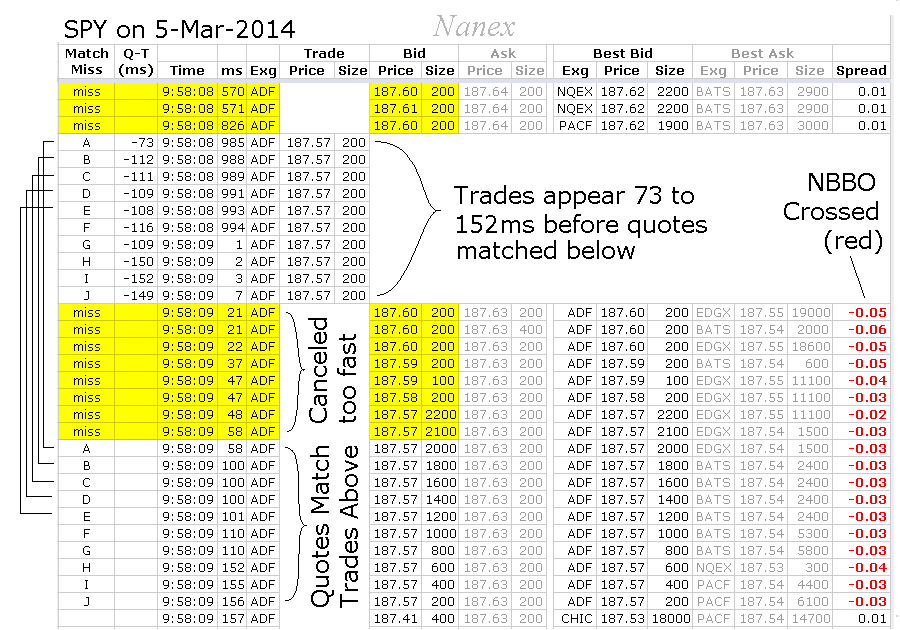
Added example (see below) showing crossed quotes in SPY.


Quotes from the FINRA ADF started on February 11, 2014, have been responsible for locking and crossing the NBBO (National Best Bid Offer) over 30% of the time (thick red line below). Quotes that are crossed (bid is greater than ask) or locked (bid equals ask) are not supposed to happen according to regulations. There are many undesirable side-effects when quote cross - for example, retail trading is temporarily halted.  Why is FINRA, a regulator no less, in the quote publishing business? And why are they so bad at it? Can a regulator fine itself?

It's not like they don't have rules prohibiting locked/crossed quotes:

Note the drop on March 17, 2014.


The 4 images on the right show just one example (out of hundreds of thousands) of FINRA's ADF causing a crossed NBBO. In this example, taken on March 5, 2014, the NBBO is crossed in a major symbol - SPY.

Image 1.
ADF Trades (blob) of circles and Bids (triangles). Note the trades match up to bids that don't appear until later. Also, these trade executions print before many higher prices bids are placed and canceled. Trades appearing before quotes is a sign of other people getting quotes before the consolidated, an illegal phenomenon we call fantaseconds .

Image 2.
All trades (color coded by reporting exchange) and NBBO which is shaded, red or gray (more on that in image 3). Note the many trades that execute at higher prices on other exchanges than the trades reported from FINRA ADF.

Image 3.
Best Bid and Offer Exchanges and NBBO spread which is shaded gray when normal, and red when crossed (bid price greater than ask price). Here, the NBBO is crossed because the bid price at ADF (light green) is greater than ask prices at multiple other exchanges.

Image 4.
Isolates the trades and quote spread from two exchanges: ADF (green) and BATS (pink). Note the BATS trades at higher prices than ADF's trades. Also note the green shading appears shifted to the right of the pink shading: an indication that ADF quotes are delayed.


The image below is from a Google spreadsheet of FINRA ADF trades and quotes in the charts shown on the right.

There are 10 trades labeled A-J which match quotes which don't appear until 73 to 152 milliseconds later. During this period, there were many other trade executions on other exchanges (as we saw in the charts on the right).


Nanex Research

Inquiries: pr@nanex.net