Nanex Research

Nanex ~ 21-Mar-2014 ~ 1/10 of a Second in QQQ
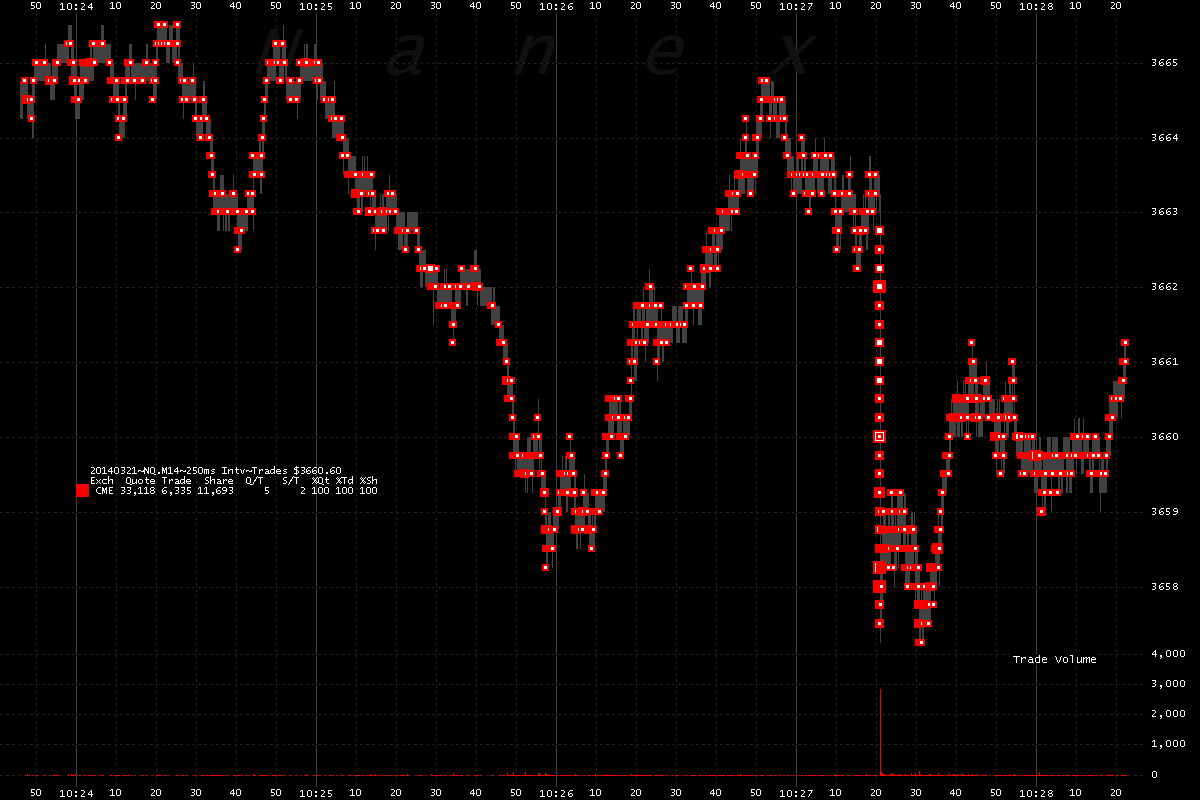
On March 21, 2014, at 10:27:21, the Nasdaq 100 futures contracts (symbol NQ) suddenly dropped on extreme activity: over 3000 contracts trading in 1 second. The corresponding
ETF - QQQ, also dropped on high activity: over 1200 trades in 1 second. The charts below
show this event at the millisecond level.
1. QQQ Trades (cicles) and NBBO shaded red when crossed (bid > ask), yellow
when locked (bid = ask), or gray when normal (bid < ask).
Note how the trades print way ahead of quotes. Chart shows about 140 milliseconds of
time. Most of the trades shown happened in 10-15 milliseconds (see the NQ futures below).
The scattering of trades is due to extra latency experienced by the SIP, but not direct
feeds.

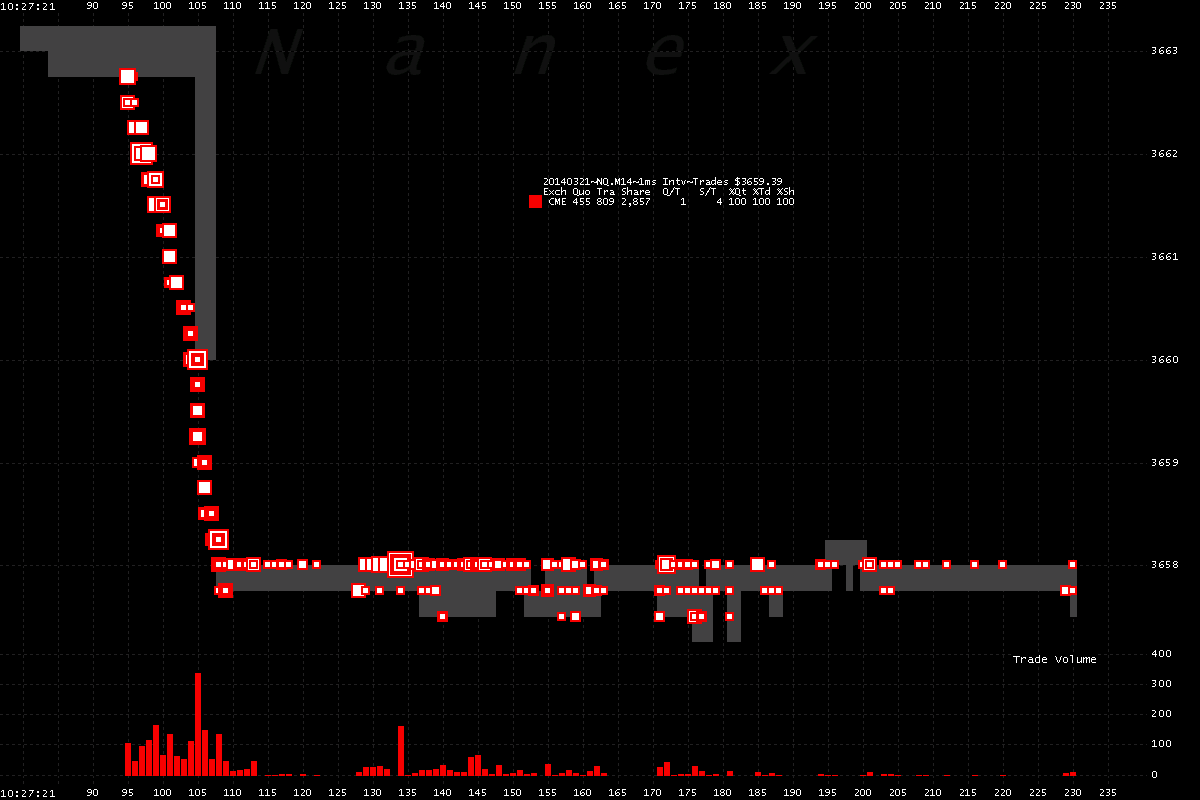
2. June 2014 Nasdaq 100 (NQ) Futures trades and quote spread.
NQ trades in Chicago - comparing the activity to the QQQ's traded in NY, we see that
NQ futures initiated the drop. QQQ's reacted about 4 milliseconds later - the time it
takes light to travel between the two cities.
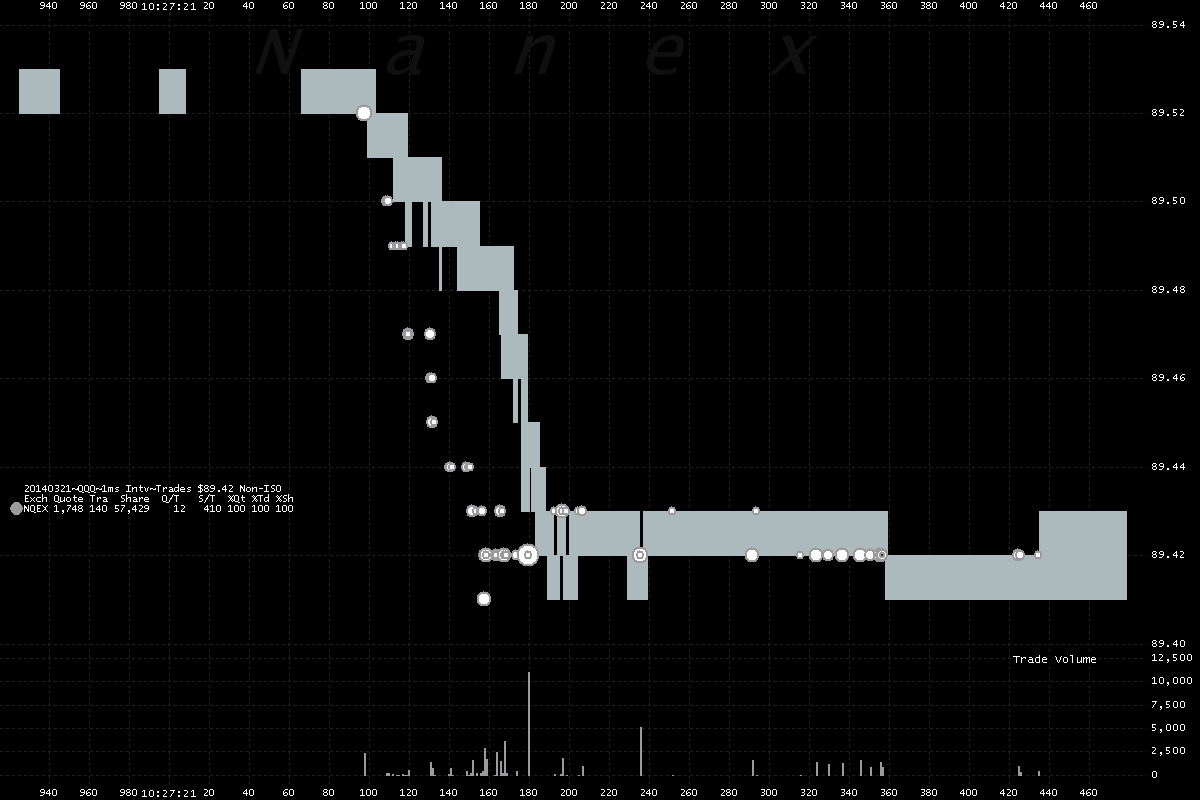
3. Nasdaq non-ISO trades (dots) and quote spread (shading).
ISO trades can appear slightly ahead of quotes, so we only show non-ISO trades. These
trades should appear after quotes: the dots should be on or to the right of the gray
shading.
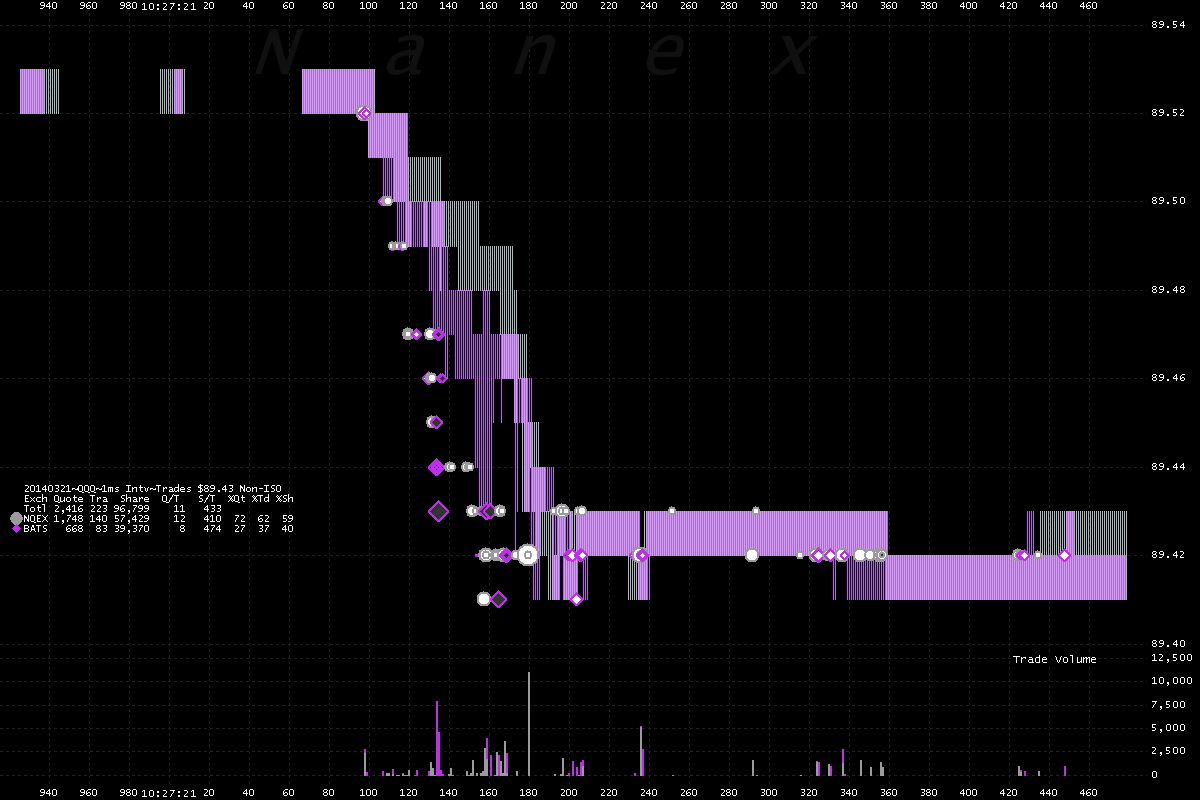
4. Nasdaq and BATS non-ISO trades and quotes.
We can see that Nasdaq quotes are lagging BATS quotes: the gray shading (Nasdaq quote
spread) appears offset to the right of the pink shading (BATS quote spread). This tells
us that some of the delay was caused BEFORE Nasdaq quotes reached the SIP. Because Nasdaq
trades appear ahead of Nasdaq quotes (and BATS trades), we know direct feeds got that
information faster than the SIP did. We call this condition
fantaseconds.
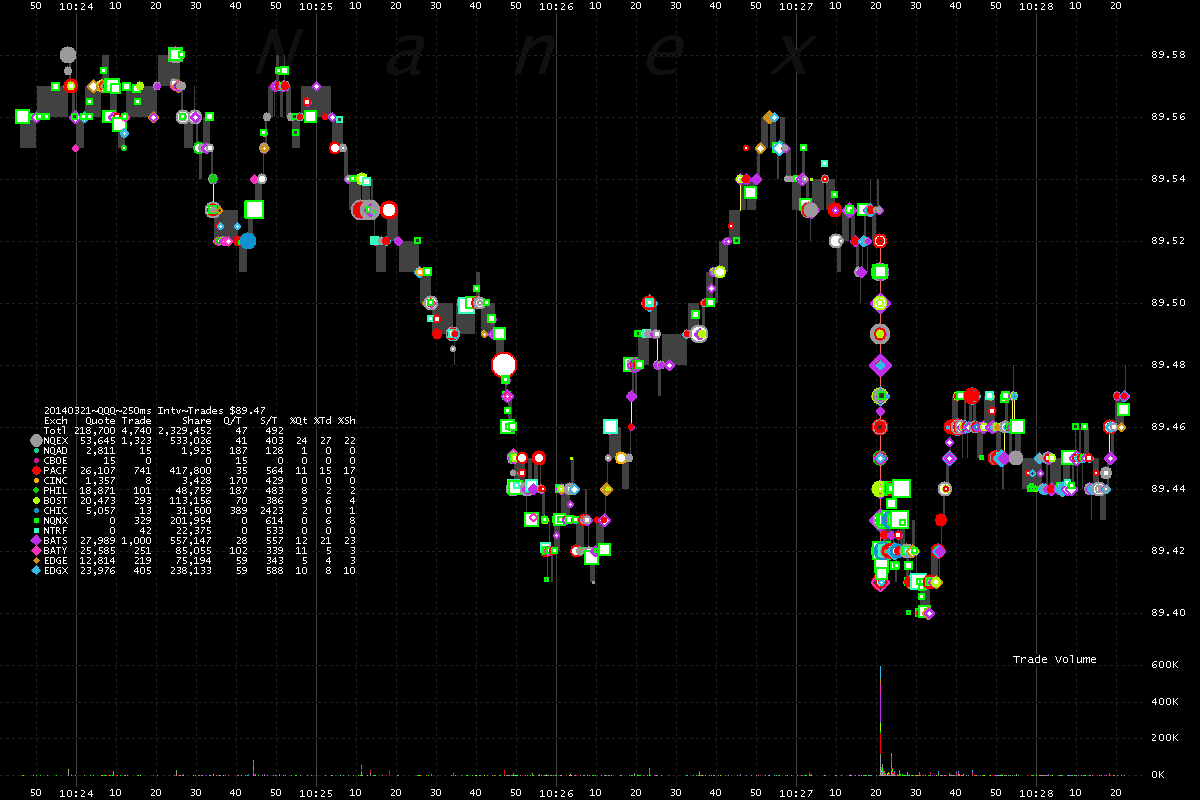
5. Zooming out on QQQ trades and NBBO.
6. Zooming out on the June 2014 Nasdaq 100 (NQ) futures trades and quote spread.
Nanex Research
Inquiries: pr@nanex.net


