Nanex Research

Nanex 23-Apr-2014 ~ Twitterfall Revisited
Charts of the NMS symbols during Twitterfall event (April 23, 2013,
links to original charts).
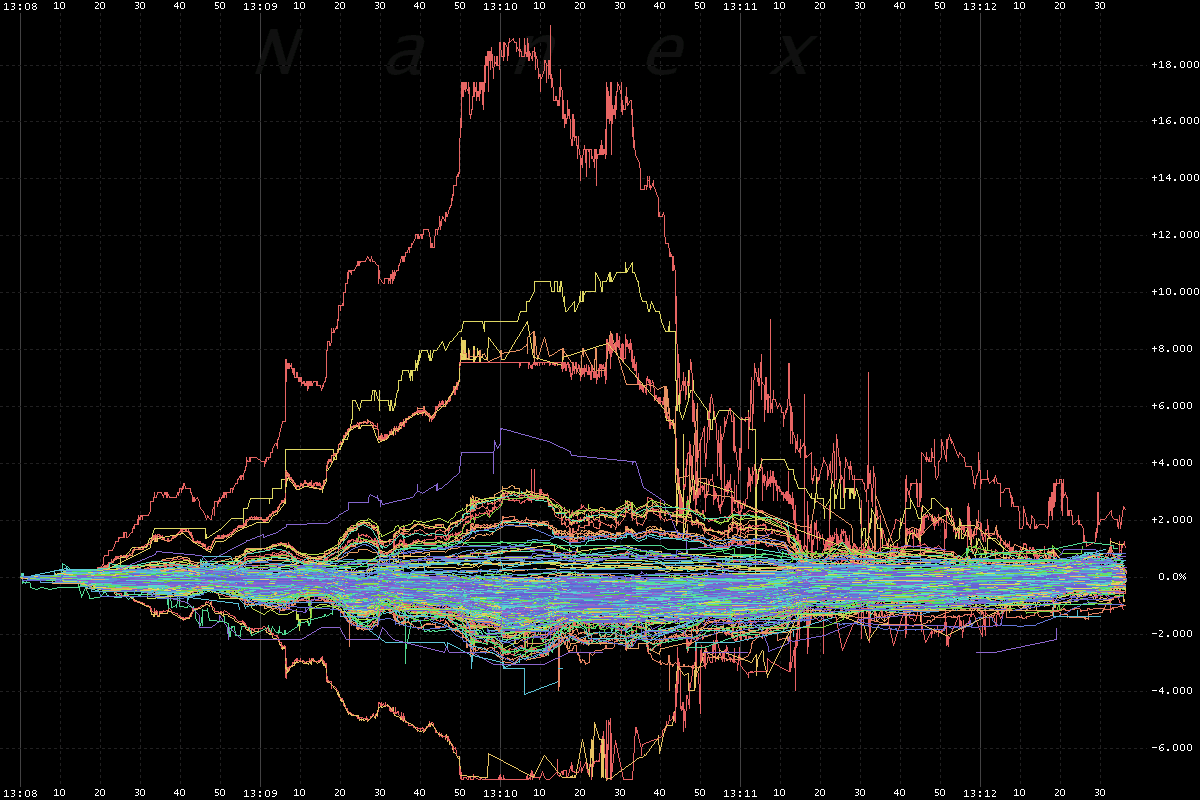
1. Price changes for the top 1000 most active NMS symbols.
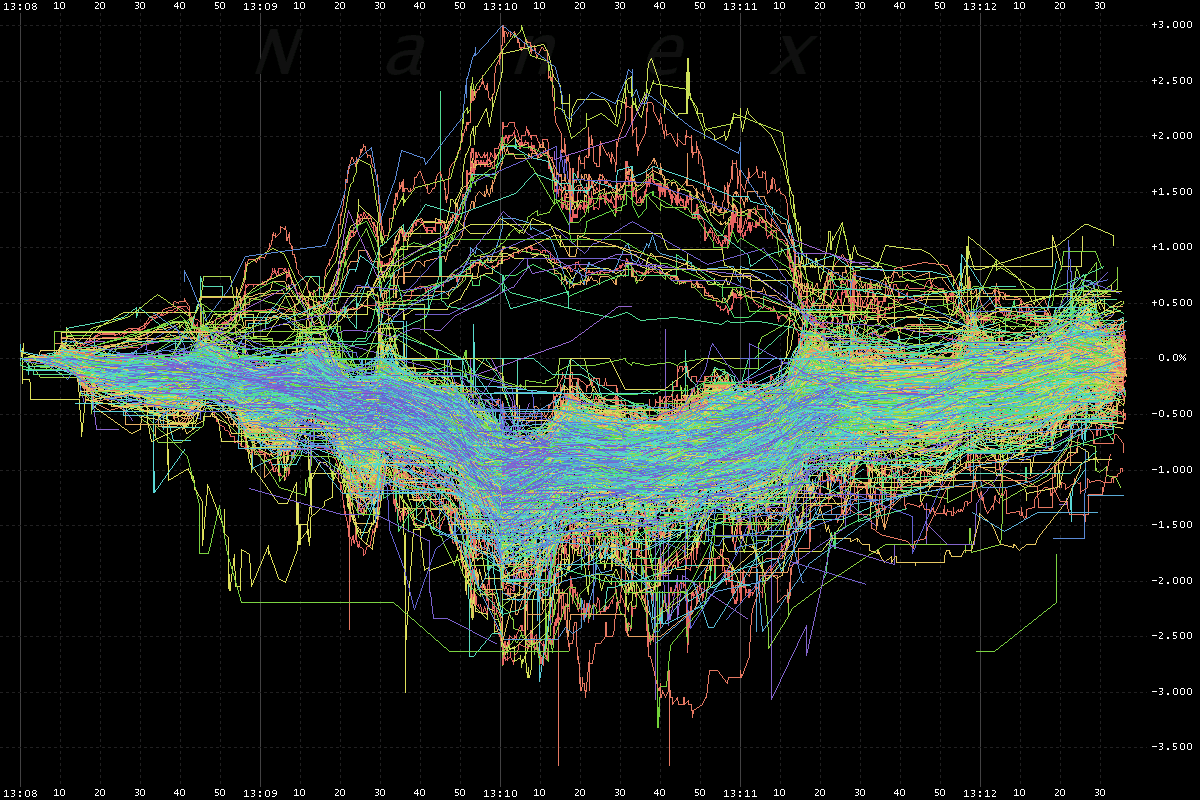
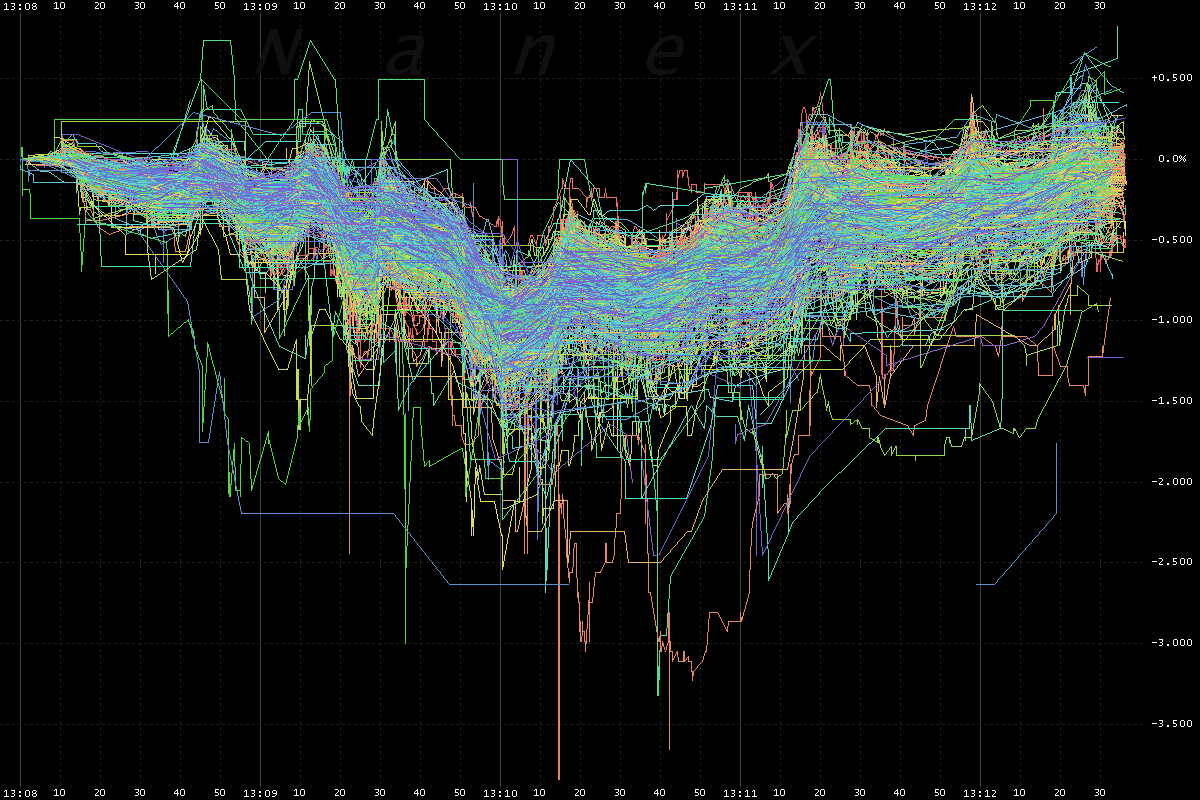
2. Price changes for 774 Stocks and ETFs (excluding 2x, 3x) with at least 100 trades that moved
at least 1%.
Note the pronounced price oscillation of 1% or more showing a alarmingly high price
correlation.
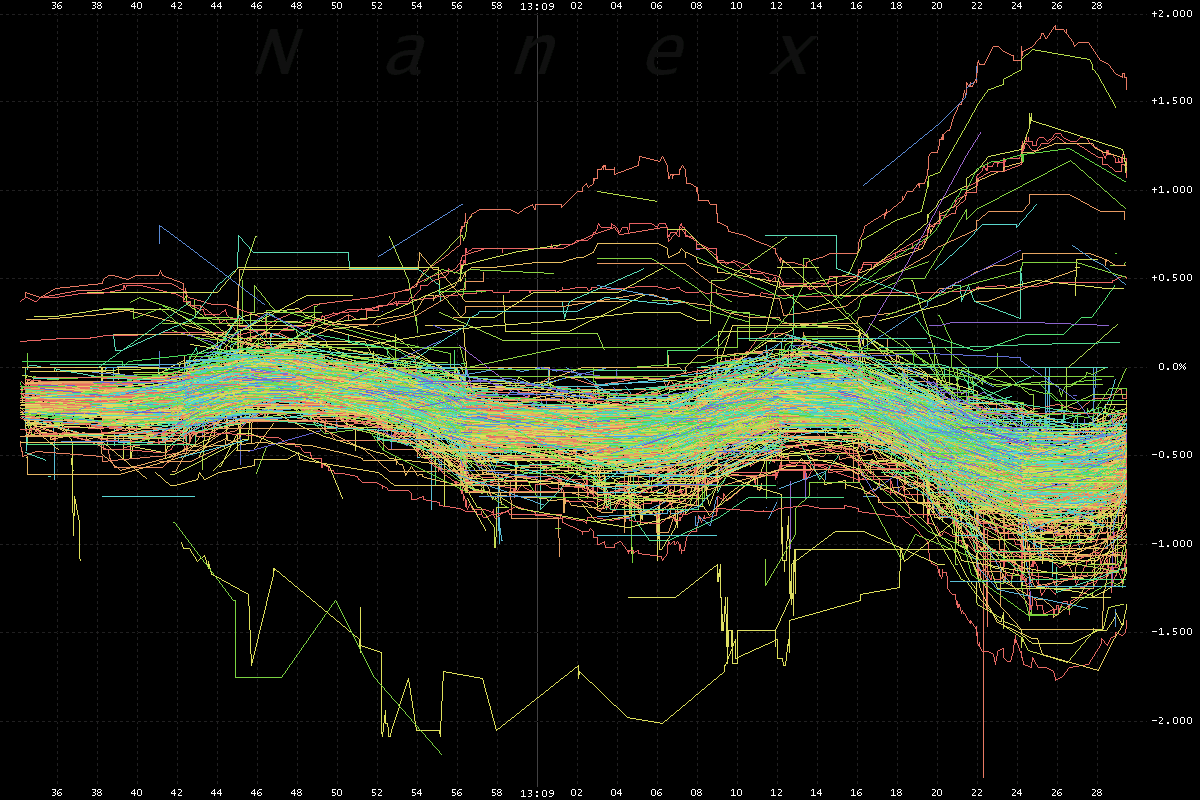
3. Zoom 1 of Chart 2.
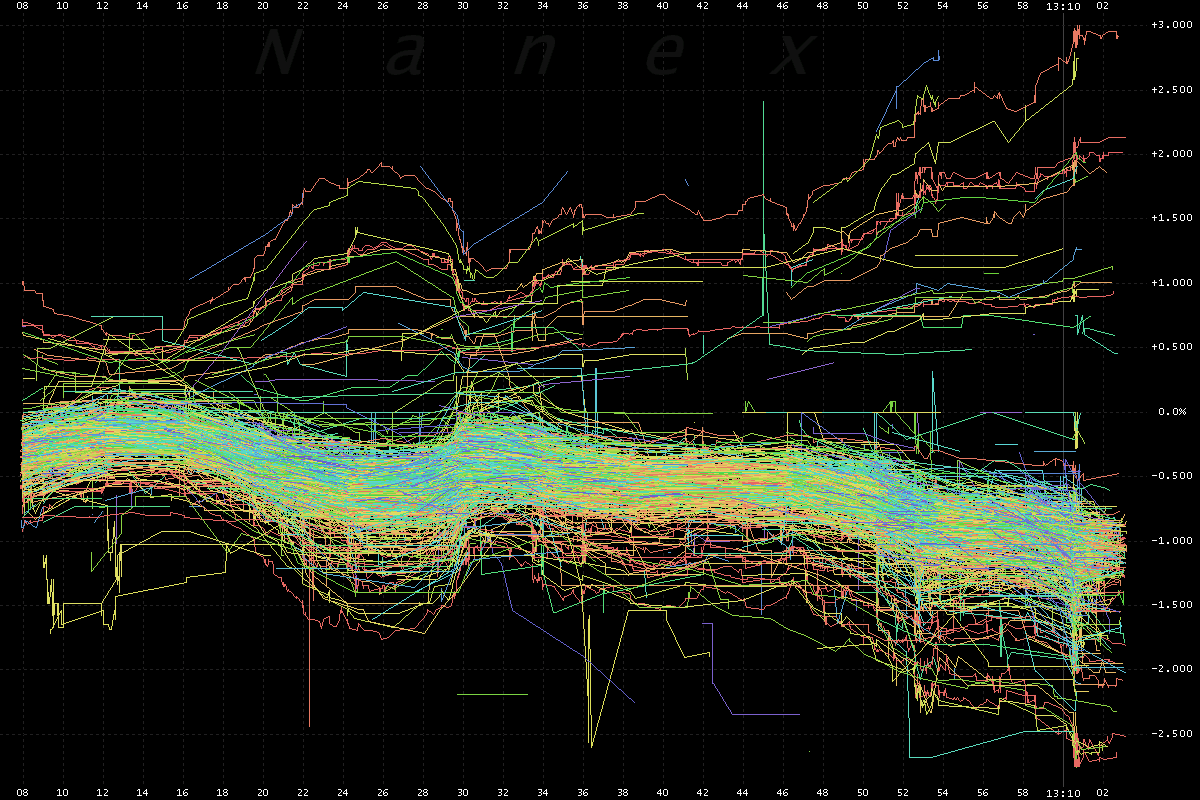
4. Zoom 2 of Chart 2.
5. Zoom 3 of Chart 2.
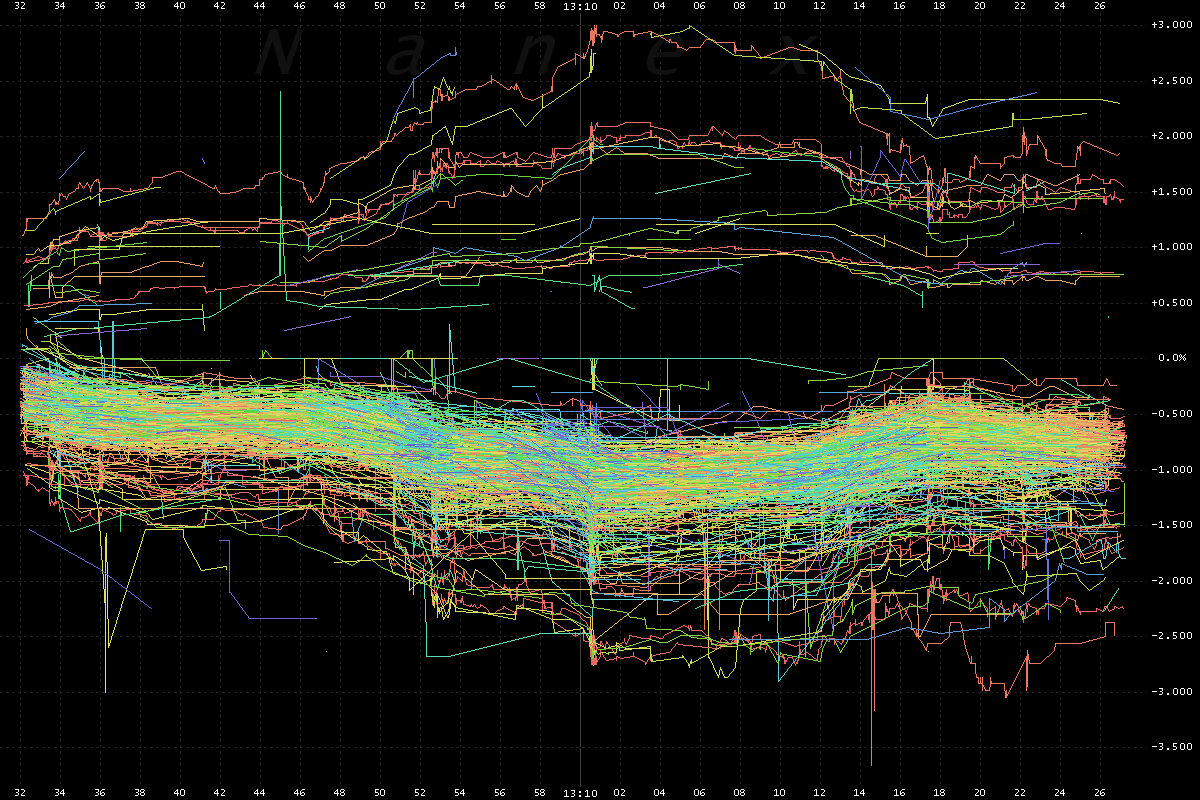
6. Price changes for the the most active NYSE Listed Stocks (excluding Gold/Silver mining companies).
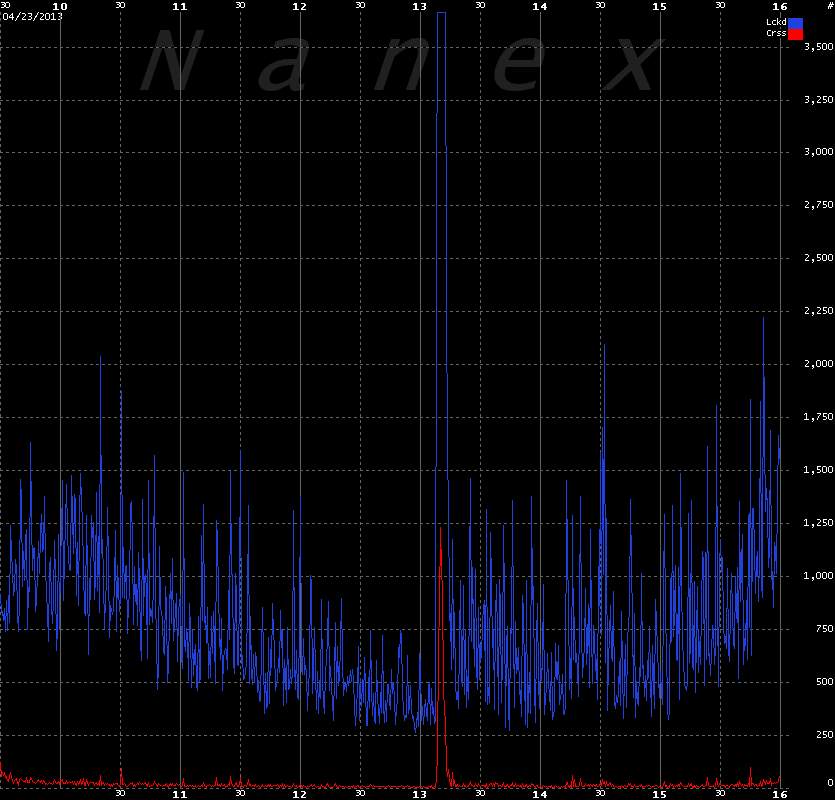
7. Crossed and Locked NBBO Spreads.
Sum of NMS symbols with locked (blue) or crossed (red) NBBO spreads during each 30 second
interval.
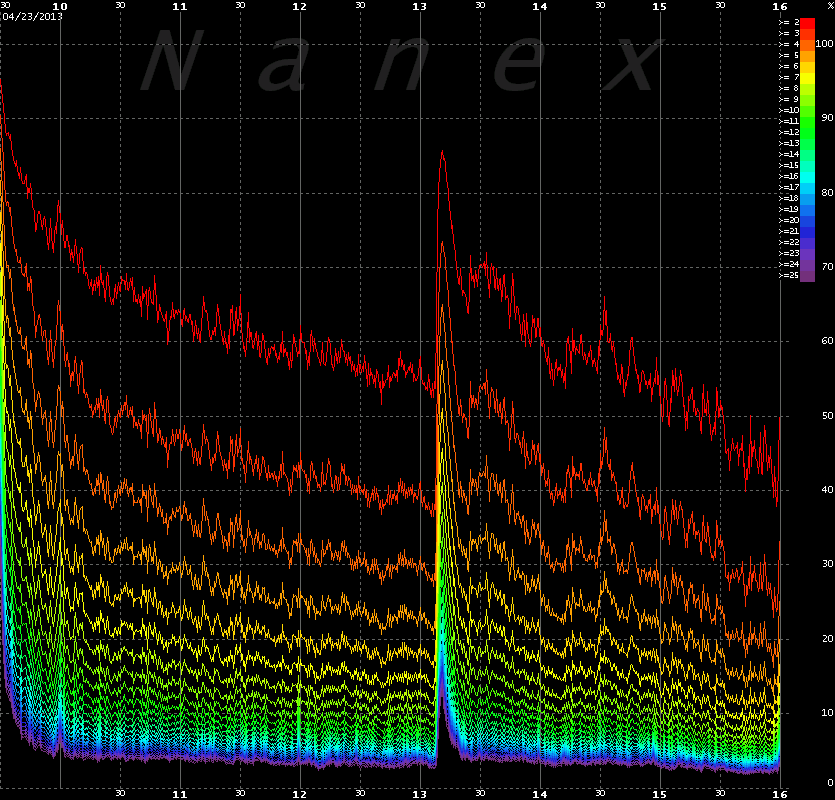
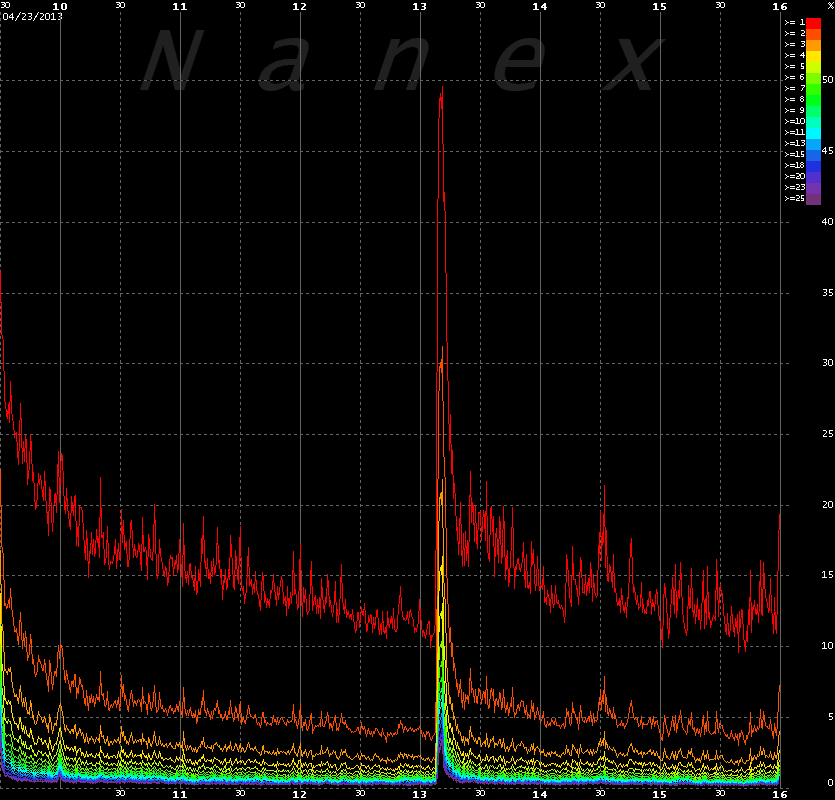
8. NBBO Spreads (Lower is better).
Shows the percentange of NMS stocks with NBBO spreads of 2 to 25+ cents.
9. NBBO Stability (Lower is better).
Shows the percentange of NMS stocks with per second NBBO spread changes of 1 to 25 cents.
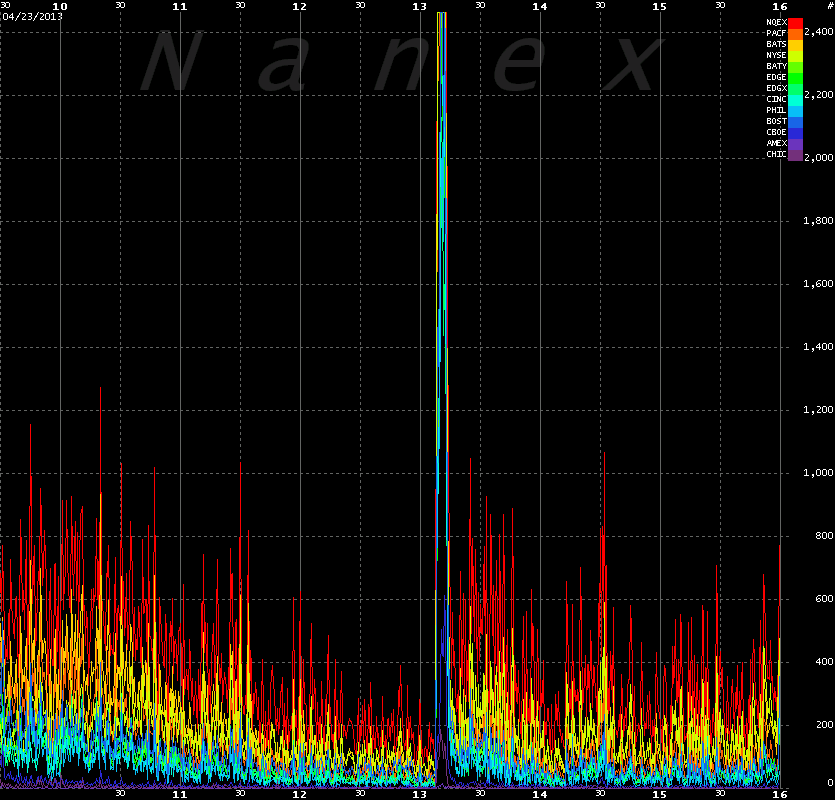
10. Extreme Quote Activity (indicative of HFT algorithms).
This would be a frame from the Rise of
Machine animation.
Nanex Research
Inquiries: pr@nanex.net


