Nanex Research

Nanex 25-Apr-2014 ~ Pricing Amazon

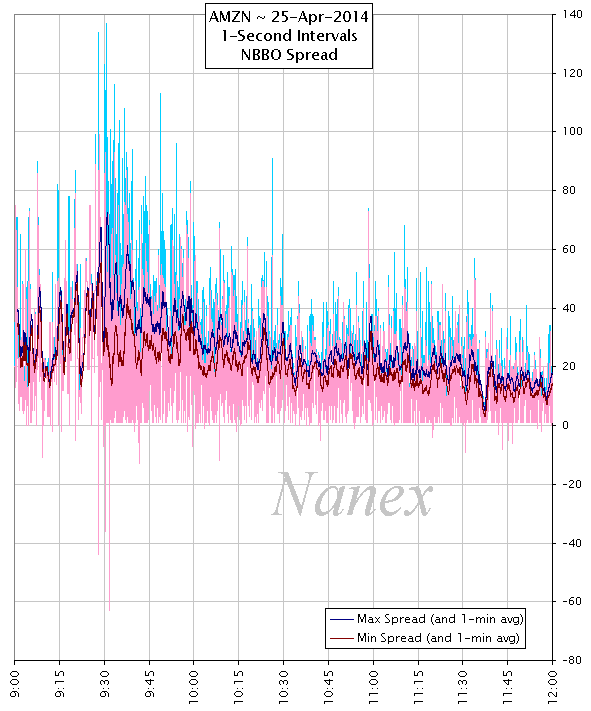
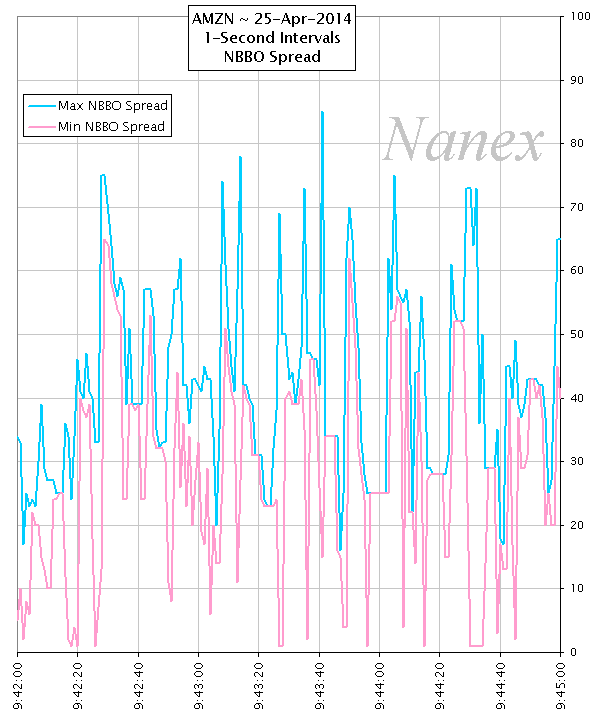
Charting the changes in the NBBO Spread in Amazon on April 25, 2014. NBBO stands for National Best Bid/Offer - you can think of it as the best bid/ask of a stock quote: the best bid is highest price someone is willing to pay, and the best ask is the lowest price someone is willing to sell. A NBBO spread is a measurment of how close buyers and sellers are in price in a stock. Stocks with high liquidity will have narrow spreads, AND those spreads will remain constant for long periods of time.

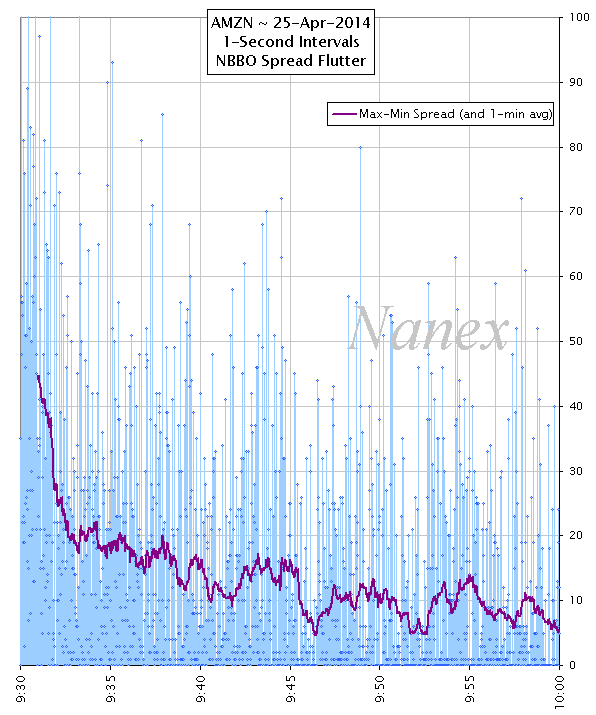
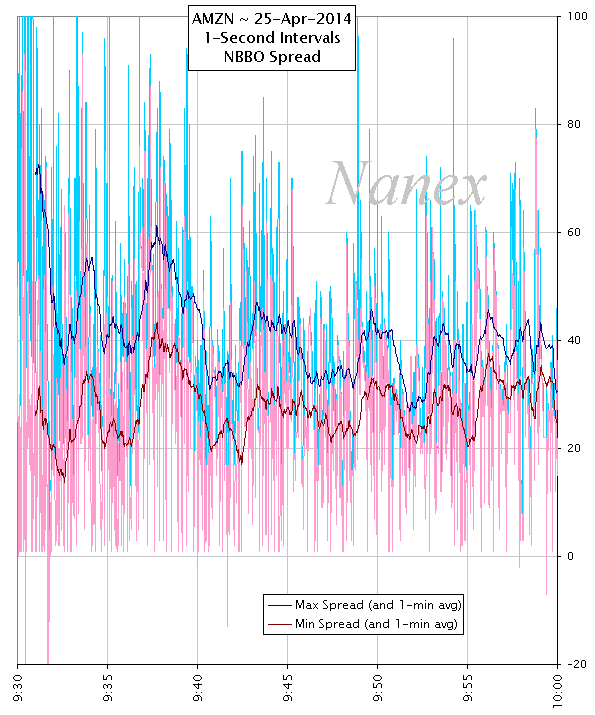
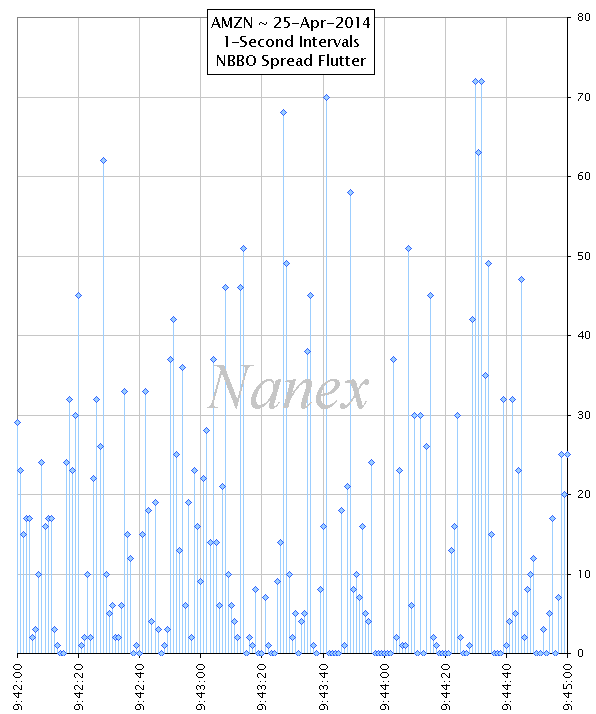
The six charts below are grouped in sets of two (each successive set zooms closer in time): the chart on the left shows how much the NBBO spread varied (the widest minus the narrowest) during each second of time, while the chart on the right plots the widest and tightest NBBO spread during each second of time.

1. Change in the NBBO spread (in cents) during each 1-second interval.
Each blue dot shows how much the NBBO spread varied within 1 second of time. This is not a measurement of how wide or tight spreads are, but rather an indication of NBBO stability. A stock with a constant 10 cent spread would plot out as a flat line at zero. This chart shows that the NBBO in Amazon often varied 20 cents or more EACH SECOND, with some seconds exceeding $1.00.
2. The widest and tightest NBBO spread (in cents) during each 1-second interval.
There shouldn't be values at zero (which would indicate a locked market) or negative (which indicates a crossed market).
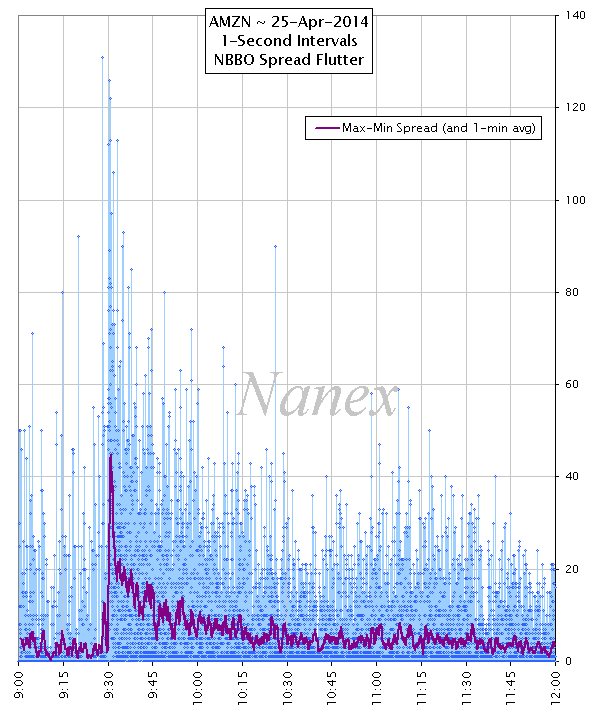
Zooming in to 30 minutes of time.
Zooming in to 3 minutes of time. Note the wide oscillations in the NBBO Spread!


Nanex Research

Inquiries: pr@nanex.net