Nanex Research

Nanex ~ 20-May-2014 ~ LULD Halts on the Rise

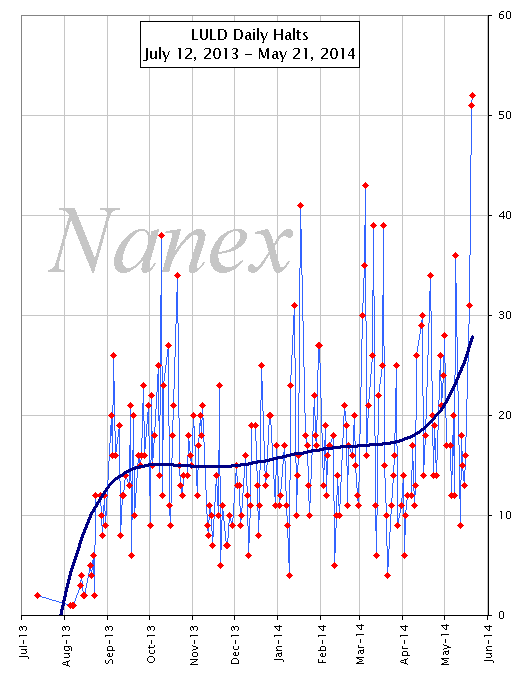
The number of stock halts from the new Limit Up, Limit Down circuit breaker (LULD) is on the rise. Some of this increase is due to multiple halts in the same stock on the same day, and a significant subset of these multi-halt events are triggered, not from actual trading, but from a mere widening of the quote spread. One stock exemplifying this is Collabrium Japan Acquisition Co. (symbol: JACQU, market cap: $55M). On May 20, 2014, the stock halted 19 times! Even more interesting, every halt came exactly 5 minutes and 15 seconds after the previous halt. More interesting still, it halted at the same exact times the next day!

Here are JACQU's halts:

# May 20, 2014 May 21, 2014
Halt Time Time Between Halts (mm:ss) Halt Time Time Between Halts (mm:ss)
1 09:45:15n/a 09:45:15 n/a
2 09:50:3005:15 09:50:30 05:15
3 09:55:4505:15 09:55:45 05:15
4 10:01:0005:15 10:01:00 05:15
5 10:06:1505:15 10:06:15 05:15
6 10:11:3005:15 10:11:30 05:15
7 10:16:4505:15 10:16:45 05:15
8 10:22:0005:15 10:22:00 05:15
9 10:27:1505:15 10:27:15 05:15
10 10:32:3005:15 10:32:30 05:15
11 10:37:4505:15 10:37:45 05:15
12 10:43:0005:15 10:43:00 05:15
13 10:48:1505:15 10:48:15 05:15
14 10:53:3005:15 10:53:30 05:15
15 10:58:4505:15 10:58:45 05:15
16 11:04:0005:15 11:04:00 05:15
17 11:09:15 05:15 11:09:15 05:15
18 11:14:30 05:15 11:14:30 05:15
19 11:19:4505:15 Missed!
Note: LULD was created in response to the Flash Crash, and the creators of this method better hope there is not another flash crash, because LULD will be a disaster in that environment.


1. Daily Count of LULD Stock Halts.
Is FINRA or the SEC paying attention?


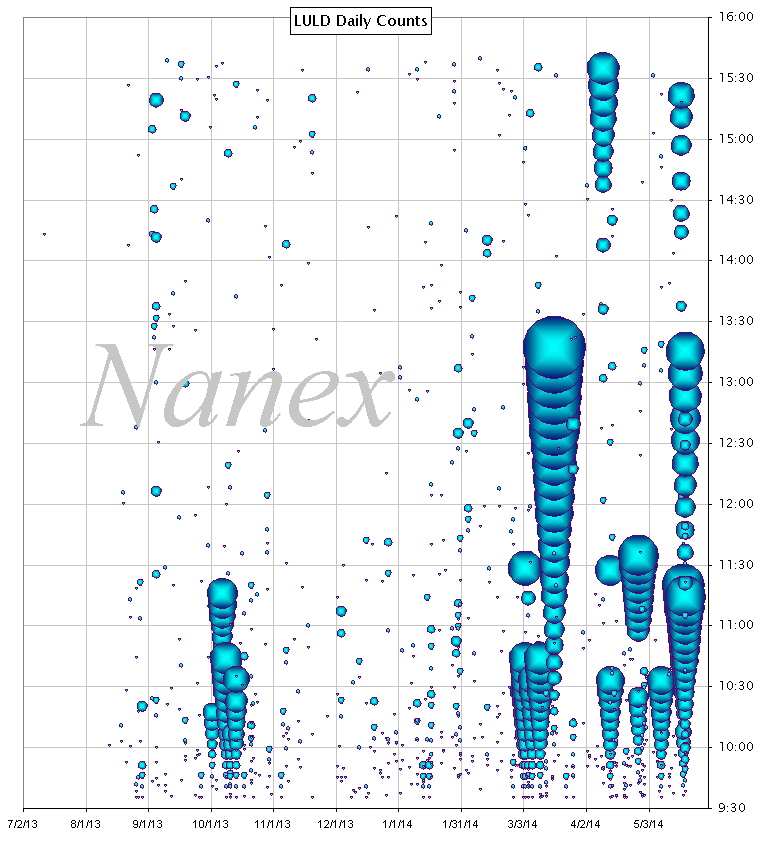
2. LULD Stock Halts by Date and Time of Day.
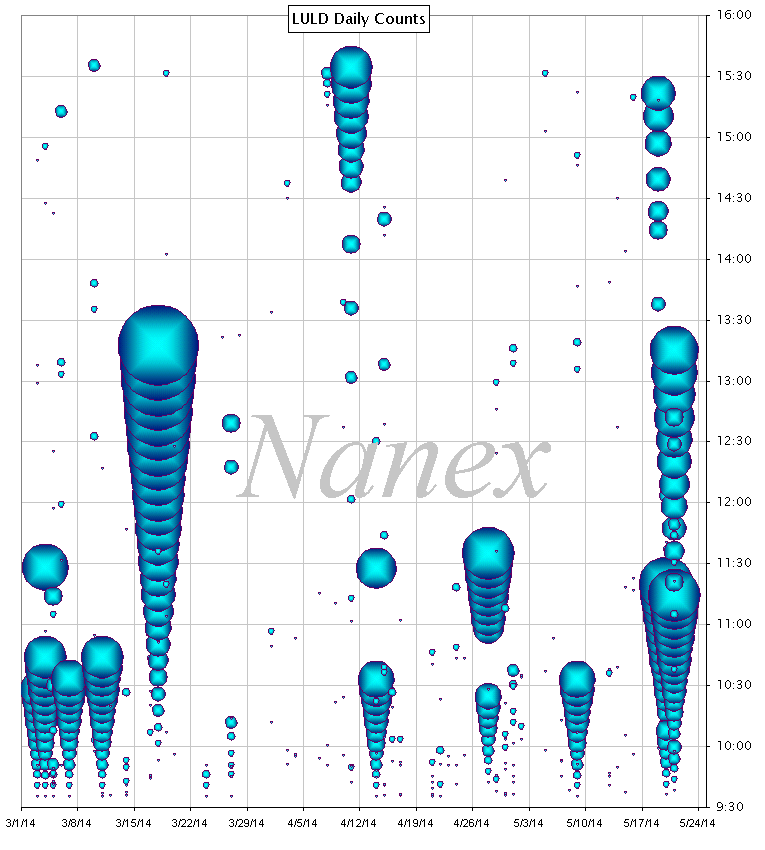
The size of each bubble indicates the halt number in a stock on the same day (the first halt would be tiny while the 10th halt would be a large bubble). A stack of progressively increasing bubbles shows us where multiple halts occurred in the same stock, such as the JACQU example in the table above: JACQU's halts on May 20 and 21 appear as two stack of bubbles at the lower right corner of the chart below.


3. Zoom of Chart 2.


Nanex Research

Inquiries: pr@nanex.net