Nanex Research

Nanex ~ 12-Jun-2014 ~ Reexamining HFT's Role in The Flash Crash


Executive Summary

In the course of researching another issue, we reread transcripts of SEC/CFTC meetings that took place in the months after the flash crash. But this time, we read those transcripts with the gift of hindsight, having gained considerable knowledge from extensive analysis of market data, analysis of the actual Waddell and Reed (W&R) trading data, speaking to people directly involved in the trading of those contracts and the algorithm's logic, as well as talking to regulators and academics directly involved in the Flash Crash Report and papers associated with that report.

Several items jumped out from our second reading that we missed the first time through. Within a day of analyzing the behavior of the W&R Algorithm (the algo) from the actual W&R Trades (being the only private firm given this data), we knew something was significantly wrong with the SEC flash crash report. But now, with the benefit of hindsight and this timeline (shown below), we cast a keen eye looking for differences in the regulator's understanding of the algo over the course of meetings spanning 5 months, and noticed new information and backpedaling at the later meetings, especially the 05-Nov-2010 meeting after the regulator finally met with the person in charge of executing the algo they blamed just weeks earlier (read that story).

What stood out the most, was what seemed like a concerted effort to portray High Frequency Trading (HFT) in the best possible light. The contrast is greatest between the first and last committee meetings. We wonder if Gensler's private dinner meeting with top HFT influenced the 05-Nov-2010 meeting, just 4 days later.

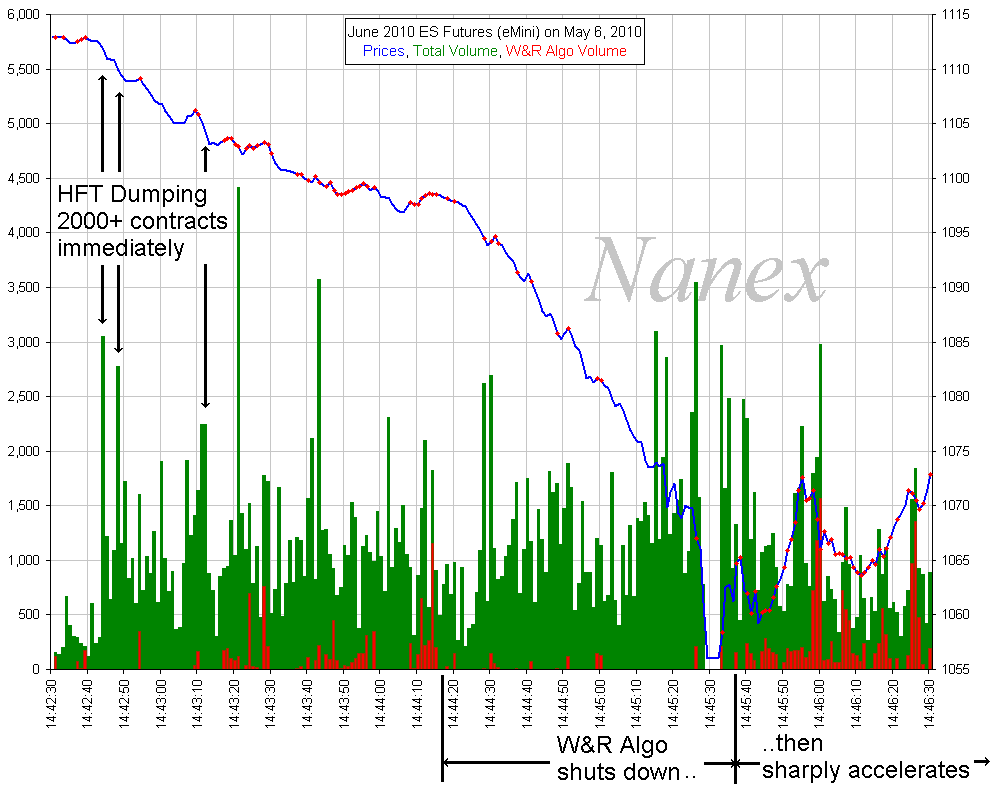
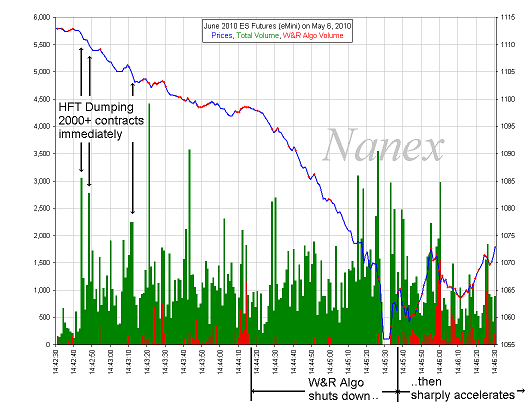
Throughout the transcripts, questions revolved around how much and how fast the algo was selling, with scant attention paid to HFT's super aggressive selling of 2000+ contracts immediately through the book at the very start of the flash crash. (see chart at right).
Timeline

Date (2010) Event
06-May The Flash Crash
18-Jun Nanex Original Flash Crash Findings
22-Jun Joint CFTC-SEC Advisory Committee Meeting (Webcast only - why?)
11-Aug Joint CFTC-SEC Advisory Committee Meeting
27-Sep Nanex Flash Crash Report
01-Oct SEC/CFTC Flash Crash Report
02-Oct Kirilenko: The Flash Crash: The Impact of HFT on an Electronic Market
08-Oct Charts from the actual Waddell & Reed Trading Data
12-Oct Technology Advisory Committee
14-Oct First CFTC meeting with Vijay Pant (headed execution of W&R Contracts)
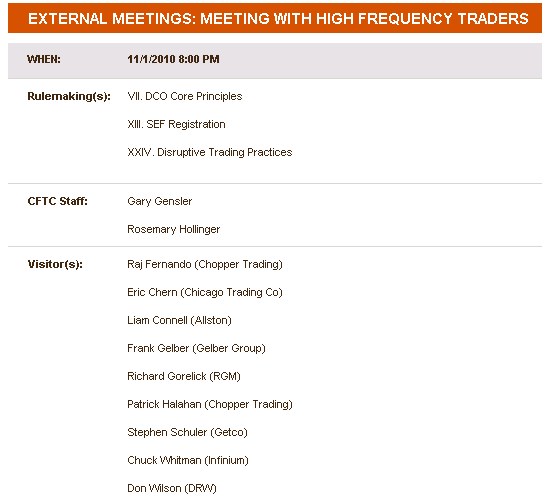
01-Nov Commissioner Gensler meets with top HFT (revealed at 05-Nov-2010 meeting)
05-Nov Joint CFTC-SEC Advisory Committee Meeting

The Evidence

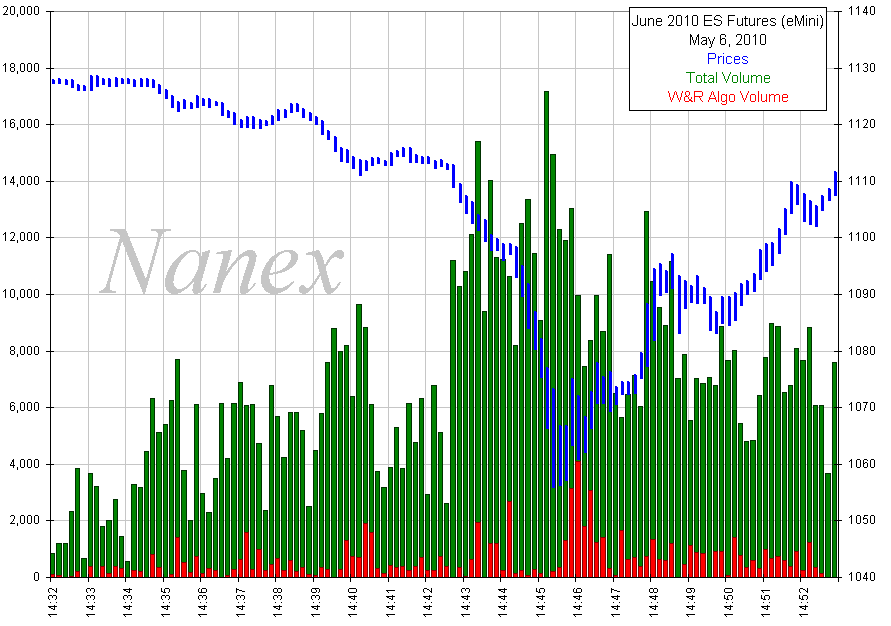
1. eMini prices (blue), Total volume (green), and the W&R Algo's volume (red) for each 10 second period during the time of the 75,000 contract sale.

Note the algo's selling rate drops precipitously during the period when prices drop the most, in spite of soaring trading volume: not at all how the SEC/CFTC report describes it, from page 3:


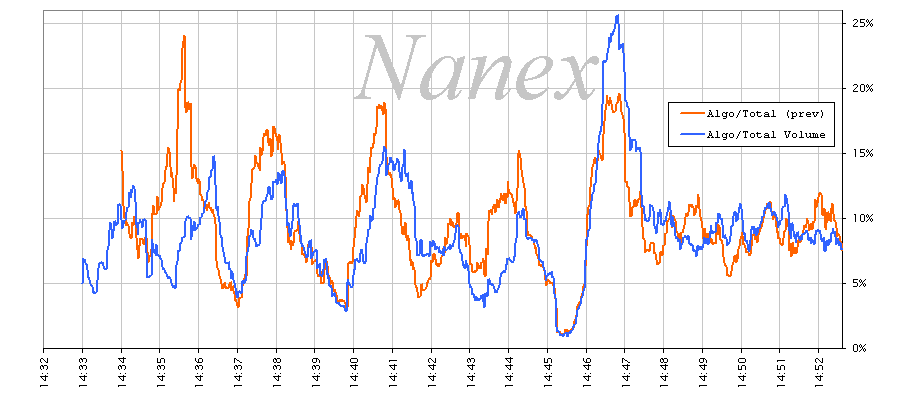
2. We tried many methods of expressing the algo's volume as a percentage of total volume. Here are two examples.

No matter how we sample the data (time period, offset, method, etc.), we end up with the wide oscillations shown below. Here are two examples, one uses a 1 minute sliding window (blue), the other uses the same 1 minute sliding window, but takes the total volume from one minute earlier (orange). Due to the ambiguity of the word "previous", one of these two methods matches how Andrei Kirilenko described the rate at which the algo feeds orders into the market, from the SEC/CFTC Flash Crash Report page 2:

Conclusion: the algo doesn't appear to use the previous minute's volume: if it did, there wouldn't be wide oscillations.

Note the blue line hits its peak selling rate - 26% of the total volume in a minute - right after the low is set.


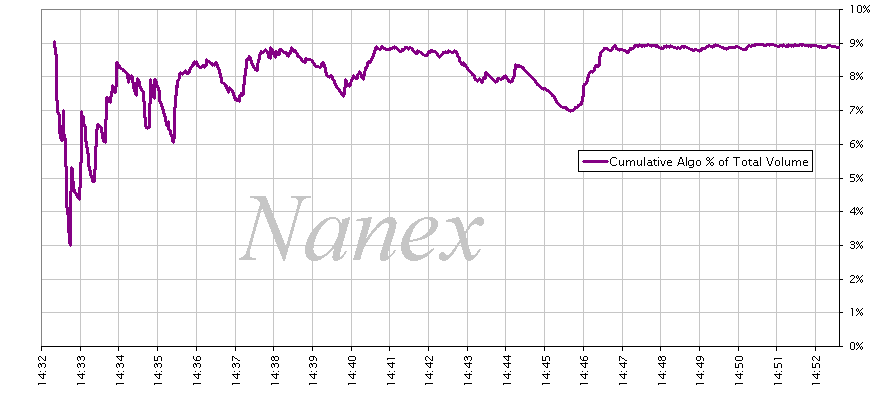
3. Cumulative Algo Volume Percentage (CAVP).

Cumulative algo volume as a percentage of cumulative total volume since the algo started at 14:32. Note the algo NEVER exceeds 9% - this is because code prevents it from exceeding this threshold. If the algo relied on volume only (and not time or price), then there shouldn't be dips to 7%, especially after the first few minutes.


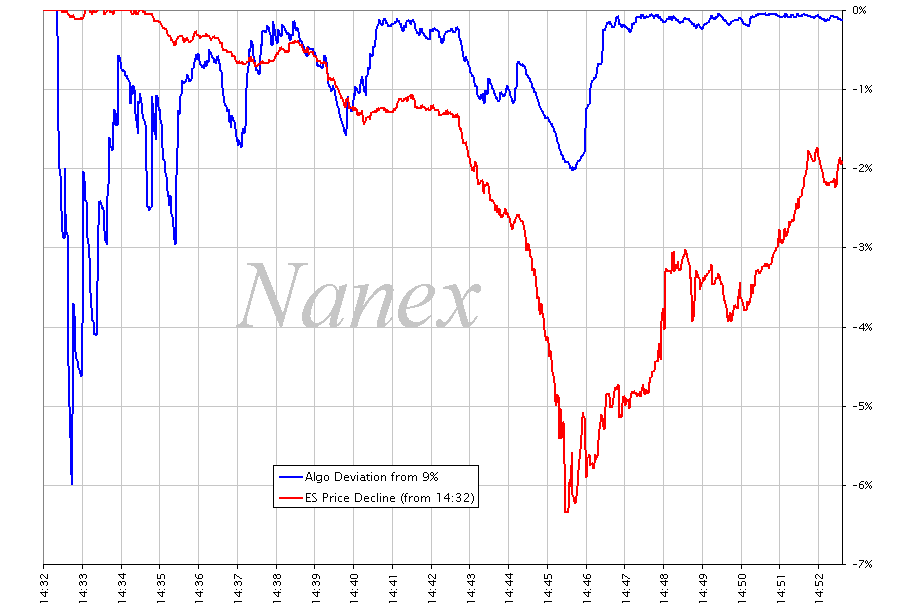
4. CAVP Deviation from 9% Target and ES Price Change since 14:32

Starting with the chart above, we offset the CAVP line by 9% (to align scales) and plot it along with the eMini price change (since 14:32).

Note how the algo significantly slows down the rate of selling when market drops, and speeds up when the market rallies (blue and red lines track each other).

Yet, according to the SEC/CFTC Flash Crash Report, the algo increased the rate it was selling contracts, from page 3:
The dip to -2% at 14:45 is substantial and forms during the period of the largest and fastest price drop. It is substantial because the percentage applies to cumulative volume up to that point: it's as if the algo were programmed to execute only 7% of total volume instead of 9%. After the 5-second halt, the algo sells at it's highest rate and makes up the short-fall. This is when the market is rallying from the low of the day!


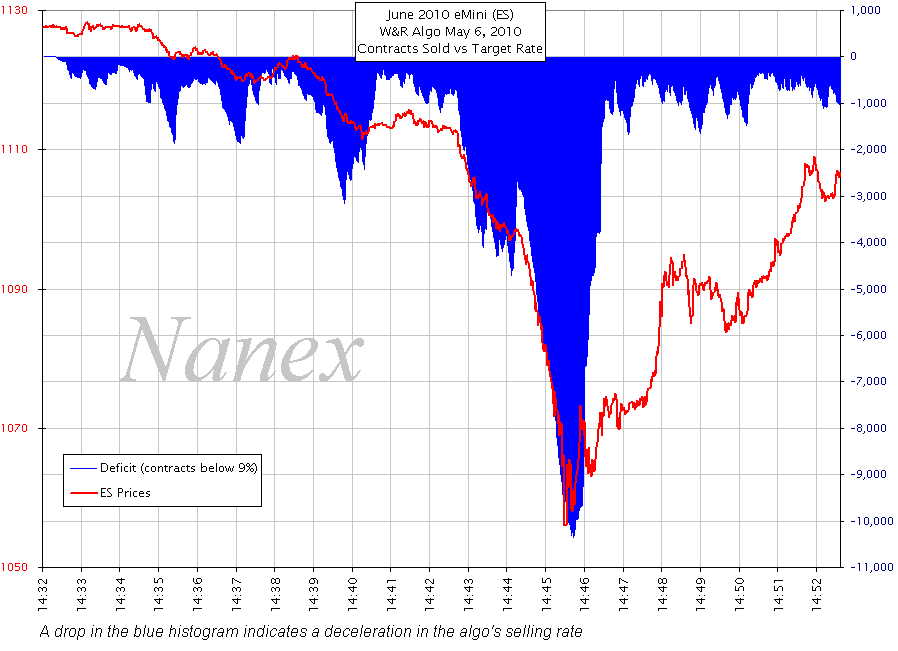
5. Converting the CAVP Deviation to Actual Contract Numbers.

The blue histogram shows the cumulative imbalance between the number of contracts the algo sold and 9% of the total volume since selling began at 14:32. Since the cumulative selling rate never exceeds 9%, this imbalance is always a deficit or shortfall and the amount represents how many contracts it's behind the 9% cumulative selling rate. Thus, a value of -10,000 indicates a shortfall of 10,000 contracts, which means the algo would need to sell an additional 10,000 contracts to stay on its 9% target.

Because these percentages are based on cumulative volume since the algo started (14:32), the same percentage shortfall will show up as increasingly larger imbalances as time progresses. For example, the 2% shortfall in the middle of Chart 4 above (blue line) translates into a 10,000+ contract shortfall in the chart below.

With this chart, we can see a clear, strong correlation between the price (red) and imbalance (blue). When the market drops, the algo sells less and falls behind its 9% target, and when the market moves up, the algo sells at a higher rate to get back on its 9% target.

The shortfall exceeded 10,000 contracts when the market bottomed and the circuit breaker tripped. That is, if the algo was blindly selling 9% of total volume as the SEC/CFTC report claims, it should have sold an additional 10,000 contracts before the market bottom.

After the halt, the algo rapidly reduced that imbalance: it not only sold 9% of the current volume, but sold an additional 10,000 contracts. But, according to the SEC/CFTC flash crash report, this was at a time when the market had close to zero liquidity. Why did this significantly higher rate of selling not drive prices even further down? Because the algo was passive, not aggressive.

How was this not a major topic of discussion in the Flash Crash Report or any of the SEC/CFTC meetings?

In fact, many who spoke at these meetings, including the Commissioners and Chairman Mary Shapiro, where clearly confused and misled on how this algo really functioned. Worse, there was scant attention paid to the real culprit in the flash crash: the HFT (keep reading).

6. eMini prices, Total Volume, Algo Volume and Algo Prices for each second during the Flash Crash Sell-off Period (14:42:44 to 14:45:28).

Contrast the algo's behavior with HFT behavior. At 14:42:44 - and again 4 seconds later, HFT market maker software detected that its inventory limit was exceeded and needed to reduce its position. It accomplished this, not by passively selling, but by immediately, and aggressively (on a scale of 1-10 of aggressive behavior, it was an 11) selling its entire inventory onto the the market. This caused a sudden price drop not only the eMini, but also SPY and its components, and the options for those symbols, all of which led to massive blasts of order cancellation and replacement messages: a tsunami of message traffic that reverberated through Wall Street networks at the speed of light and swamped all networks and computers in its path. This was the beginning of widespread system delays and is the reason why many other market participants either pulled out, or sharply curtailed their activity. That, is what caused the flash crash.

The aggressiveness of HFT selling is never portrayed as it really happened.

This summary explains how HFT took a passive algorithm and basically turned it into a super aggressive one, and flash crashed the market. This same mechanism happened again in crude oil as documented here.


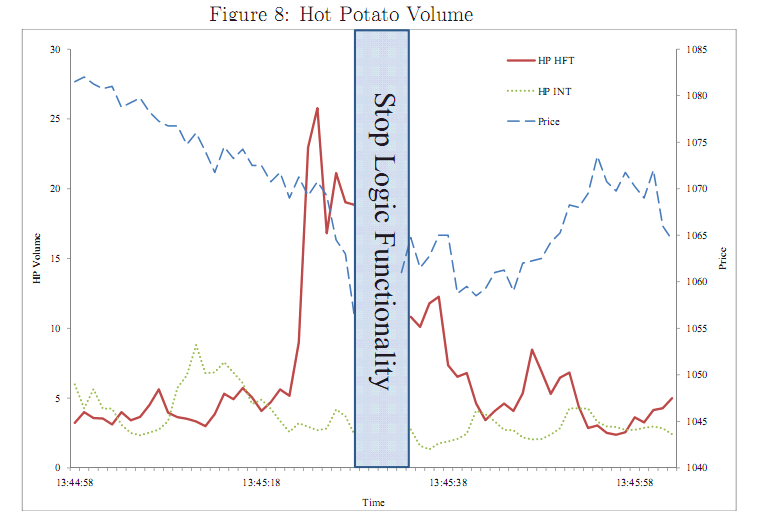
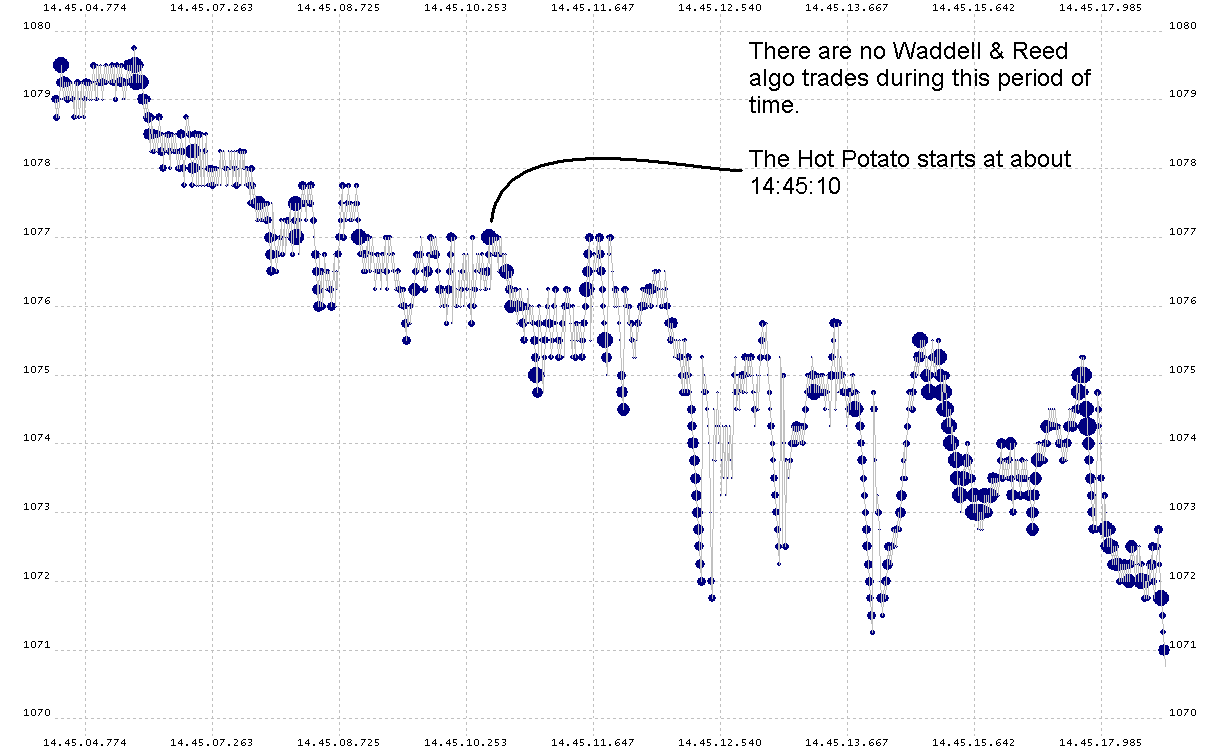
7. The Hot Potato Chart from page 56 in Kirilenko's Paper.

Reading the transcripts from these 2 SEC/CFTC Advisory Committee Meetings (11/05/2010 and 10/12/2010) reveals much confusion about the role the algo played in the Hot Potato Game, with some commissioners believing the increased volume during this time somehow contributed to the crash.

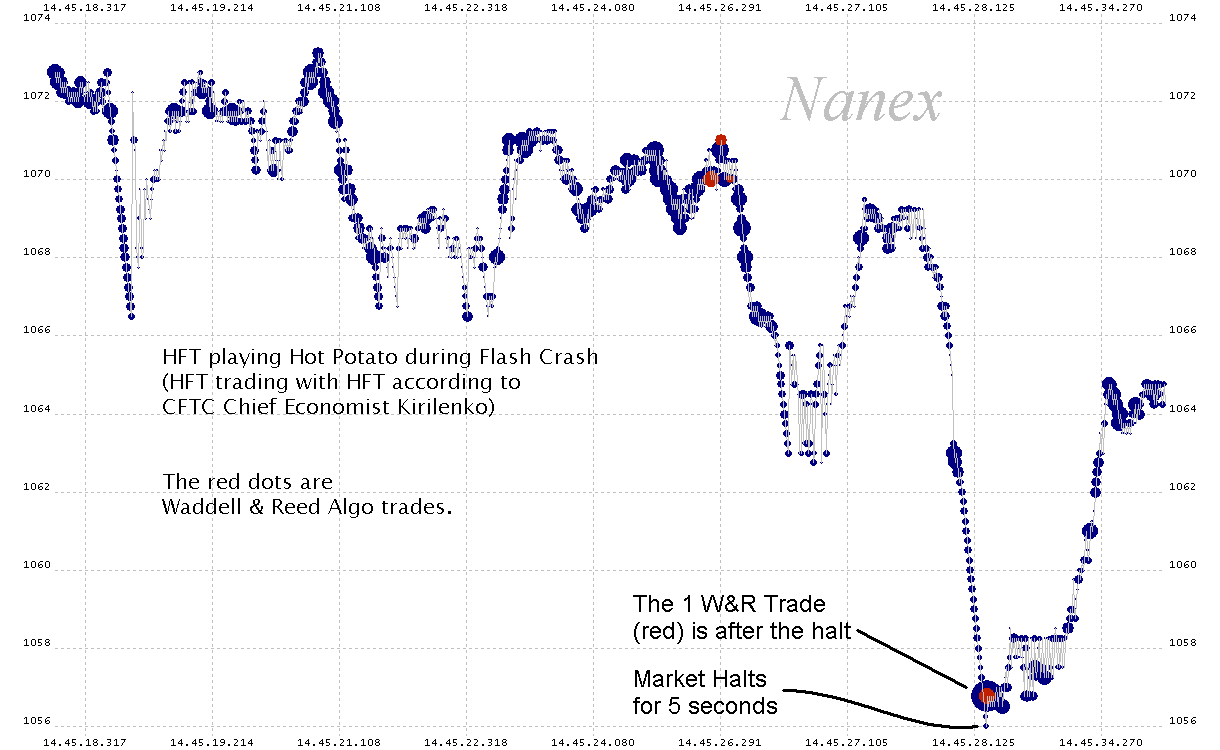
Note: HFT Hot Potato Game started just 18 seconds before the market bottomed and the 5-second eMini halt.

The algo neither caused, participated in, nor was influenced by (other than selling more AFTER the bottom) the HFT Hot Potato Game.


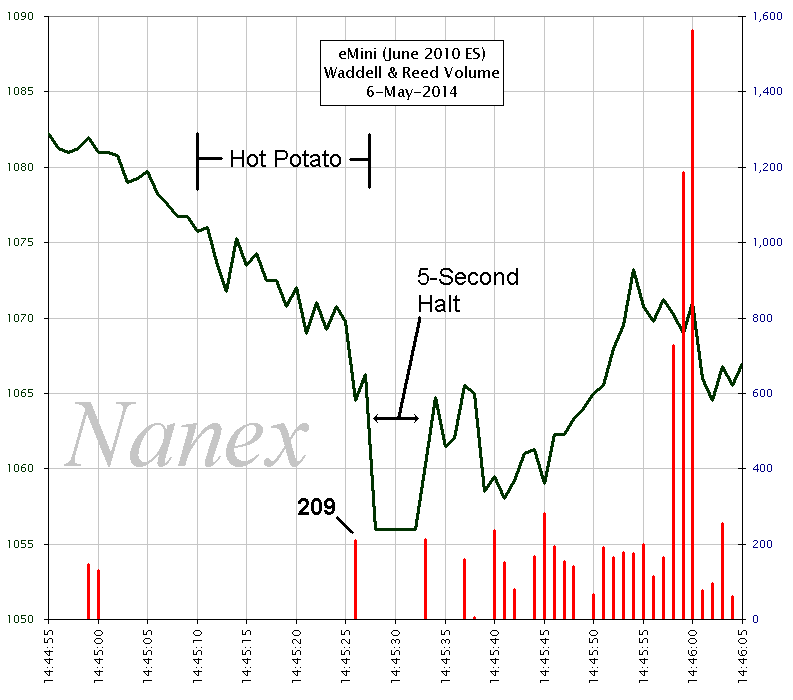
8. Prices of eMini and Algo volume using the same time scale as Chart 7 above. Note - the CFTC uses Central Time (1 hour behind Eastern).

During the Hot Potato event (14:45:10 to 14:45:28 ET), the algo sold just 209 contracts!


9. Tick Charts during the Hot Potato.

The algo is practically shut down until the circuit breaker hits. Just look at this HFT madness (note the price swings!)

This is what a market looks like when only HFT are left trading against each other.


Intermediaries and Data Mining

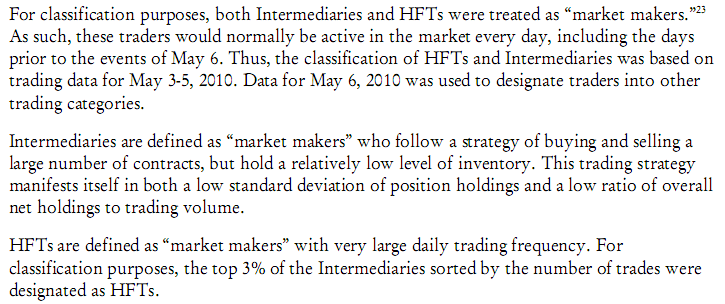
The SEC/CFTC Flash Crash Report uses categories of traders to describe group behavior. One thing that stuck out was how they split HFTs and Intermediaries into separate groups. Intermediaries, the report explains, are market makers that behave a lot like HFT. But, rather than lump them all together, the writers of the report decide to carve out a tiny 3% of these Intermediaries and call them HFT. From page 13:

What's the reasoning behind this? Why carve out a tiny 3% for a special group. And why 3%, and not 4% ? Or as we shall see in a moment, 7% (or 8.2%)?

A person familiar with the matter put it like this: "They [SEC/CFTC] used data mining so the HFTs don't look bad".

Sure enough, turn to page 16, and we find HFT's were good and stayed in the market, but half of the Intermediaries withdrew. A good bet is that Intermediaries in the top 4% were among the ones that pulled out, and therefore didn't get the grade of (and thereby besmirch) HFT.

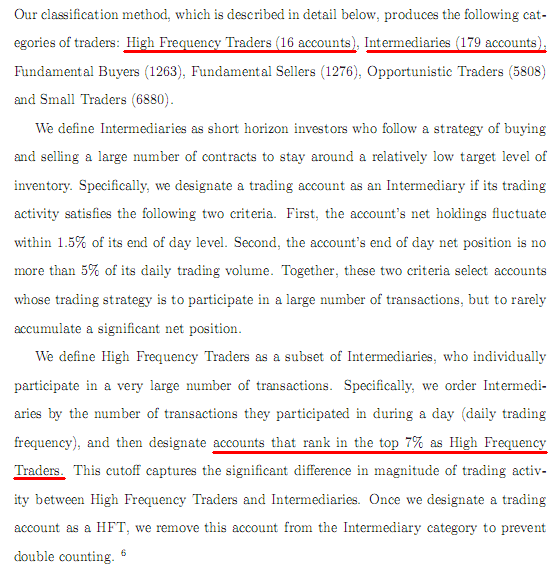
Not convinced? Here's how HFTs and Intermediaries were split in Andrei Kirilenko's paper (CFTC Chief Economist and co-author of SEC/CFTC Report), which was published the very next day after the Flash Crash Report. From page 12:

Kirilenko doesn't use 3%, he uses 7%. And no surprise, the HFT group in Kirilenko's paper isn't nearly as angelic as the HFT group in the SEC/CFTC report.

But note how Kirilenko's numbers don't add up either: before dividing, there were 195 Intermediary accounts (16+179). 16 out of 195 is 8.2%, not 7%. Did Kirilenko also experiment with numbers to see what fit best?

This looks like a case of data mining to us.


The Private Dinner Party

Just 4 days before the November 5, 2010 Joint CFTC-SEC Advisory Committee Meeting, Chairman Gensler had dinner in Chicago with the top High Frequency Traders. You can find this on page 125 of the transcript of the Advisory Committee Meeting:
Fortunately, Dodd Frank had recently passed, requiring disclosure of this meeting:

Conclusion

Call your Congressman. Voice your concerns. The CFTC and the Trading and Markets Division of the SEC must be investigated, and corruption rooted out. The Flash Crash Report had little to do with data, and everything to do with undue influence.


Nanex Research

Inquiries: pr@nanex.net