
We received trade execution reports from an active trader who wanted to know why his large orders almost never completely filled, even when the amount of stock advertised exceeded the number of shares wanted. For example, if 25,000 shares were at the best offer, and he sent in a limit order at the best offer price for 20,000 shares, the trade would, more likely than not, come back partially filled. In some cases, more than half of the amount of stock advertised (quoted) would disappear immediately before his order arrived at the exchange. This was the case, even in deeply liquid stocks such as Ford Motor Co (symbol F, market cap: $70 Billion, NYSE DMM is Barclays). The trader sent us his trade execution reports, and we matched up his trades with our detailed consolidated quote and trade data to discover that the mechanism described in Michael Lewis's "Flash Boys" was alive and well on Wall Street.
this is just beautifully done. clean, simple, irrefutable. i hope it gets read far and wide.
--Michael Lewis after reading this article
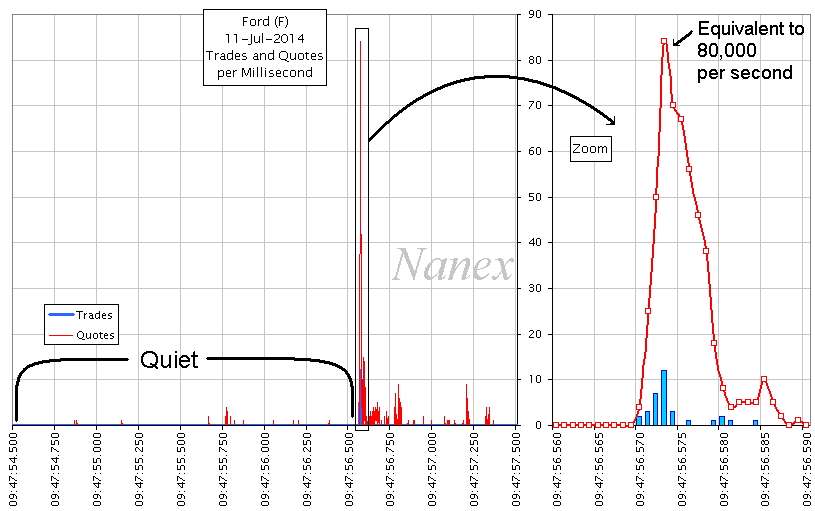
Let's take a look at what we found from analyzing 5 large trades executed at different times over a 4 minute period in Ford Motor Co. Before each of these trades, the activity in the stock was whisper quiet. Here is a chart showing millisecond by millisecond trade and quote counts in Ford leading up to one of these 5 trades:
You can clearly tell when the trade hits: activity explodes to over 80 quotes in 1 millisecond (this is equivalent to 80K messages/second as far as network/system latency goes). But the point here is that nothing was going on in this stock in the immediate period before this trade hits the market.
In this particular example, there were a total of 24,800 shares advertised for sale at $17.38 (all trades and offered liquidity will be at this same price) from 8 exchanges. The trader wanted 20,000 of these shares. What he got was only 12,133 shares and 600 of these were on a dark pool (which wasn't part of the 24,800 shares of liquidity on the lit exchanges). Worse, someone ELSE was filled for 1,570 shares during these same milliseconds. Remember, nothing was happening in Ford until this order came into the market. Based on the other 4 examples, we are sure that no trades would have occurred during these few milliseconds of time if it wasn't for this trader's order.
What happened to the 24,800 shares offered and why couldn't he get at least 20,000 of them? How is it that others were able to get shares during this time? This is especially disturbing when you consider these other traders (HFT) only bought shares in reaction to the original trader's order.
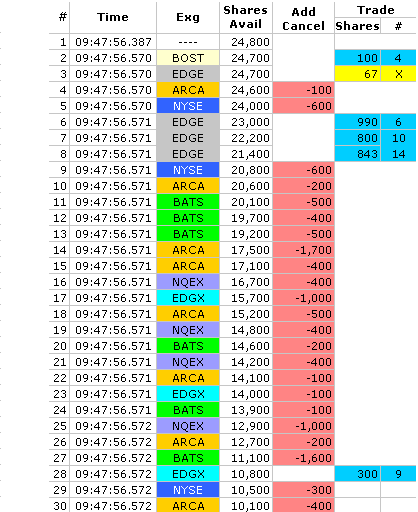
To answer these questions, let's take a look at the individual order executions and cancellations at the $17.38 limit price. In the table below, there are 7 columns. The number in the 1st column we'll use to reference a record. The 2nd column is the timestamp of the event - this is from CQS/CTA, the consolidated quote and trade SIP (Securities Information Processor). The 3rd column shows which reporting exchange sent the information in this record. The 4th column shows the total number of shares offered at $17.38 among the exchanges that trade this stock (Ford) and the 5th column (Add/Cancel) shows the number of shares added to, or removed from the total offered. If the 5th column is blank, it's because this record represents a trade execution.
The 6th and 7th columns show information about one order execution resulting in a trade at $17.38 (these columns are blank if the record is a quote update). The 6th column shows the number of shares executed, and the 7th column contains either a number which corresponds to the trade report # received by our trader, or an "X" which indicates someone else got this trade execution.
| Note that other than the first entry (which is a reference to how long the 24,800 shares were sitting in the books waiting for execution), there is only 3 milliseconds of time shown here! The entire trade is reported in about 15 milliseconds (82% completes in 5 milliseconds). Looking at the table data, we note the first trade is 100 shares on BOST (NQ-OMX Boston) and belongs to our trader. Note, however, it was the 4th trade reported back to him ("4" in the last column). The first 3 trades, not shown here because they end up being reported dead last(!), were dark pool prints from Sigma-X (Goldman's dark pool). The next trade is 67 shares at EDGE (New Bats Edge-A), but they weren't from our trader's order: someone else bought those shares ("X"). How does that happen? Lines 4 and 5 are order cancellations of 100 shares and 600 shares from ARCA and NYSE respectively - all in the same millisecond. Lines 6, 7 and 8 are trade executions from EDGE and belong to our trader - note the first trade (line 3) was also from this exchange but, as noted above, went to someone else. This also means that order cancellations from NYSE and ARCA happened before any size appeared. The next 19 entries (lines 9 to 27) show a flurry of order cancellations coming in from NYSE, ARCA, BATS, NQEX and EDGX. This is before the first trade execution at any of those exchanges. This flurry of cancellations removes 10,300 shares from the number of shares offered (Shares Avail. column drops from 21,400 down to 11,100). Also note how the cancellations rotate through many different exchanges. That's one sure way to throw off, confuse, stall a smart order router. Within 2 milliseconds, half of the shares disappeared, someone stole 67 shares, and our trader has only 13.5% (2,700 shares) of his order filled! Note again, that the massive cancellations take place BEFORE significant size appears. |
 |
Let's chart the changes to the available liquidity, the shares executed, and orders canceled to get another look at this problem. We'll begin with the ideal case shown by the chart on the left.
 |
The number of shares available at $17.38 is shown
by the green line, which starts at 24,800 and decreases from order cancellations and
trade executions (it would increase if additional sell orders were added).
Note the green line is a plot of the Shares Avail. column in the table above.
The cumulative number of shares executed is shown as a blue line. In the ideal case (left chart), the first trade arriving would execute against all the liquidity until the order was complete or liquidity (shares available) became exhausted. The blue line rises in synch with the green line's decline, until 20,000 shares are traded. In the real world (right chart), things are not that simple - even though these charts show just 5 milliseconds (5/1000ths of a second) of time. There is another variable to account for: namely order cancellations. The cumulative number of shares for sale at $17.38 that were canceled is shown by the red line. There is also a fourth variable - trade executions that belong to other traders, but we'll leave that out for now for simplicity sake. The chart on the right clearly shows that order cancellations happen far faster than trade executions (red line goes up faster than blue line). This is why our trader wasn't able to get the advertised liquidity - those sell orders simply disappeared before the exchanges processed his buy order. In fact, more shares are canceled than executed - note the red line ends above the blue line. Also note how much of the activity takes places in about 2 milliseconds (09:47:56.571 to 09:47:56.573). Perhaps this is just an isolated case and the order cancellations happening a fraction of a second before the trader's order were just a coincidence? |
 |
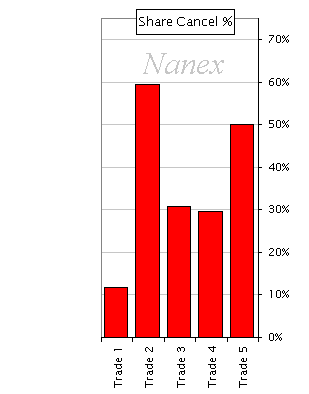
What percentage of shares advertised as available to immediately buy or sell ends up getting canceled? A shockingly high percentage. Keep in mind, on a one exchange market, or in the ideal case in a market with multiple exchanges, the percentage should be zero. The following chart shows the percentage of orders canceled for each of the 5 trade examples we examined in Ford. In the trade detailed above, slightly more than 50% was canceled (it's Trade 5 in the chart below).
If this chart doesn't cause alarm bells to go off, then you might want to re-study the data up to this point.
The Share Cancel% is shockingly high:

The next chart details where the available shares went when our trader's order started executing. It includes the component HFT Shares - which are trades that should have gone to our trader, but were instead stolen by other market participants; namely, HFT machines which only made those trades after reacting to the original order. HFT reacted faster than the original order could be routed to other exchanges and beat our trader to those shares.
In some examples, the number of shares stolen is disturbingly high:
We should note that these observations don't match the marketing materials posted on Goldman's website: none of the 5 examples (or others we looked at) included price improvement and, as we have seen, there was significant market impact.
|
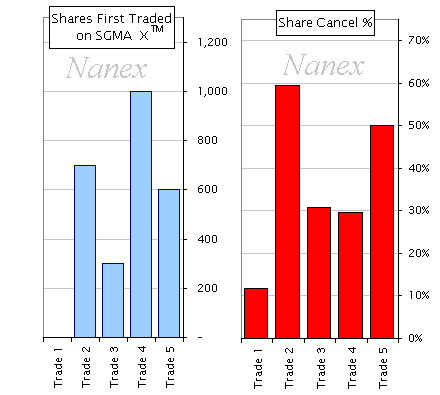
(this section added July 22, 2014) Are trades in a dark pool a signal to a high frequency trader (HFT) to cancel orders on lit exchanges and other markets? In the last 4 of the 5 trade examples presented, the first few order executions reported back to our trader were in Sigma XTM Goldman's dark pool. The last 4 examples resulted in higher cancellation rates than Trade 1 which had zero trades in Sigma X. We also noticed that in the 4 trades with Sigma X executions, the first trades reported back to our trader were always from Sigma X. In other words, Sigma X executions were never reported later in the same bunch of trade reports, it was always first or it didn't appear in the group. That tells us the order router made its first stop in Sigma X, and therefore the first clue anyone would have about Trades 2, 3, 4 and 5 were those executions in Sigma X. To be sure, we are not saying Sigma X leaked information - we are merely stating that a HFT that placed an order on a dark pool will get notification of that execution before anyone else - which may be a good enough reason by itself to place an order there in the first place. Knowing an order executed in the dark allows HFT to better determine if immediate, subsequent trades on lit markets are related, and based on probabilities, immediately cancel all orders on all exchanges before others see the dark pool trade report on the consolidated feed. This brings up an interesting observation: Dark Pools trades are valuable until the moment they show up in the consolidated feed. In 4 of our examples it was a dark pool trade followed by one or two trades on lit exchanges which started the order cancellation process; which means the likely instigator was a HFT on the other side of the dark pool trades. |
 |
Dark pool trades are beneficial to HFT as a signal for potential incoming toxic order size, and that benefit extends until the dark pool trade becomes visible to others. In other words, it is in the HFT's best interest if his dark pool trades show up in the consolidated feed as late as possible.
This leads to another troubling fact: although the dark pool trades executed first and were the first confirmations sent to our trader, they were the last (or close to the last) trades to appear in the consolidated feed. In some cases by 10 milliseconds or more. It probably doesn't help that Sigma X reports trades to the NYSE TRF located 40 miles away in Mahwah, instead of the Nasdaq TRF which is in the same facility in Carteret.
One thing is becoming clear: we may have just found one explanation for our many observations of dark pool trades being reported late.
Here is a chart showing actual latencies (how long it takes for a dark pool to get an acknowledgement from the NYSE TRF after sending a trade report). Note the average is a whopping 7.6 milliseconds, and the maximum is a half a second.
This is premeditated, programmed theft, plain and simple.
Michael Lewis probably said it best when he told 60 minutes that the stock market is rigged.
To the High Frequency Traders (HFT) that make fantastic claims about providing liquidity, perhaps one should ask: "what kind of liquidity"? To the now obvious, ludicrous claim that "everyone's order uses the same tools that HFT uses", we'll just say, the data shows otherwise. To Mary Jo White and other officials who claim the market isn't rigged and that regulators need to look at the data before making any decisions: well, you were able to read this far - if things aren't clear, re-read this expose (or the nearly 3000 other pages we've published), or simply call us and we'll explain it to you. Or dust off Midas and let us show you how to work with market data.
One more note to the SEC in particular - if you believe that the industry can fix these problems on their own, then we believe you are no longer fit to regulate, because that is not, and never was, how Wall Street works. Honestly, a free for all, no–holds–barred environment would be better than the current system of complicated rules which are partially enforced, but only against some participants. And make no mistake, what is shown above is as close to automatic pilfering as one can get. It probably results in a few firms showing spectacular, perfect trading records; it definitely results in people believing the market is unfair and corrupt.
And to CNBC and other financial media companies who say these problems have all been fixed - you may have been lied to. Probably by the ones doing the market rigging. A certain HFT lobbyist group immediately comes to mind - the one that presents the same tired "liquidity, spreads, costs" argument, without data to back it up. This paper shows that the liquidity claim is clearly a lie.
Academics interested in continuing the study shown on this page - we believe we know how you can find and quantify these events. Serious inquiries only please.
Note that none of this would be possible if the direct feeds weren't illegally supplying HFT with faster information than the SIP. The SIP was created to tie the liquidity together from multiple exchanges - not to split up liquidity and allow HFT to get in the middle of market orders.
The next day, the trader who sent us trade data used in our analysis, switched over to using IEX's router, and on July 17, 2014 made 33 trades with an average size of 20,000 shares each in the same stock (Ford). The results were nothing short of spectacular. We present the results of one of these trades from the IEX router (far right) compared to the ideal (left) and the example discussed above (middle). Note that most of the executions took place on lit exchanges.