Nanex Research

Nanex ~ 11-Aug-2014 ~ Citadel's Rogue Algos
and FINRA's lethargic response
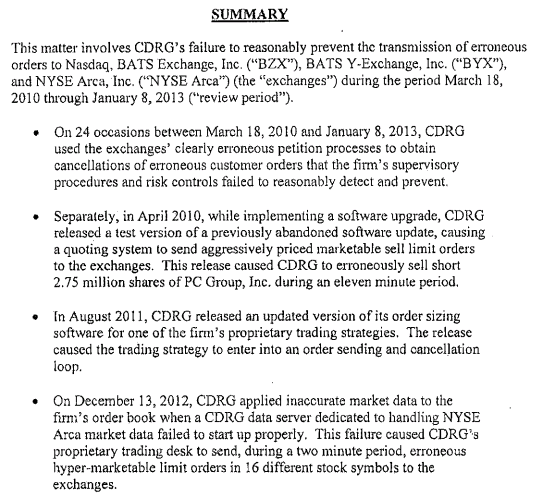
On June 16, 2014, FINRA posted a
letter Letter of Acceptance, Waiver, and Consent from Citadel for 4 separate
issues (CDRG
is Cidatel Securities, LLC):
Note: Themis Trading
posted a blog on this subject.
Issue 1
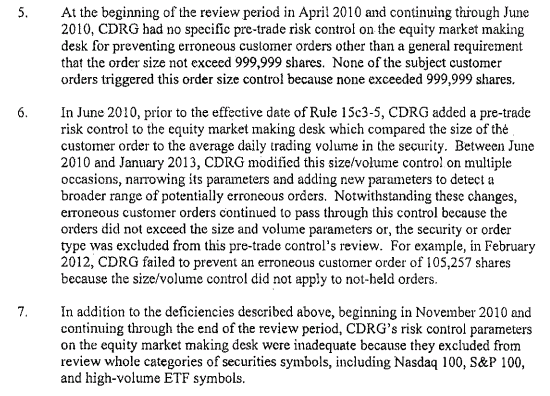
The first issue may account for 24 mini flash crashes in individual stocks
between March 18, 2010 and January 8, 2013. Unfortunately, FINRA doesn't provide any
more details
that what is shown below, so we don't know which, if any, match what we have
previously
documented. However, the fact that Citadel's only apparent pre-trade risk control
was checking if the order size was under 999,999 shares is, well, shocking! Note that
this weak risk control would have been in place during the Flash Crash.
Issue 2
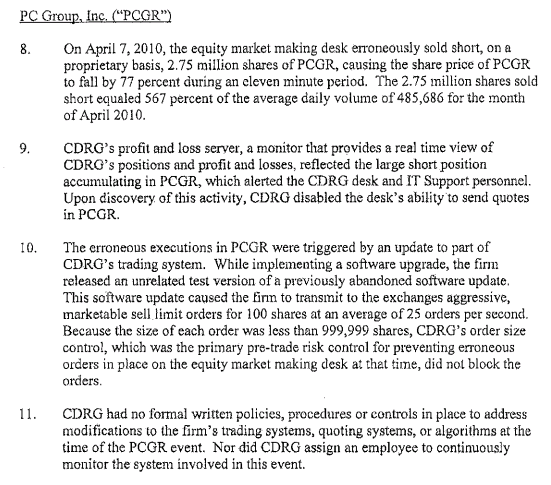
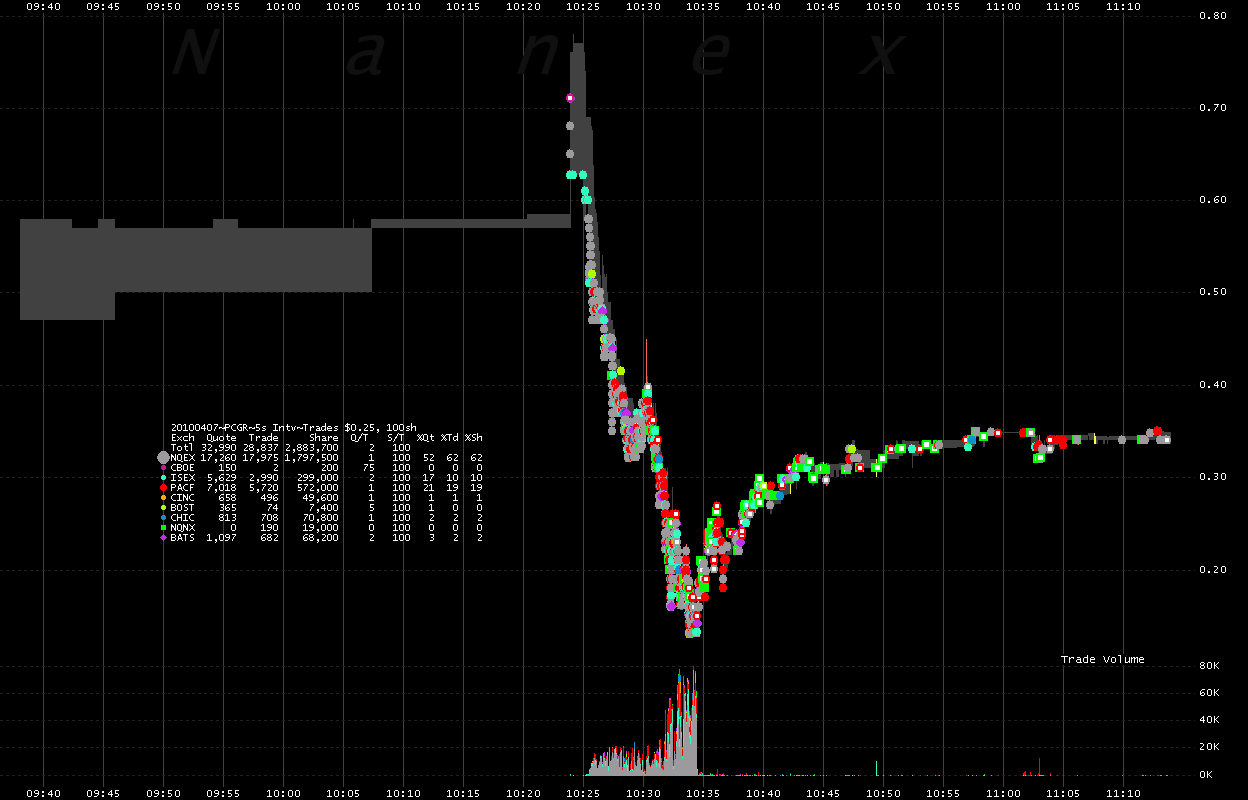
The second issue involves Citadel selling short 2.75 million shares of PC Group (PCGR),
driving the price down 77% (we measure 82%) in just eleven minutes:
Two days after the event, on April 9, 2010, the victim (PC Group, Inc, symbol PCGR)
issued a press release (below) regarding the unusual trading activity.
Three items stand out.
- Why didn't Citadel contact the company immediately and tell them about the mistake?
The company still had no idea what happened to its stock 2 days after the event.
- How can Citadel sell short 2.75 million out of 7.85 million total shares outstanding? According to the
10-K filed by the company on March 18, 2010, the executives were beneficial owners of 3.1 million shares and there were 1.1 million shares of restricted stock:
these two items removed 4.2 million shares from the float, leaving less than 3.75
million available for trading. In the same 10-K, which was filed a few weeks before the event, the company warned investors that its stock price may be
volatile because it had a thin float (not many shares were available for trading). How was Citadel
able to obtain 2.75 million shares of PCGR to sell short?
- FINRA compares the volume shorted by Citadel to the average daily volume of the
stock in the month of April, stated to be 485,686 shares per day. But FINRA is including
the
day in question! According to the company press release, the actual average
shares traded per day was 42 times smaller: "the average daily trading volume was
approximately 11,600 shares". Was this an effort to downplay the enormity of this
event? FINRA should have wrote "The 2.75 million shares sold short equaled 23,707%
of the average daily volume".

The following charts show how Citadel's algo shorted the stock price into the ground.
We can only wonder what caused it to stop.
Note, this event was less than 1 month before the infamous May 6,
2010 flash crash. According to FINRA documents, this algo would have still been
in place.
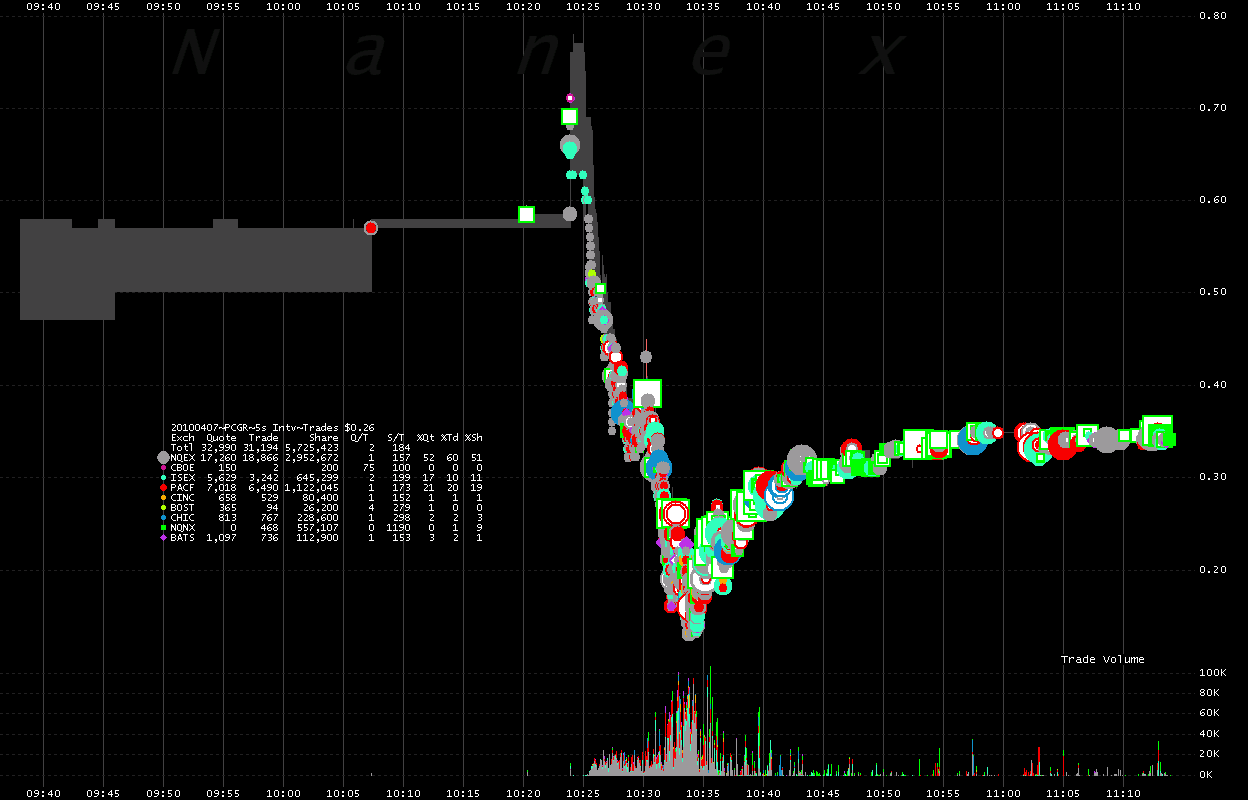
2.1. PCGR - Trades color coded by reporting exchange and NBBO (gray shading).
On April 7, 2010, at 10:07:23, the stock opened at $0.57. The sudden activity and drop in price was from
Citadel's rogue algo, which took the stock from $0.71 to $0.13, losing 82% of it's value
(FINRA says 77%),
in just under 10 minutes.
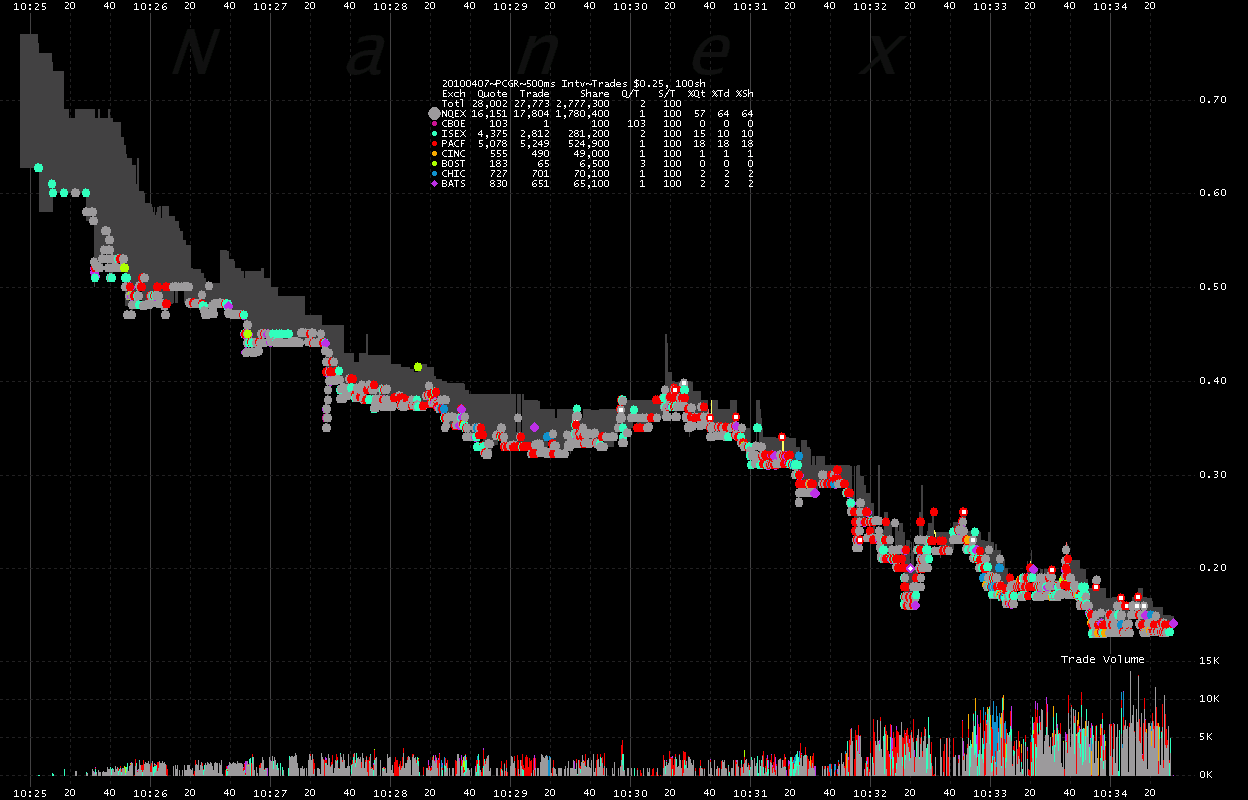
2.2. Same chart as above, but only showing 100-share trades.
You can see the trade rate accelerate in the last 3 minutes before Citadel shuts it
off.
2.3. Close up of Chart 2.2, showing only 100-share trades. Chart shows 27,773 trades
(2,777,300 shares).
We know Citadel shorted 2.75 million shares, and inspection of short sales data from
exchanges indicates the vast majority also had a size of exactly 100 shares: which means 99% of the trades
shown below are most likely to be Citadel short sales. Note the algo selling rate increases as the price drops.
Issue 3
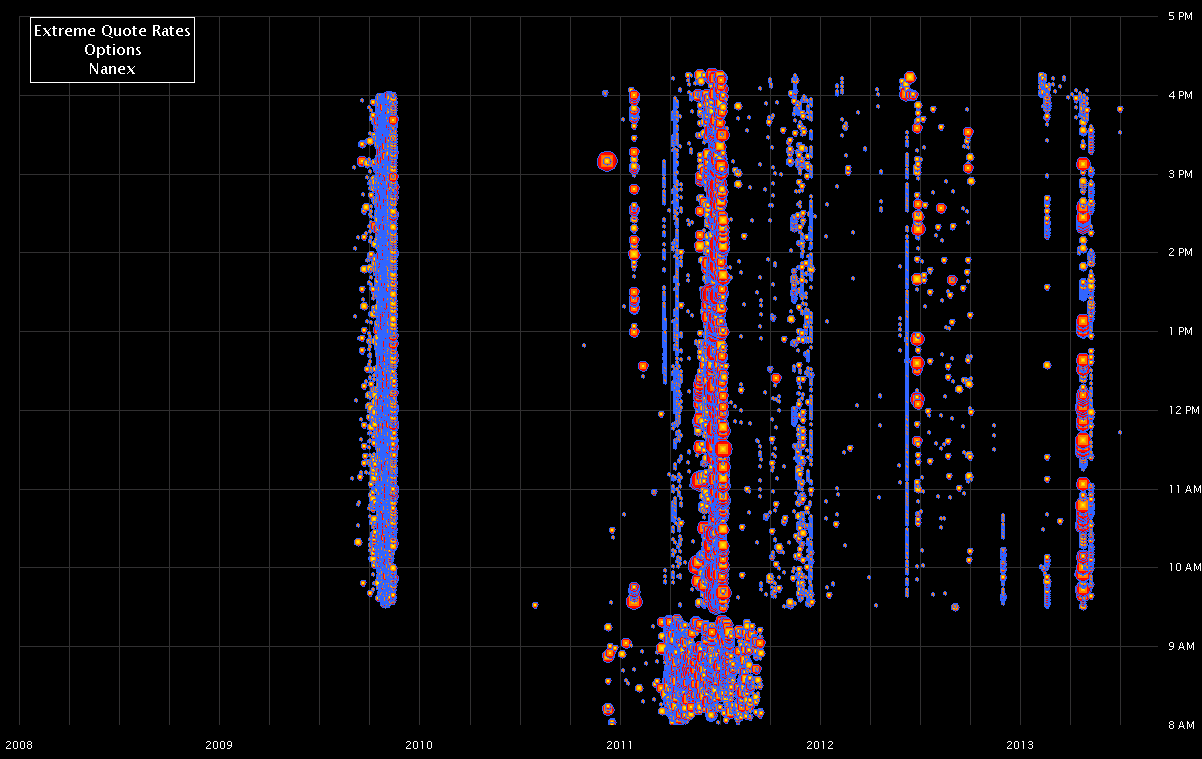
The third issue involves high quote rates in individual option contracts, but unfortunately,
FINRA doesn't provide enough details for us to know which
extreme option quoting events are from Citadel. This is especially disturbing because instances of high quote rates in options are common: every bubble
in the chart below marks a similar, if not more extreme example than what FINRA fined
Citadel for. Why didn't the hundreds of thousands
of similar (or worse) instances of extreme rates of order placing/canceling also result
in fines?
3.1. Extreme quote rates in individual option contracts. See also
Extreme Options.
Issue 4
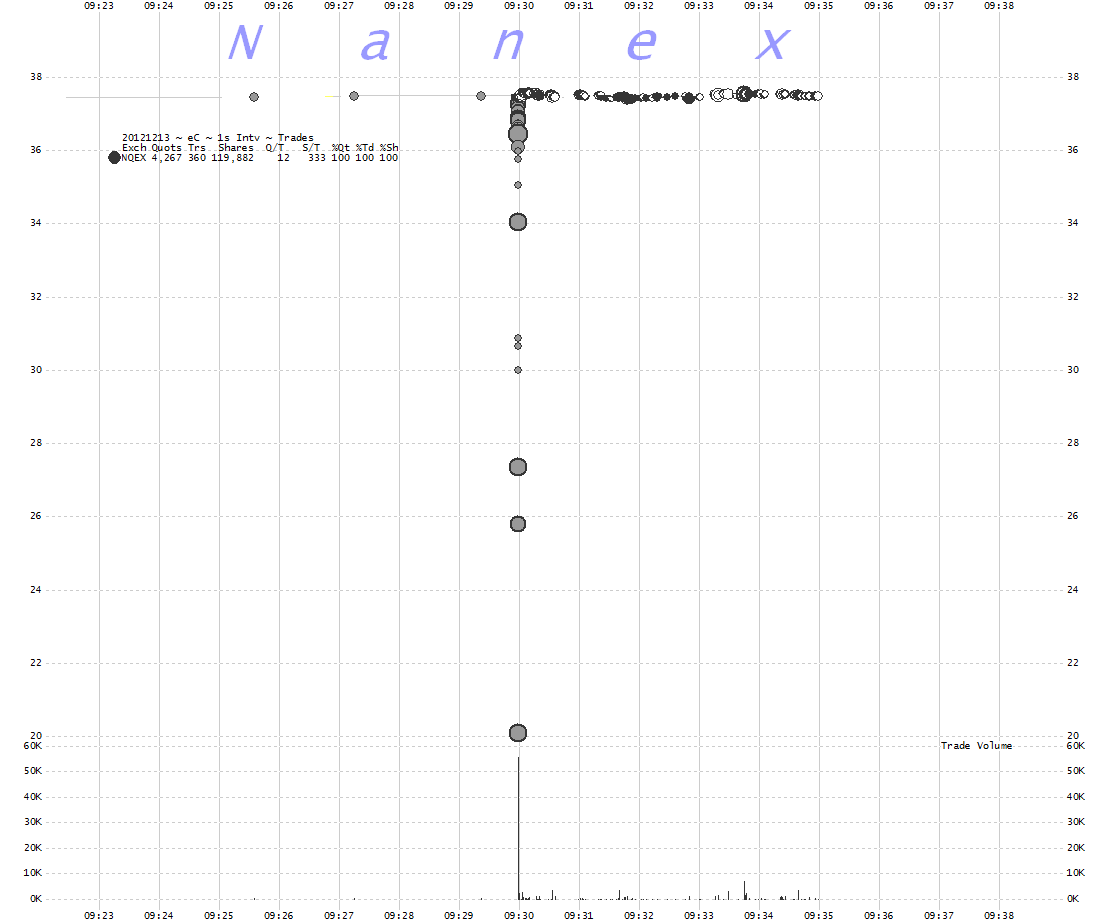
The last issue involved at least 16 mini flash crashes in individual stocks on December
13, 2012: just 4 months after the Knight Capital meltdown. We
detected and published this paper
on the same day of the
event.
Below is one example. Why did it take FNRA over 2.5 years
from when the event occurred? We've been detecting these in real-time for years.
4.1. Citigroup drops from over $37 to about $20 just before market open.
Nanex Research
Inquiries: pr@nanex.net


