Nanex Research

Nanex ~ 19-Sep-2014 ~ BABA IPO
On September 19, 2014 the stock of Alibaba (Symbol BABA) began trading. Here are some
highlights.
1. NYSE opening indications for BABA
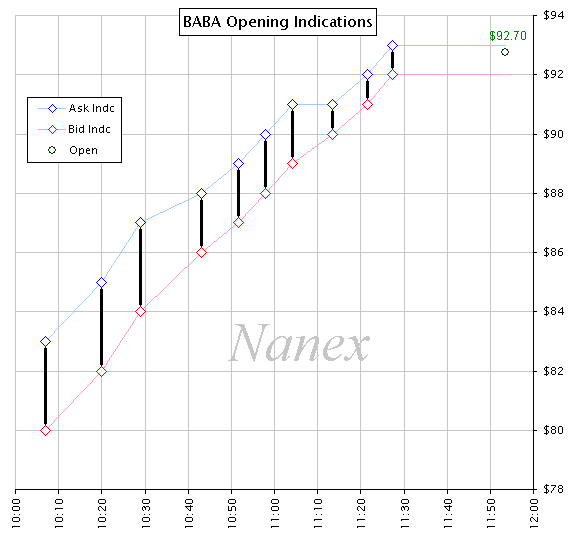
The NYSE provided excellent feedback with regular Open
Indication Quote updates. Opening indications began at 10:06:51 with a price that would become
the low point, $80, and regularly increased
to the opening price of $92.70 at 11:53:17.
2. BABA Opening trades were very stable from NYSE, extremely unstable from Nasdaq
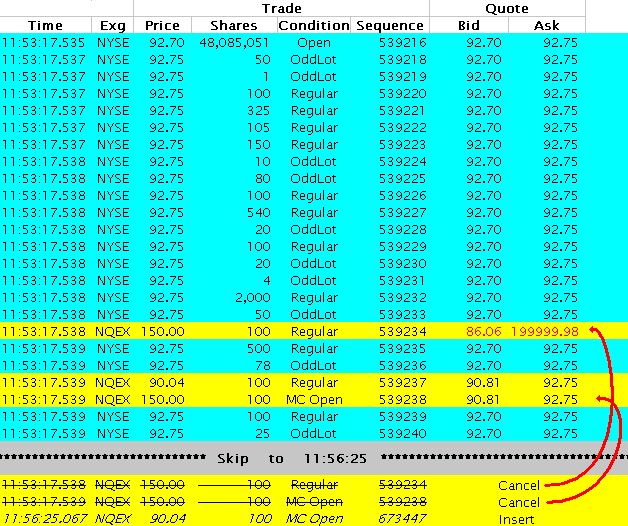
- The upper band of the Limit Up/Limit Down Circuit breaker (LULD) was $101.97, and
the lower band was $83.43.
- NYSE's opening print (from the opening auction) was just over 48 million shares
at a price of $92.70.
- Nasdaq's quote was bid $86.06 and offer
$199999.98! This wide spread indicated there was practically zero liquidity
for BABA at the Nasdaq exchange.
- Nasdaq's first trade came 3 milliseconds (thousandths of a second) after the NYSE open and was for 100 shares at
$150 (yellow): ridiculously higher than both NYSE (62%) and LULD upper band (47%), and should have halted the stock.
- Nasdaq's second trade came 1 millisecond
later and was for 100 shares at $90.04 which
was significantly below (3%) NYSE prices.
- Nasdaq's 3rd print indicated that their first trade of
$150 was the Official Market Center Open for Nasdaq!
- At 11:56:25, about 3 minutes later, Nasdaq canceled the two $150 prints (the trade
and the Official Market Center Open).
- Nasdaq then sent a trade record indicating that their second trade at $90.04 was
now considered the Official Market Center Open for Nasdaq - even though it was 3%
lower than other prices at the time.
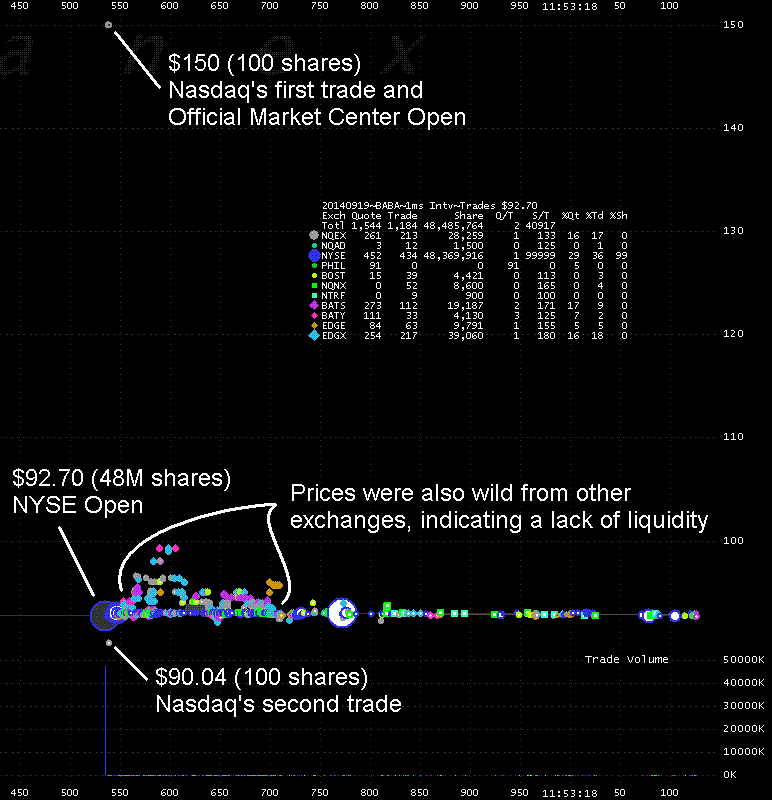
3. Chart of first 1/2 second of trading
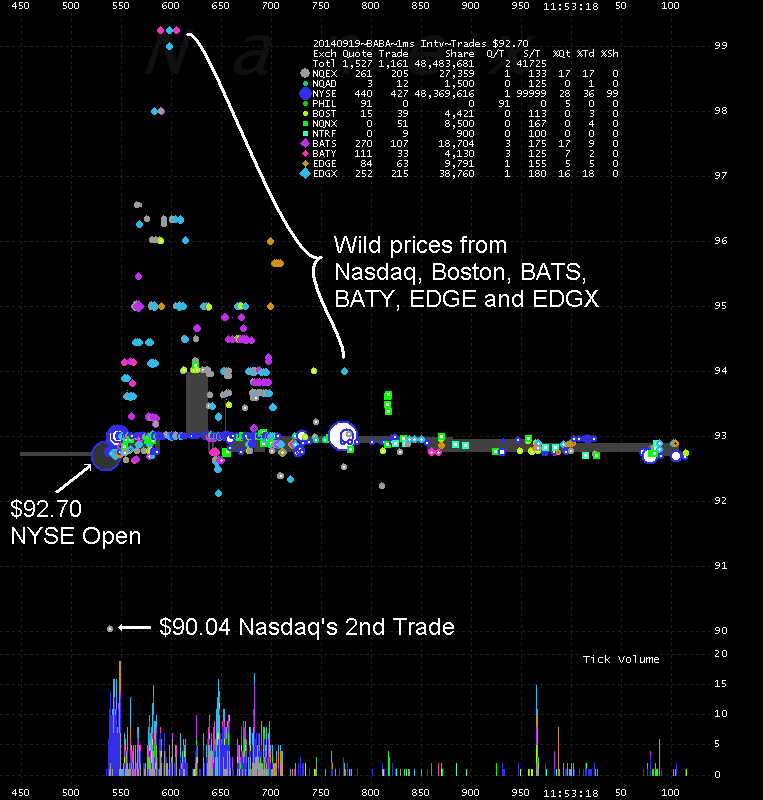
4. Zooming in on Chart 3 shows the wild sloppy trading from 6 other exchanges
- Trading prices were stable from the NYSE, FINRA TRF (Lava flow) and the 2 trade
reporting facilities which print dark pool trades.
- Trading was at unstable, wild prices from Nasdaq, Boston and all 4 BATS exchanges
(BATS,BATY,EDGE,EDGX).
- There were no trades during this 1/2 second from NY-ARCA, Phil or Chicago.
5. BABA was king of trading activity
During the first 10 minutes, BABA was often more than 50% of all NMS symbols (about
8,000) traded.
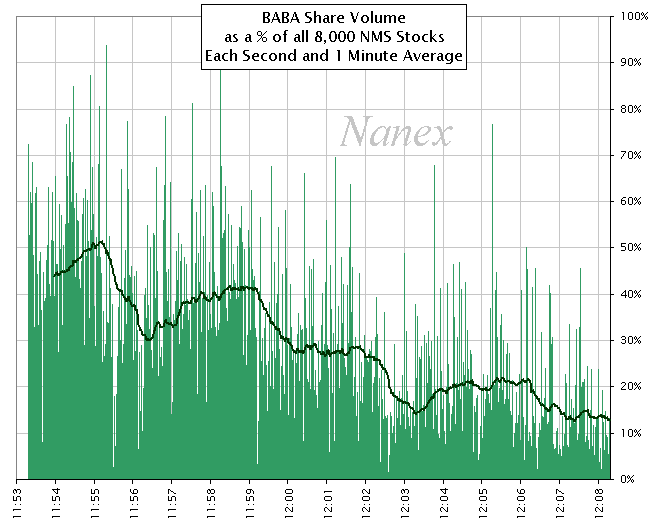
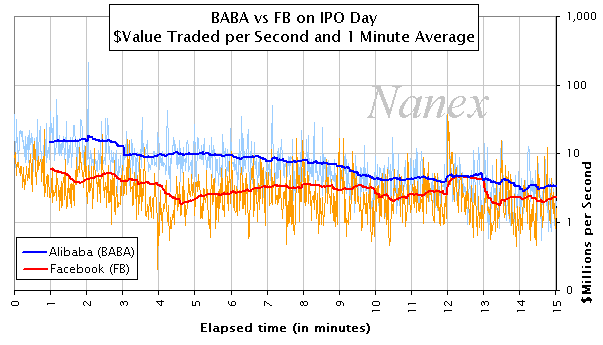
6. During the first 15 minutes, Alibaba consistently traded more by dollar volume than Facebook on its IPO day
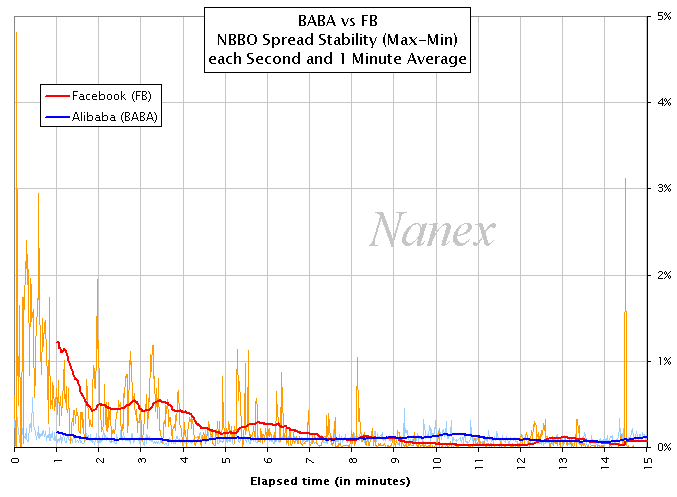
7. Alibaba's price was significantly more stable than Facebook on its IPO day
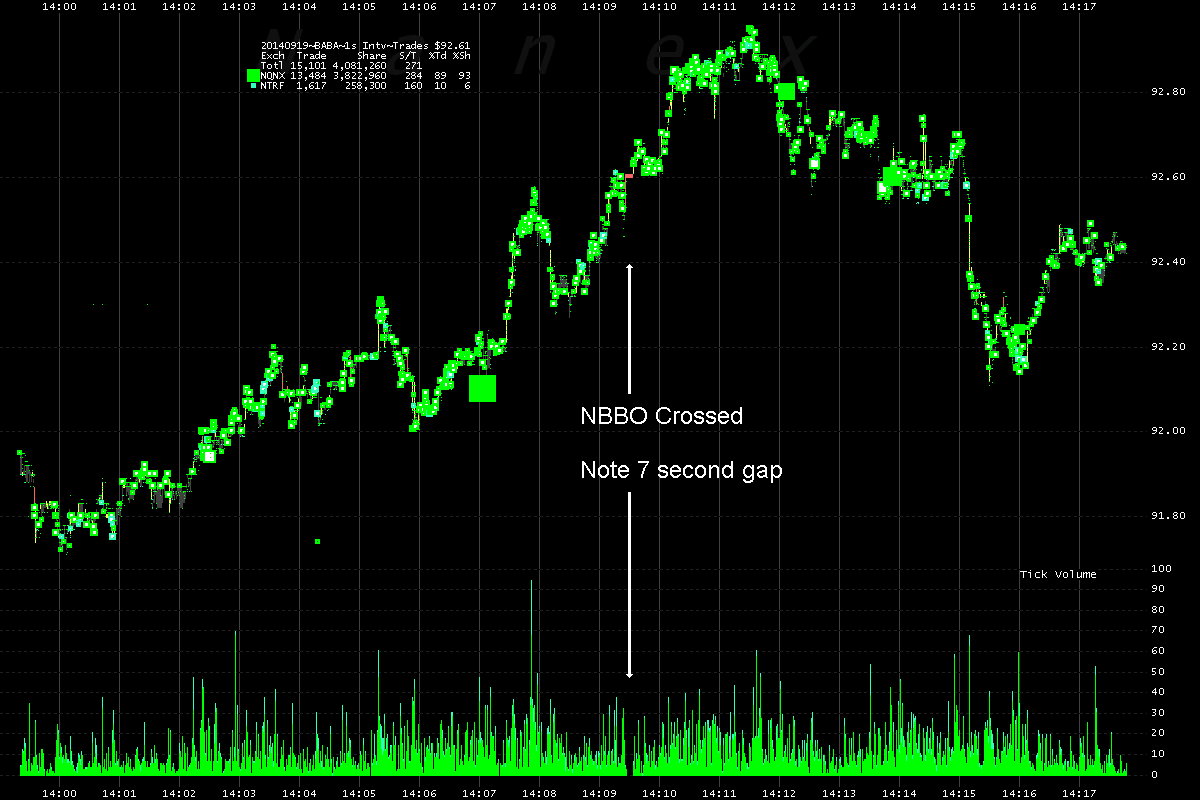
8. Later in the afternoon, a cross in the NBBO developed and persisted for 7 seconds, shutting down trading
from Retail and Dark Pools
A crossed NBBO is a condition where the Best Bid price exceeds the Best Ask price. This
often results in the halting of trading
from Internalizers (which process retail trades)
and Dark Pools because they rely on accurate prices and a crossed NBBO is usually the
result of a system glitch or overload (such as during the flash crash).
During the cross
(red shading below), we found no trades from trade reporting facilities: where Dark
Pools and Internalizers disseminate their trades.
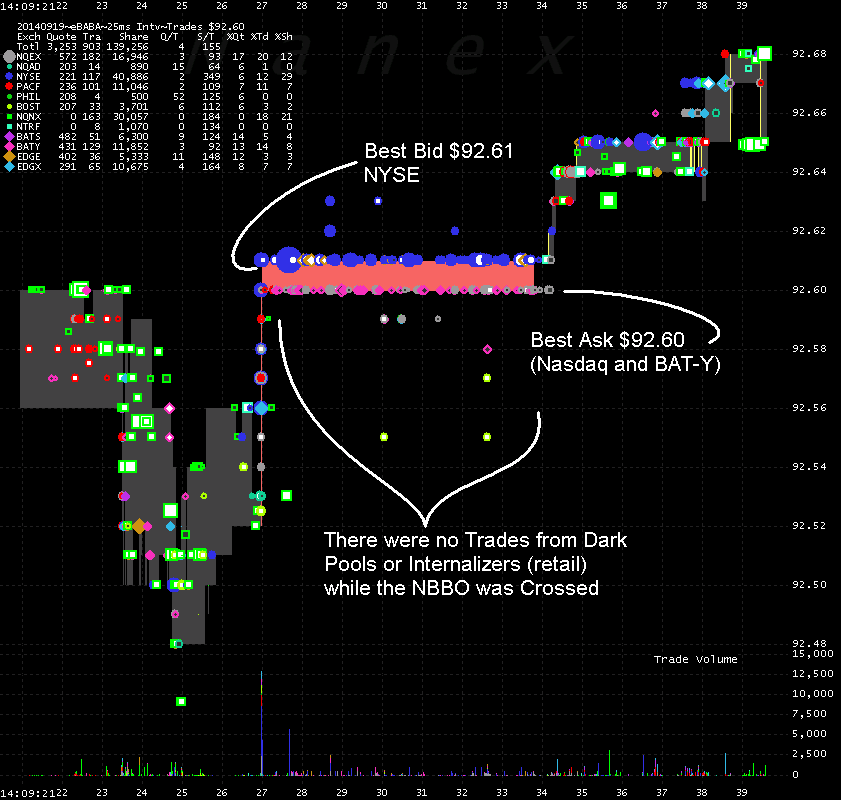
8b. Trades from Dark Pools and Internalizers over 17 minute period. Note the
gap in trade reports when NBBO was crossed.
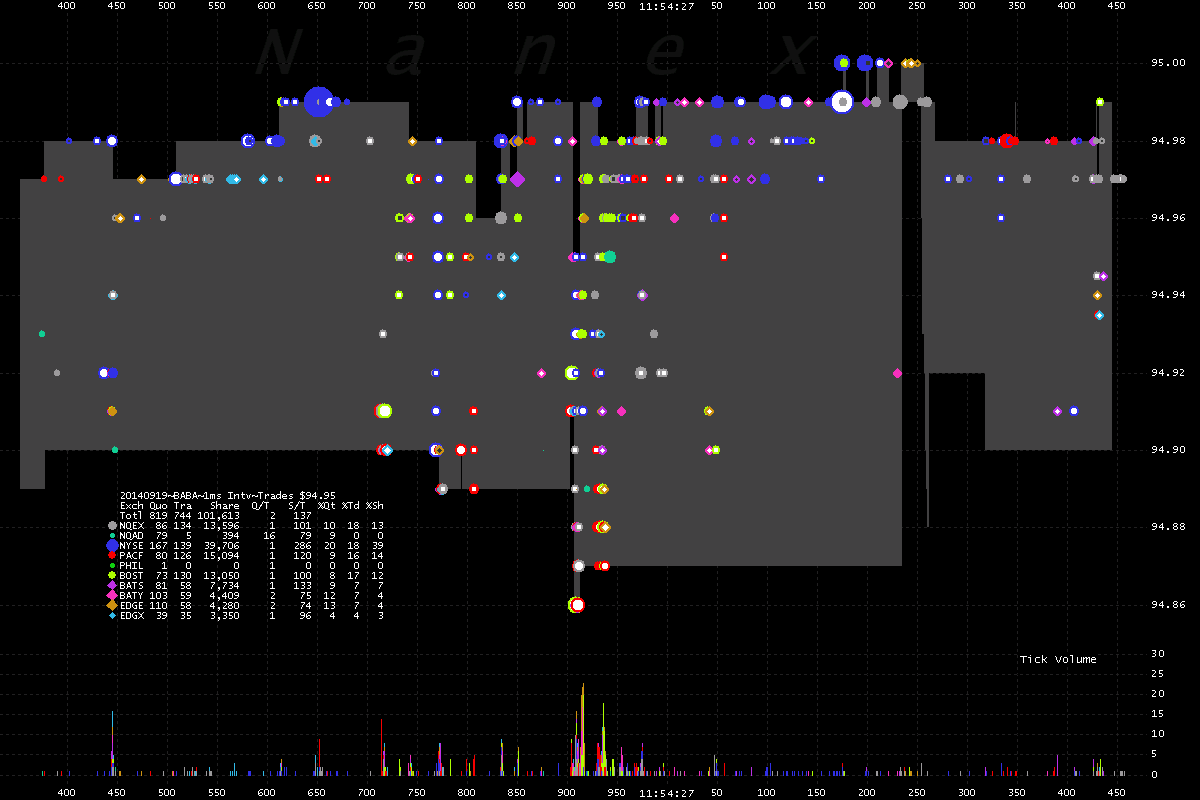
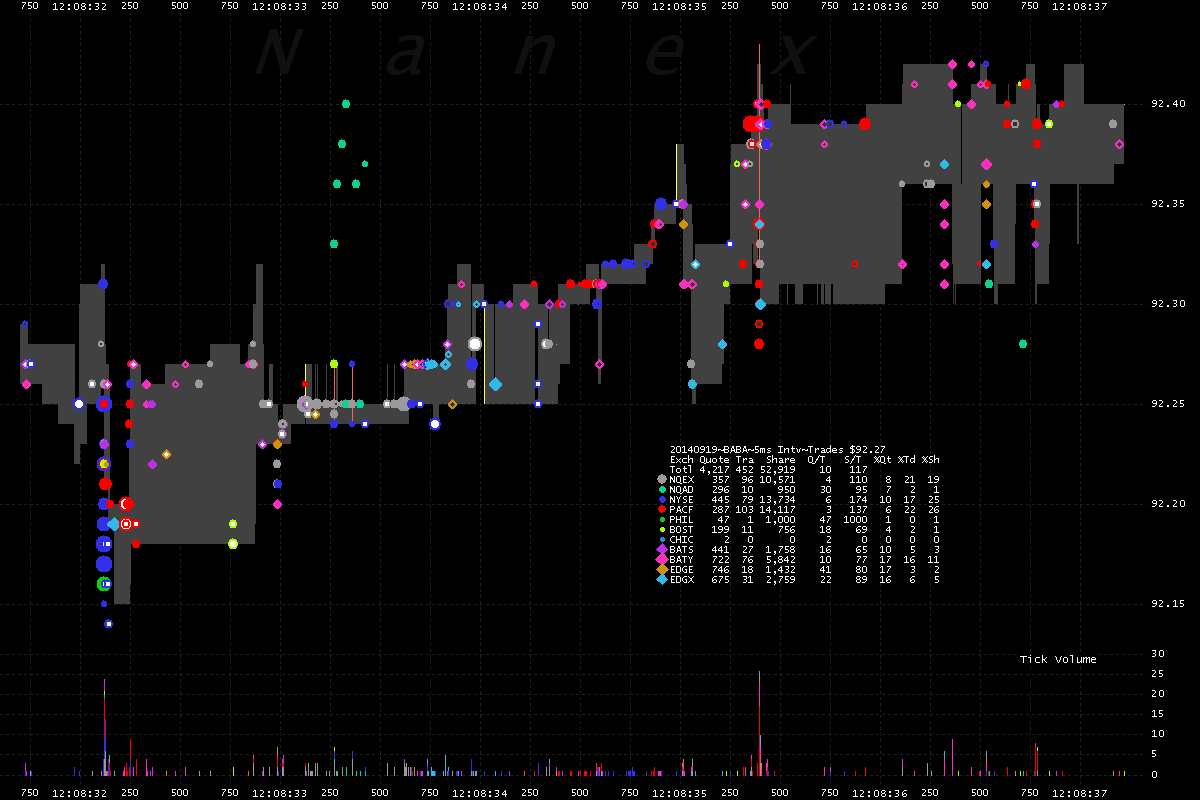
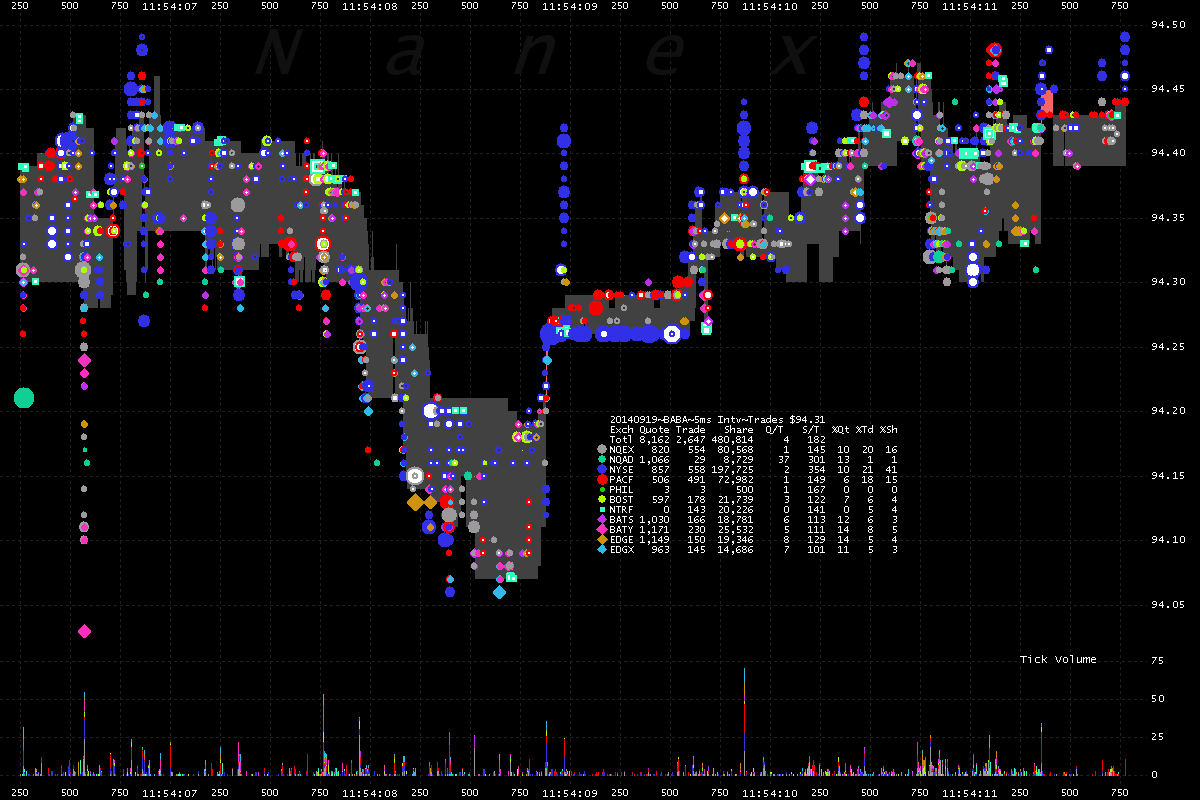
9. Close-ups of sloppy pricing caused by high frequency trading (HFT) machines
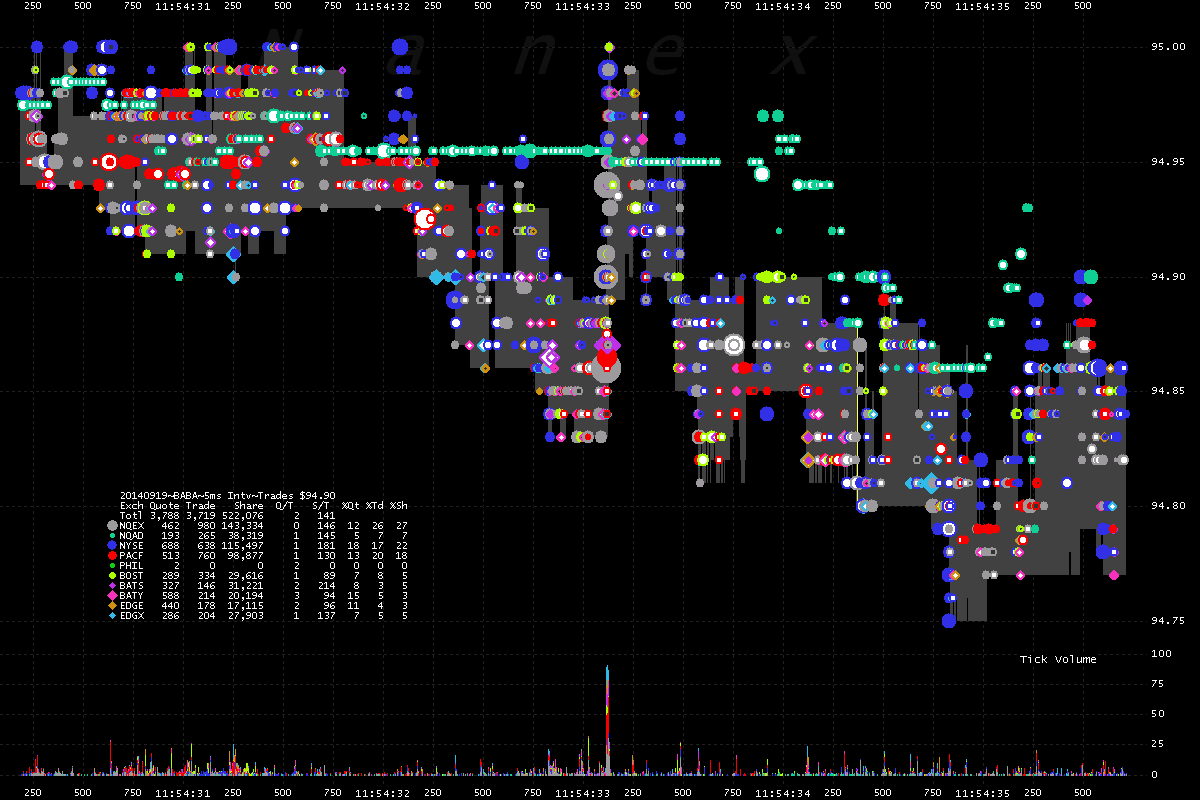
Dark Pool trades are excluded for clarity. NBBO is shaded light gray (top of shading
is best ask, bottom
is best bid). Trades are shown as dots, color coded by reporting exchange.
9a. Chart shows 1 second of time!
9b. Chart shows 5 seconds of time. Madness! Note the string of light green -
FINRA's ADF is running behind.
9c. Waves of buying just miss waves of selling.
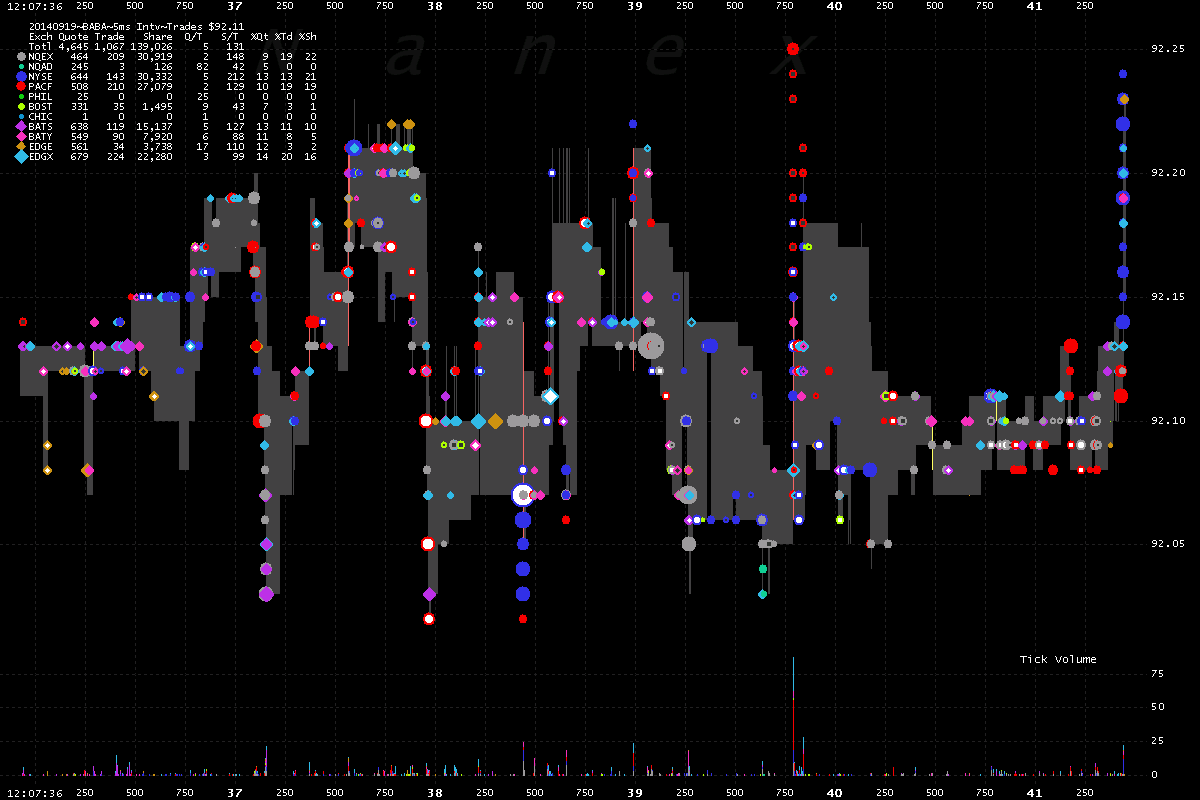
9d. More of the same.
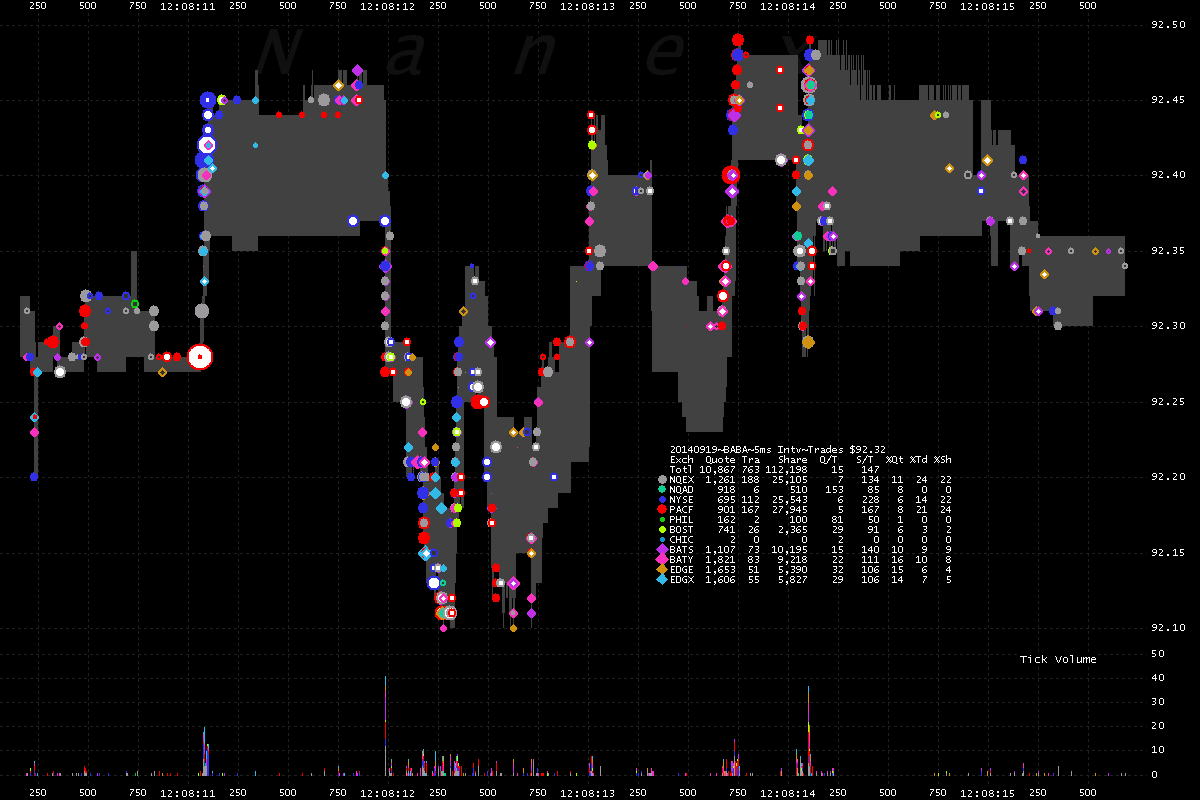
9e. Those light green trades are trade-throughs: someone should have received
much better prices.
9f. These patterns are quite common and imperceptible to those watching a quote
screen.
10. Step through 25 more examples. Each chart is about 5 seconds of time.
Nanex Research
Inquiries: pr@nanex.net


