HFT Breaks Speed-of-Light Barrier, Sets Trading Speed World Record.
Adds a new unit of time measurement to the lexicon: fantasecond.
|
On September 15, 2011, beginning at 12:48:54.600, there was a time warp in the trading of Yahoo! (YHOO) stock.
HFT has reached speeds faster than the
speed-of-light, allowing time travel into the future. Up to 190
milliseconds into the future, or 0.19 fantaseconds
is the record so far. It all happened in just over one second of trading, the evidence buried under an avalanche of about
19,000 quotes and 3,000 individual trade executions. The facts of the matter are indisputable. Based on official UQDF/UTDF exchange
timestamps, there is unmistakable proof that YHOO trades were executed on quotes that didn't exist until 190
milliseconds later!
Millions of traders depend on the accuracy of exchange timestamps -- especially after bad timestamps were found to be a
key factor in
the disastrous market crash known as the
flash crash of May 2010. We are confident the exchange timestamp problem has been completely addressed by now: the SEC would
have made sure of it. Adding accurate timestamps is not exactly rocket science; it's not even considered to be a difficult problem. Based on recent
marketing materials, the exchanges are practically experts on measuring time.
And with hundreds of millions in annual data feed subscriptions
paid by the same subscribers expecting quotes with accurate timestamps, there is no shortage of funds to make it happen.
So we can be certain the exchange timestamps were accurate, which means that HFT has truly entered the era of the fantasecond.
***
But let us suppose for a moment that the timestamps were not accurate, and in reality
quotes were queued, and therefore delayed, and not
timestamped until leaving the queue.
So we checked for the
usual capacity problems which have led to one of the types of
feed delays that we have exposed before
and couldn't find any. For example, detailed analysis of the
UQDF data feed that transmits this information
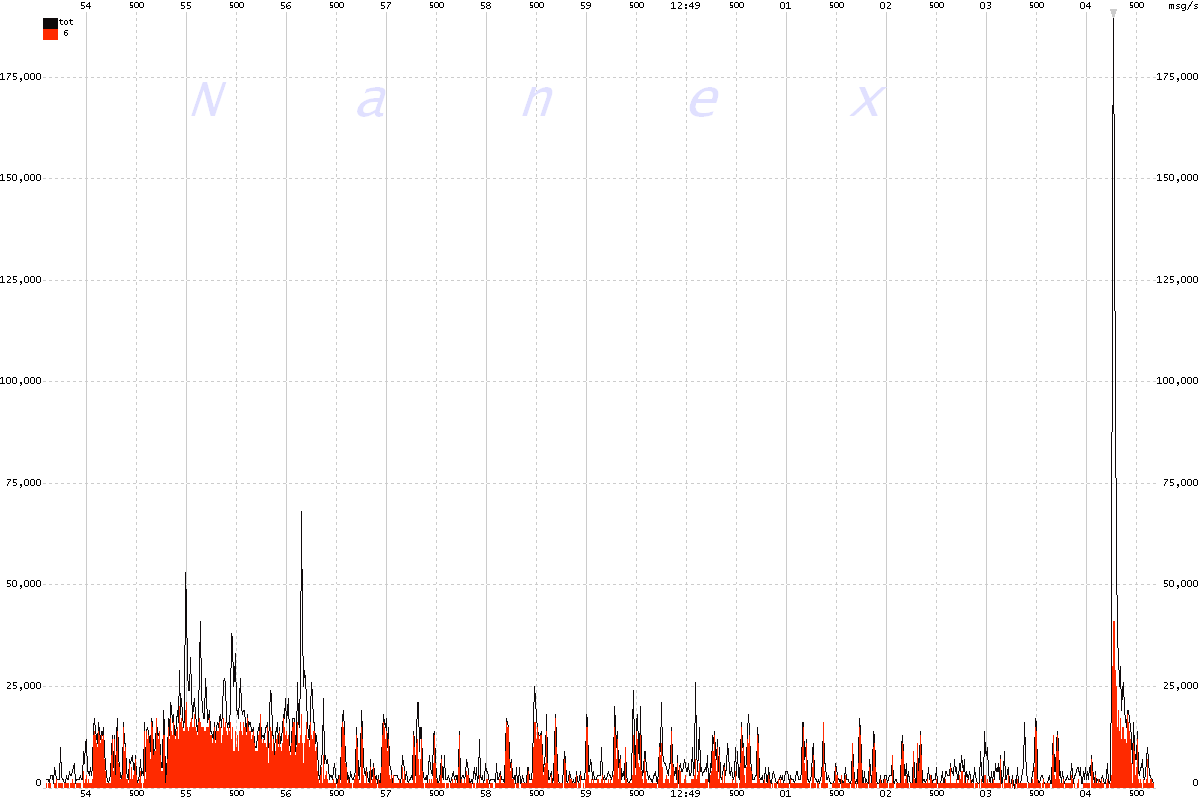
to traders shows that the
traffic rate for all output lines and specifically multicast line #6
which carries YHOO, were well below peak rates.
This raises a few thorny questions.
Does this mean there are far more delays than previously thought? Is there a delay every time we see an explosion of quotes in
one stock? Because recently,
that, sort,
of thing, happens,
all the time.
Regulation NMS (Reg. NMS) makes it clear that direct exchange feeds are prohibited from having a speed advantage
over the UQDF data feed. The reason is primarily because UQDF computes
the NBBO,
which is the key component of Reg. NMS that assures investors they are getting the best price when buying or selling stocks. This assurance is called trade-though
price protection.
How does one ensure trade-through price protection if the price being protected hasn't even occurred yet?
Maybe it would be better to just fantasize about fantaseconds after all.
|
|
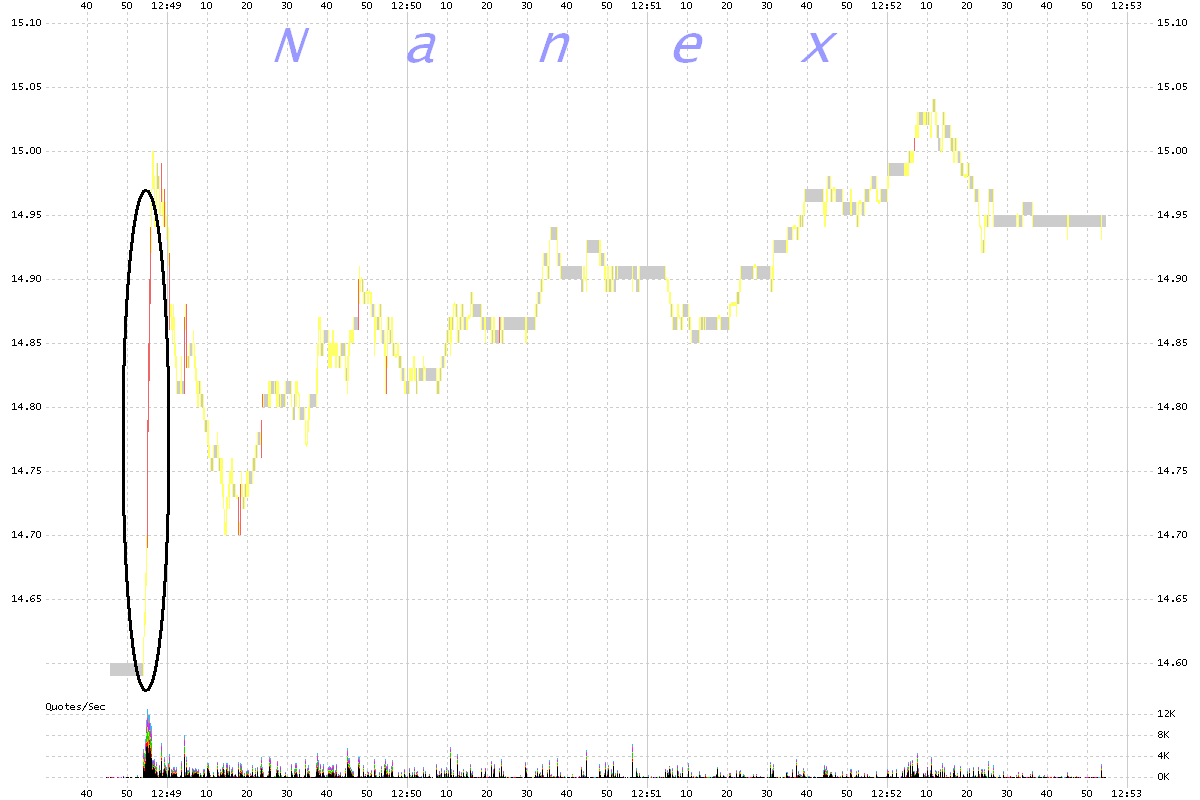
The first chart is a 250 ms interval chart of the NBBO in YHOO which is plotted as vertical
lines and colored red if the NBBO was crossed during the interval, yellow if it was
locked, and gray if it was normal. The implied quote rate is shown as a histogram
at the bottom and scaled in quotes/second. We will focus on the time shown in the black circle.
|
|
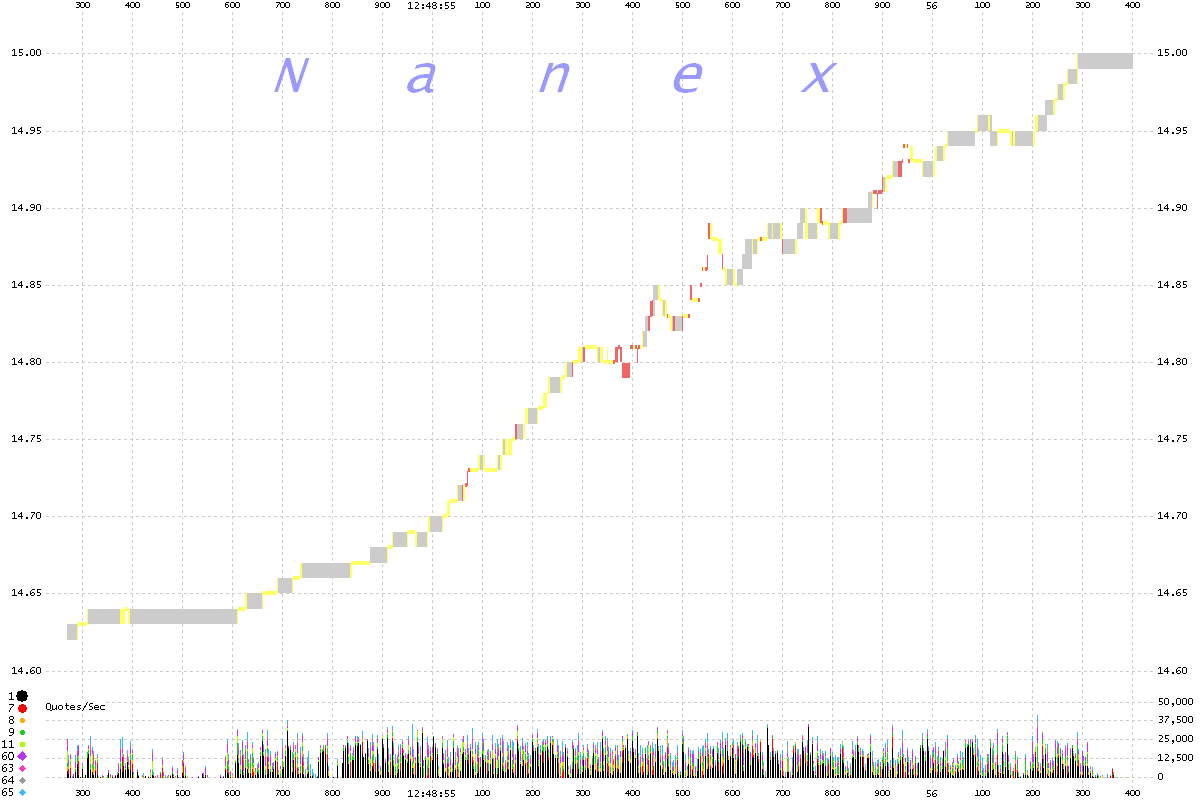
Zoomed in detail of above chart in 2 millisecond intervals. Note that this chart
shows just 2.1 seconds of time. |
|
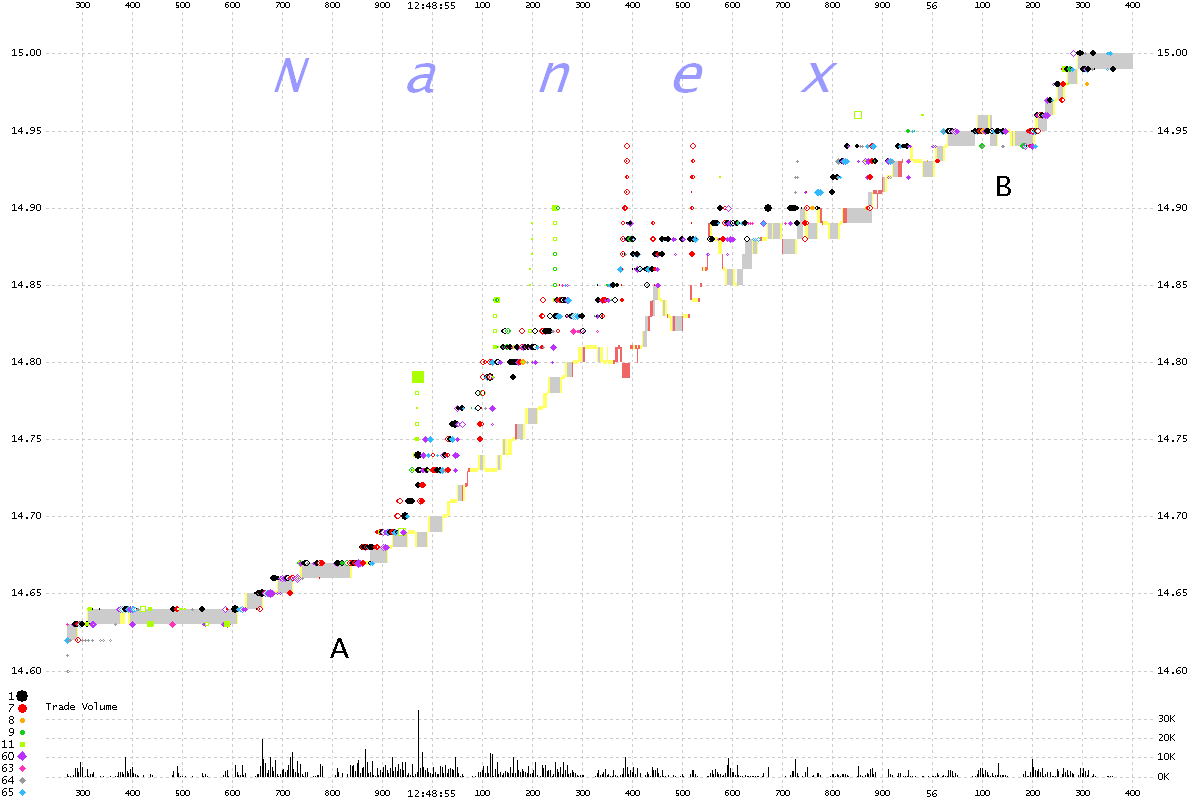
The next chart includes trade executions which are plotted as dots or squares and sized according to trade size. A unique color and shape is assigned to each
reporting exchange. What is unusual about this chart is that trades are reported ahead
of quotes. The trades (dots and squares) should trail after the quotes (vertical bars). Up to
the point in time that is labeled A, and after the point labeled
B, trades and quotes were in sync. Between these two points,
quote timestamps began falling behind. |
|
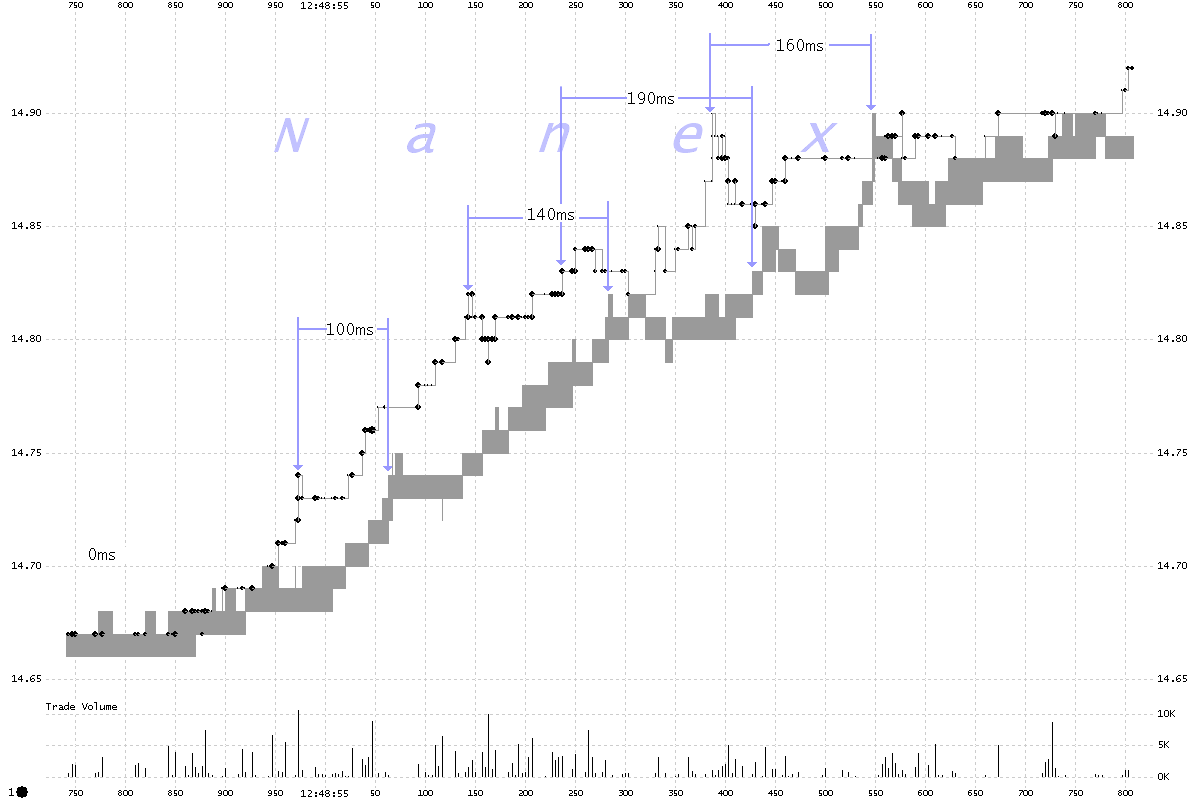
By plotting quotes and trades from just one of the active exchanges, we can easily measure how far in time the trade messages came before
the quotes and therefore estimate the minimum amount of time the quotes were delayed.
Below is a 1 millisecond interval
chart of YHOO showing only Nasdaq trades (black circles) and the Nasdaq bid-ask spread
(gray vertical bars). Note that this chart shows just over 1 second of time. |
Exchange Code Legend:
| 1 |
NQEX |
Nasdaq Exchange |
| 7 |
PACF |
NYSE/ARCA |
| 8 |
CINC |
National Stock Exchange |
| 9 |
PHIL |
Philidelphia Stock Exchange |
| 11 |
BOST |
Boston Stock Exchange |
| 60 |
BATS |
BATS Trading |
| 63 |
BATY |
BATS Y Exchange |
| 64 |
EDGE |
Direct Edge A |
| 65 |
EDGX |
Direct Edge X |
|
The chart below shows quote message rates for UQDF and multicast line #6 which is
the line that carries YHOO quotes. The time of the event is shown at the lower left.
Although traffic from YHOO was a significant percentage of all traffic on UQDF, it
was not high enough to indicate any problems. Note the much higher surge on the right
side of the chart; there weren't any known problems at that time
in YHOO.
|
|
Inquiries: pr@nanex.net
Publication Date: 09/20/2011
http://www.nanex.net
| This report and all material shown on this
website is published by Nanex, LLC and may not be reproduced, disseminated, or
distributed, in part or in whole, by any means, outside of the recipient's
organization without express written authorization from Nanex. It is a
violation of federal copyright law to reproduce all or part of this publication
or its contents by any means. This material does not constitute a solicitation
for the purchase or sale of any securities or investments. The opinions
expressed herein are based on publicly available information and are considered
reliable. However, Nanex makes NO WARRANTIES OR REPRESENTATIONS OF ANY SORT
with respect to this report. Any person using this material does so solely at
their own risk and Nanex and/or its employees shall be under no liability
whatsoever in any respect thereof. |
|
|
|


