More Nanex Research

Did the Disruptor
shell-shock the S&P 500 electronic futures on February 28, 2012 at 10am?
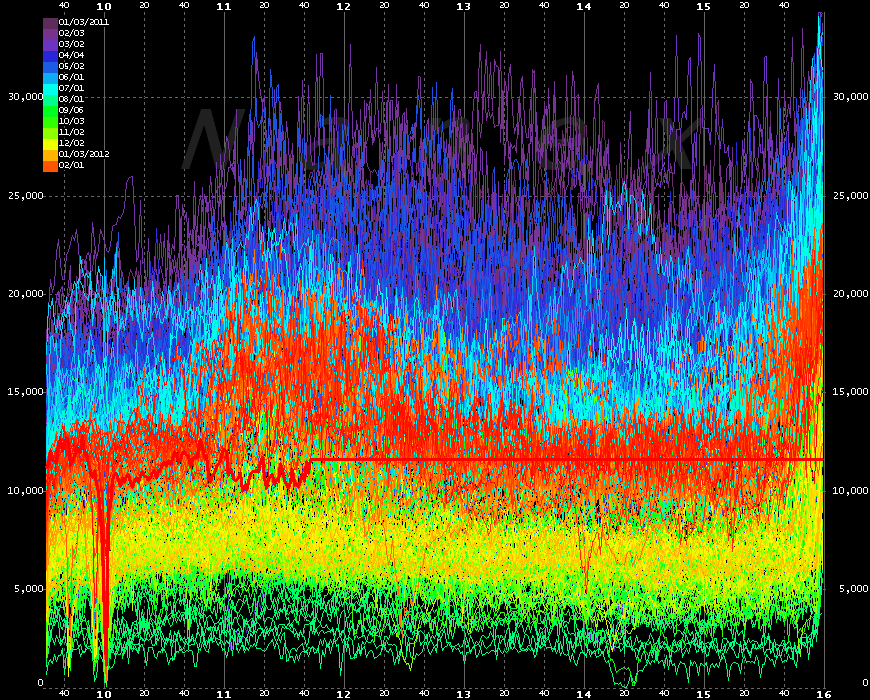
The chart below shows the minimum of the sum of all
10 depth of book bid and ask
sizes over each minute of the trading day. This is an excellent measure of liquidity
in the emini. The red line near the middle is Tuesday, Feb 28, 2012. Note how it's
noticeably lower compared to other recent trading days (red). The spike down at 10am
was from a disruptor event that coincided with the release of the Consumer Confidence
number.
See related charts showing quote spread disintigration during
the same disruptor event.


