


| NBBO Spread ~ Lower values indicate
tighter spreads. The chart on the left shows the percentage of stocks with quote spreads during each second between 9:30 and 10:30 Eastern. The percentage of stocks with a quote spread greater than or equal to 2 cents are colored dark purple, while stocks with quote spreads greater than or equal to 25 cents are colored red. |
NBBO Stability ~ Lower values
indicate higher stability. The chart on the right shows the percentage of stocks that had quote spread changes during each second between 9:30 and 10:30 Eastern. The percentage of stocks with spread variance greater than or equal to 1 cent are colored dark purple while those with spread variance greater than or equal to 25 cents are colored red. |
|
|
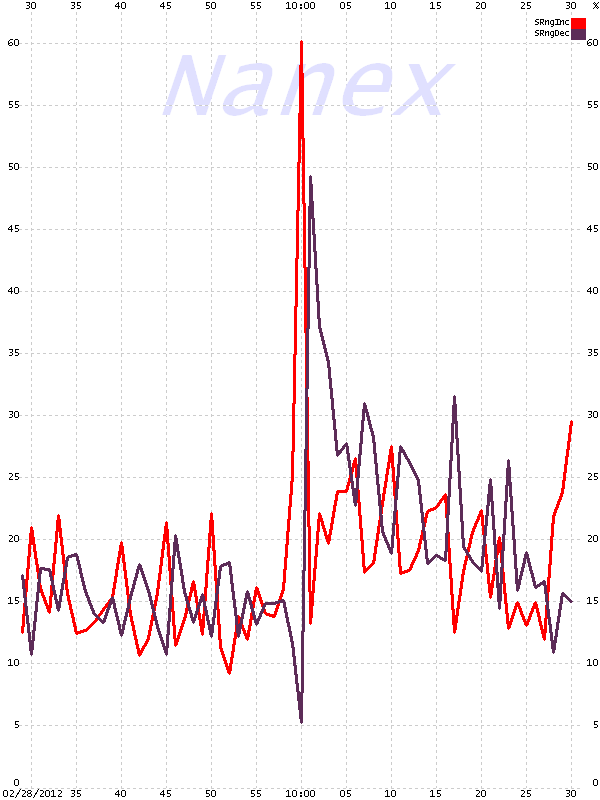
| NBBO Spread Changes The chart on the left shows the percentage of stocks with increasing (red) and decreasing (black) quote spreads during each second between 9:59:30 and 10:00:30 Eastern. See also. |
NBBO Stability Changes The chart on the left shows the percentage of stocks with destabilizing (red) and stabalizing (black) quote spreads during each second between 9:59:30 and 10:00:30 Eastern. |
 |
 |