Nanex Research

Nanex ~ 25-Apr-2012 ~ SVXY Testing or Manipulation?
Update: We found the same strange behavior in VIIX on
13-Apr-2012.
Just before an expected Fed Annoucement at 12:30pm, in the ETF symbol SVXY (Short
VIX Short-term), trades and quotes exploded from calm to wild with
9 exchanges participating. Upon close inspection, something is not right. Either an
extraordinary case of multiple coincidence, price manipulation, or testing during
a critical period before a news release.
How could this possibly be considered price discovery? Or legal?
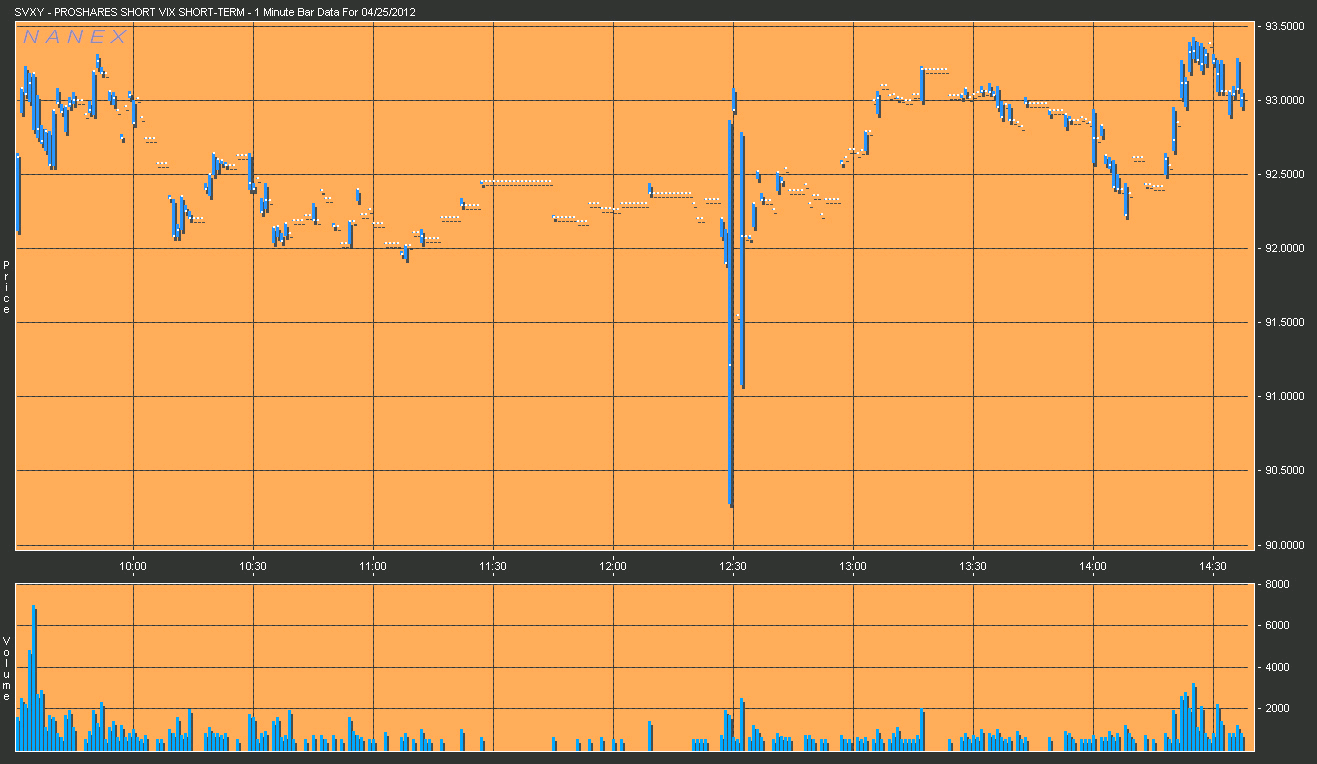
SVXY 1 minute chart.
Note the price spikes at 12:30
SVXY
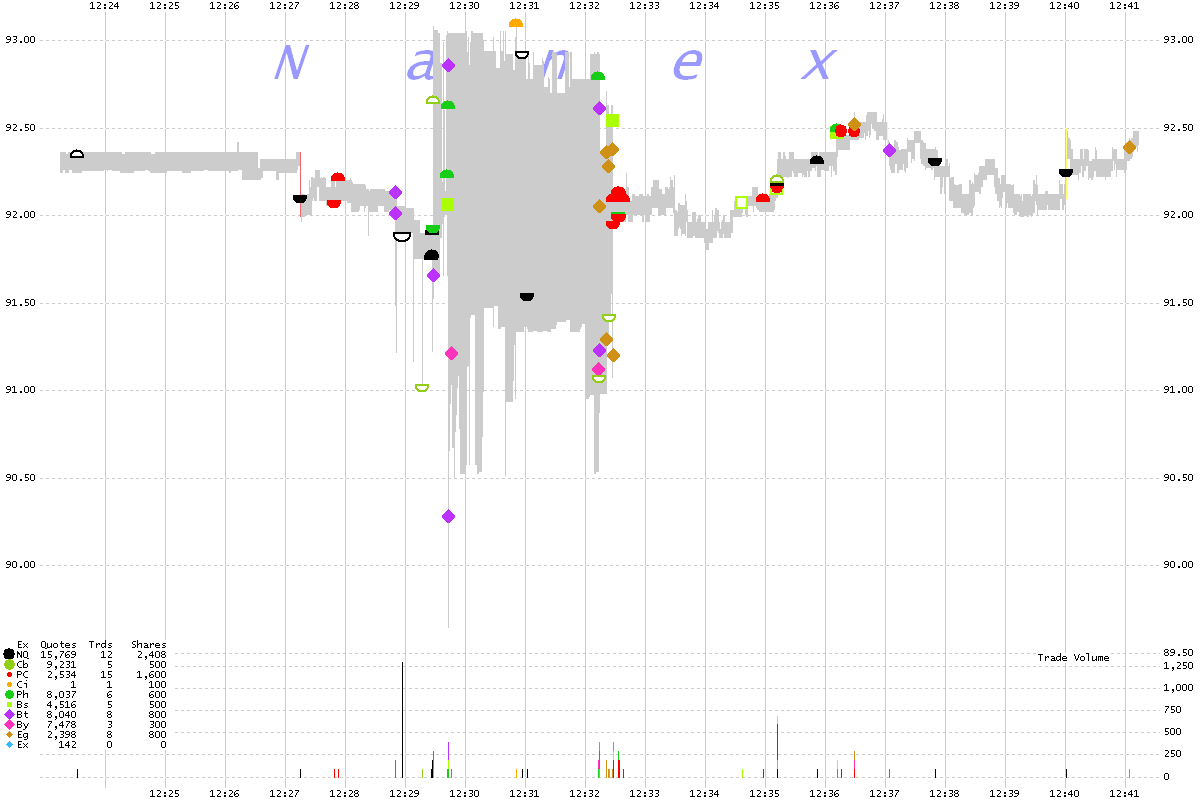
1 second chart showing trades color coded by exchange and NBBO (gray shade).
Prices go from steady to wild.
SVXY
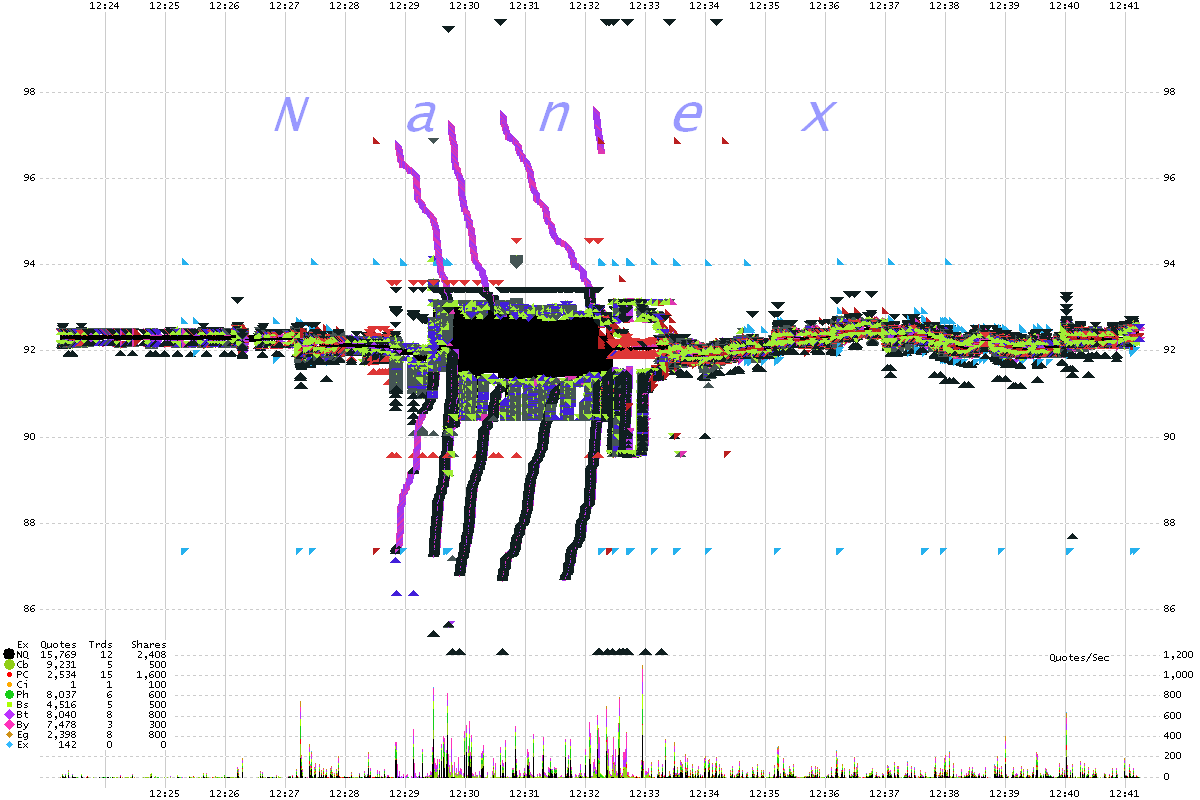
1 second interval chart showing quotes from each exchange.
Based on the quantity and
speed, these are clearly HFT algo driven. Those
coils of colors are actually hundreds of bid and offer price changes.
SVXY
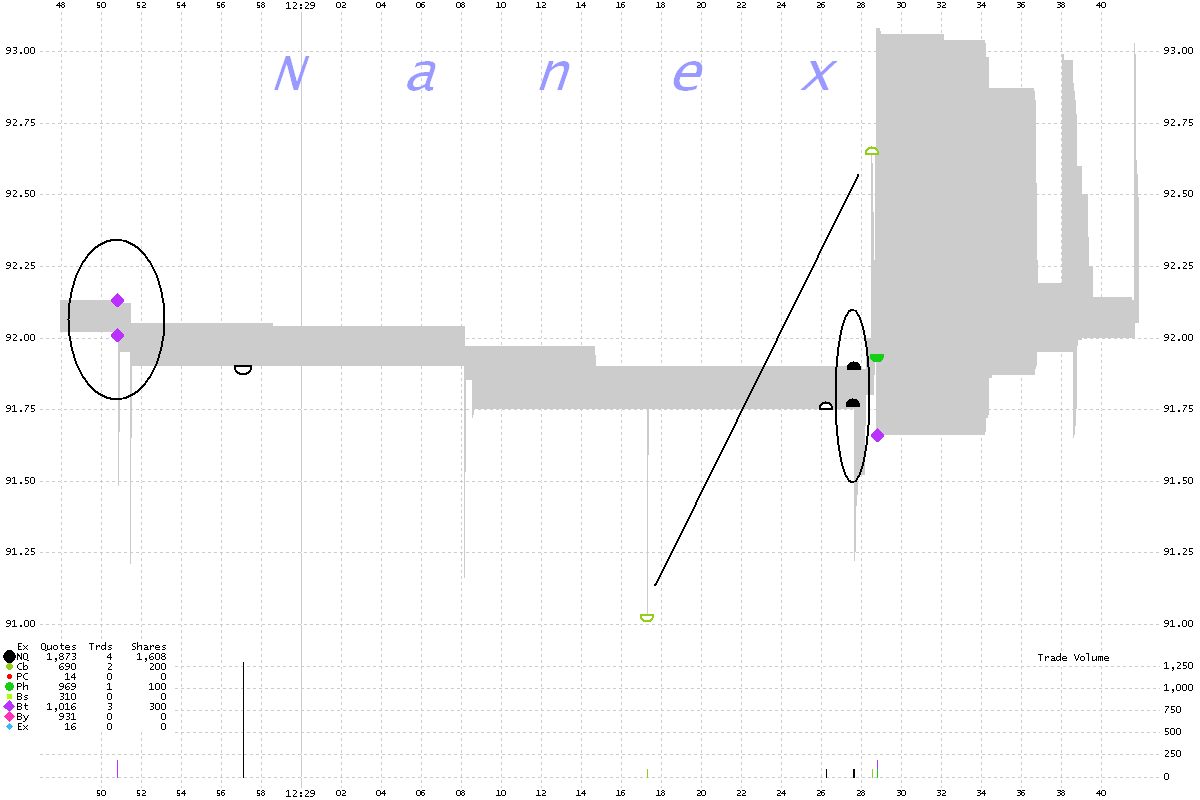
50 millisecond chart showing trades color coded by exchange plus NBBO (gray shade)
Looking closer, notice the 3 matching pairs of 100 share trades from the
same exchange. As if someone is buying and selling at the same time -- for an immediate
loss equal to the quote spread.
SVXY 10 millisecond chart showing trades color coded by exchange plus NBBO (gray
shade)
The 4 matched pairs below are all 100 share trades and all are marked ISO.
3 of the pairs executed at NY-ARCA, one pair at Direct Edge. This can't be coincidence.
Multiple exchanges and ISO orders implies sophistication.
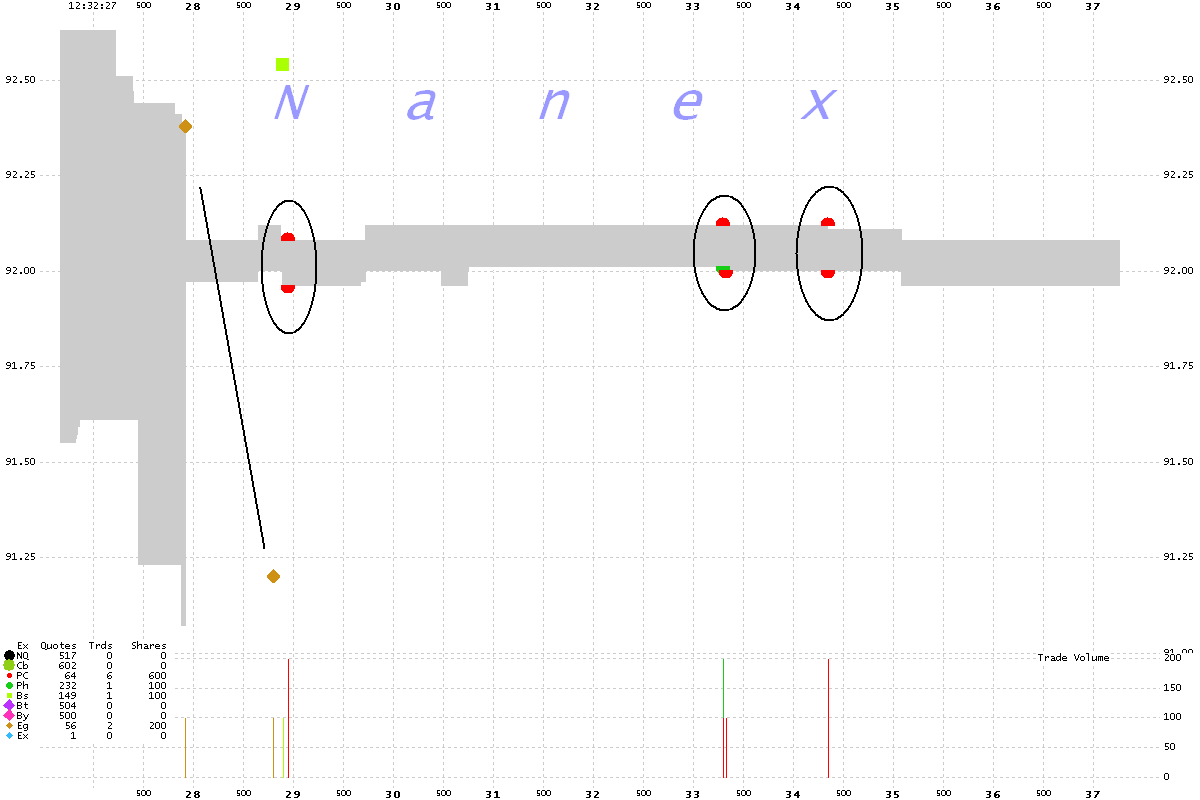
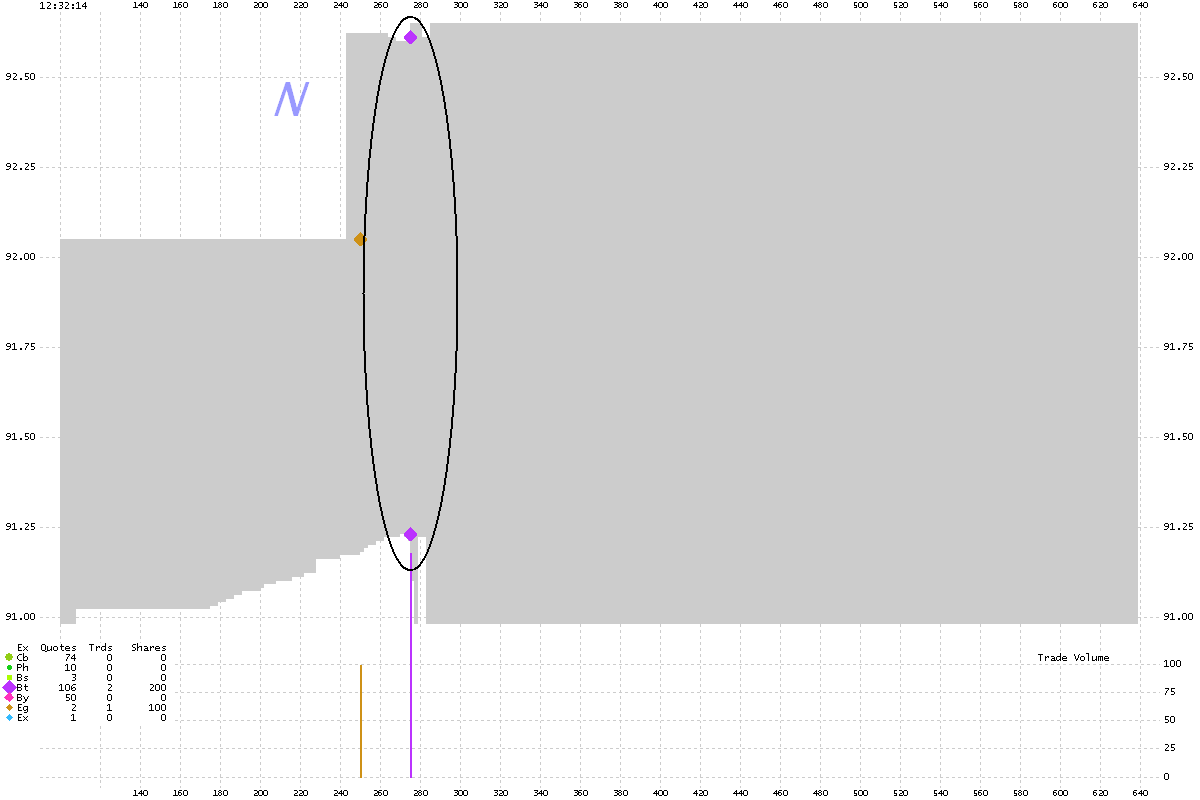
SVXY 1 millisecond chart showing trades color coded by exchange plus NBBO (gray
shade)
Zooming way down to 0.5 seconds of trading, you can see that two 100 share
trades executed on BATS.
A buy of 100 shares at 92.61 and at the exact same time, a sell of 100 shares at 91.23.
Either this is coincidence, or someone just captured a loss of $1.38 or $138 on this
trade.
There is a 1.5% price difference between the bid and ask. How can this in any way
be considered price discovery?
Nanex Research


