Nanex Research

Nanex ~ 13-Apr-2012 ~ VIIX same anomaly as SVXY on 25-Apr-2012
See also 25-Apr-2012 ~ SVXY Testing or Manipulation?
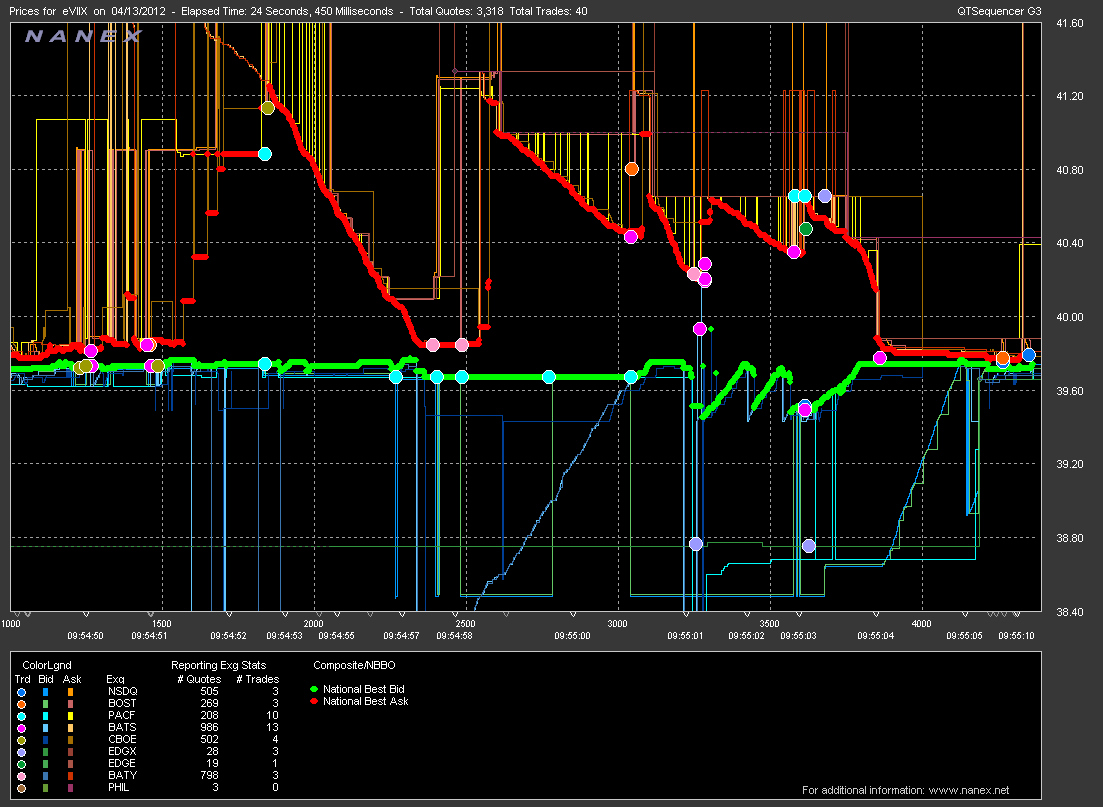
Just before the release of the Consumer Confidence numbers at 9:55am, trading in VIIX
becomes erratic.
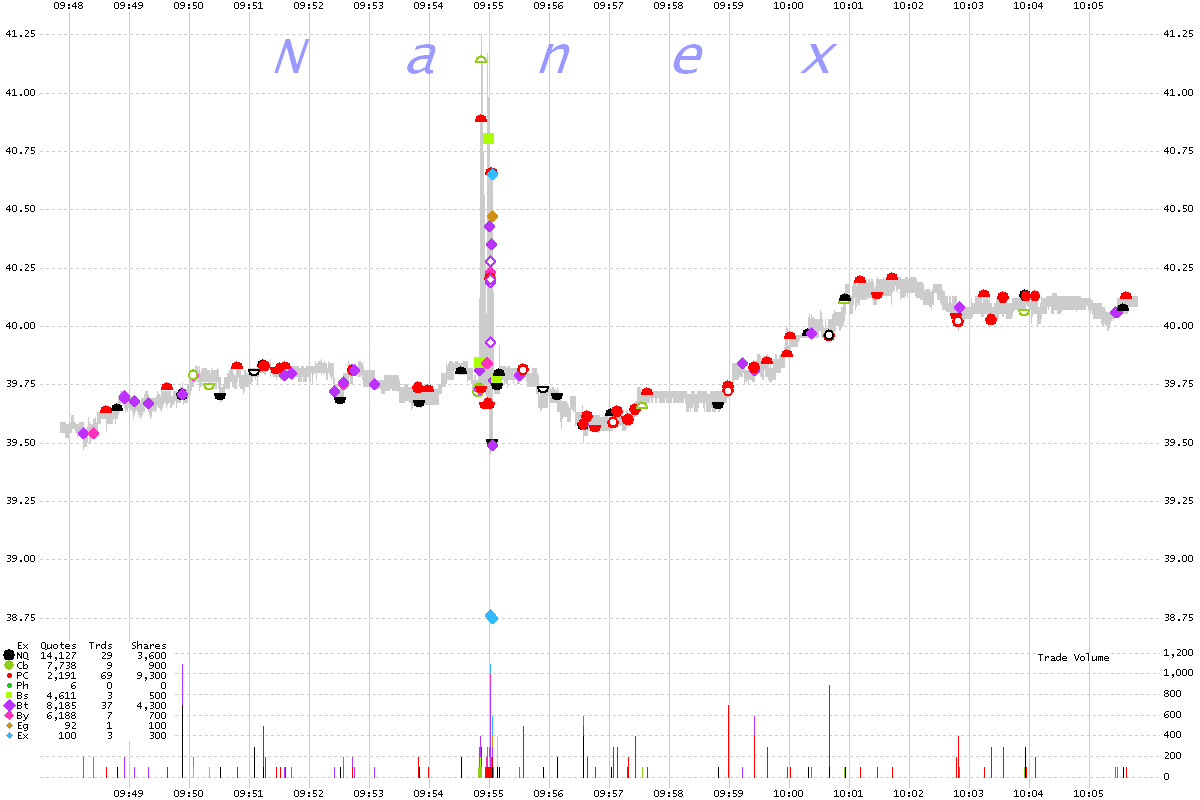
VIIX 1 second chart showing trades color coded by exchange and NBBO (gray shade).
Prices go from steady to wild.
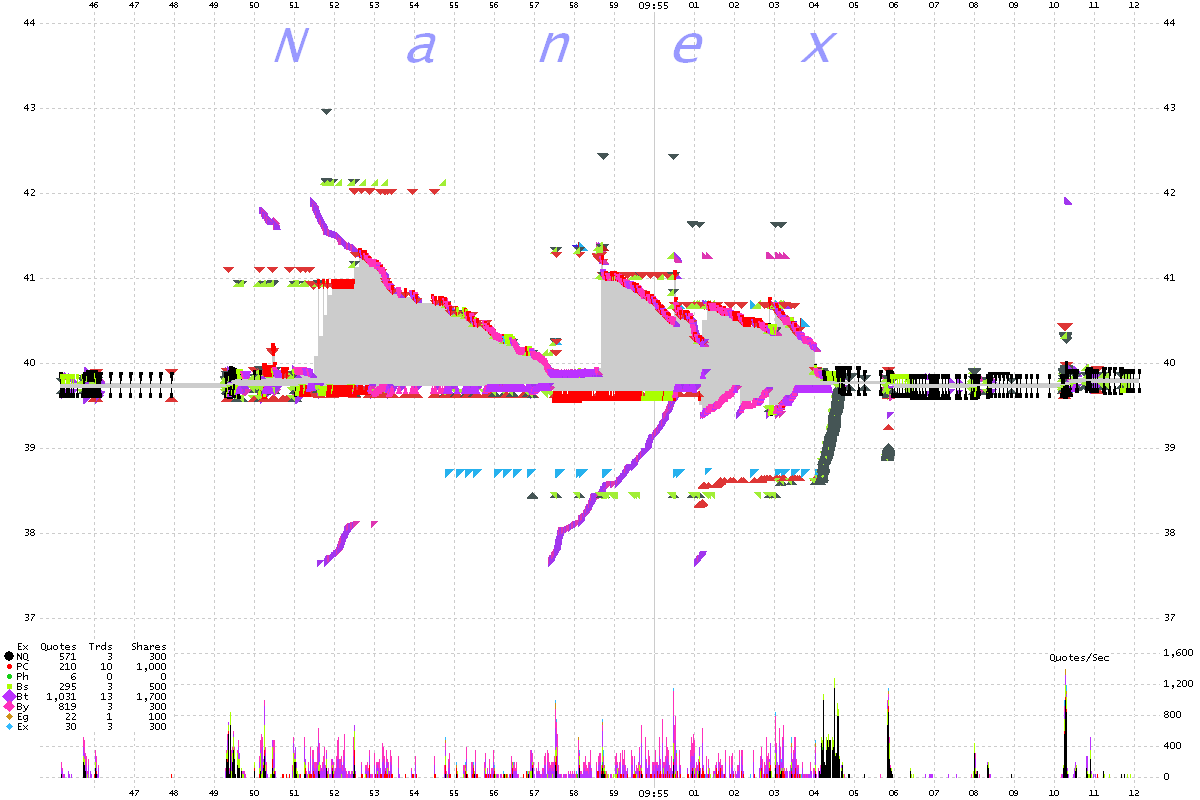
VIIX 25 millisecond interval chart showing quotes color coded by exchange.
Based on the quantity and
speed, these are clearly HFT algo driven. Those
coils of colors are actually hundreds of bid and offer price changes.
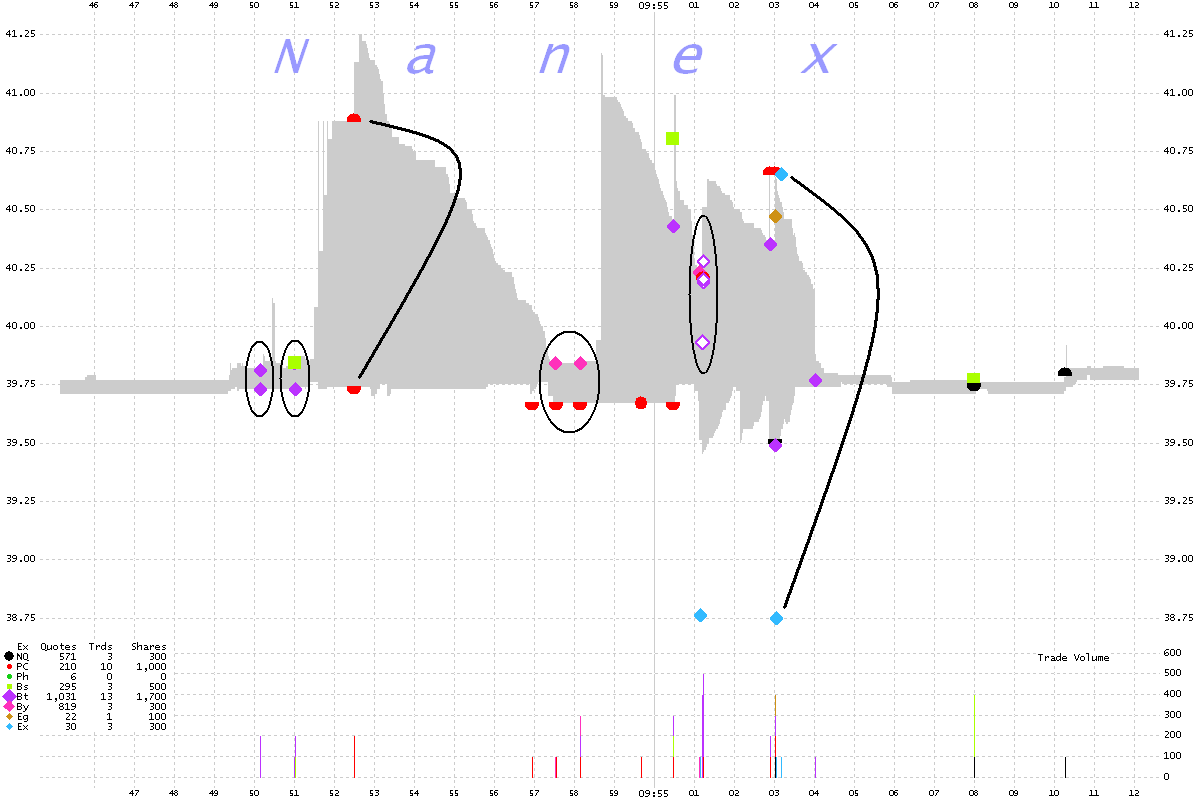
VIIX 25 millisecond interval chart showing trades color coded by exchange.
Lines and circles indicate trades that appear to occur at the same time,
but at prices far apart.
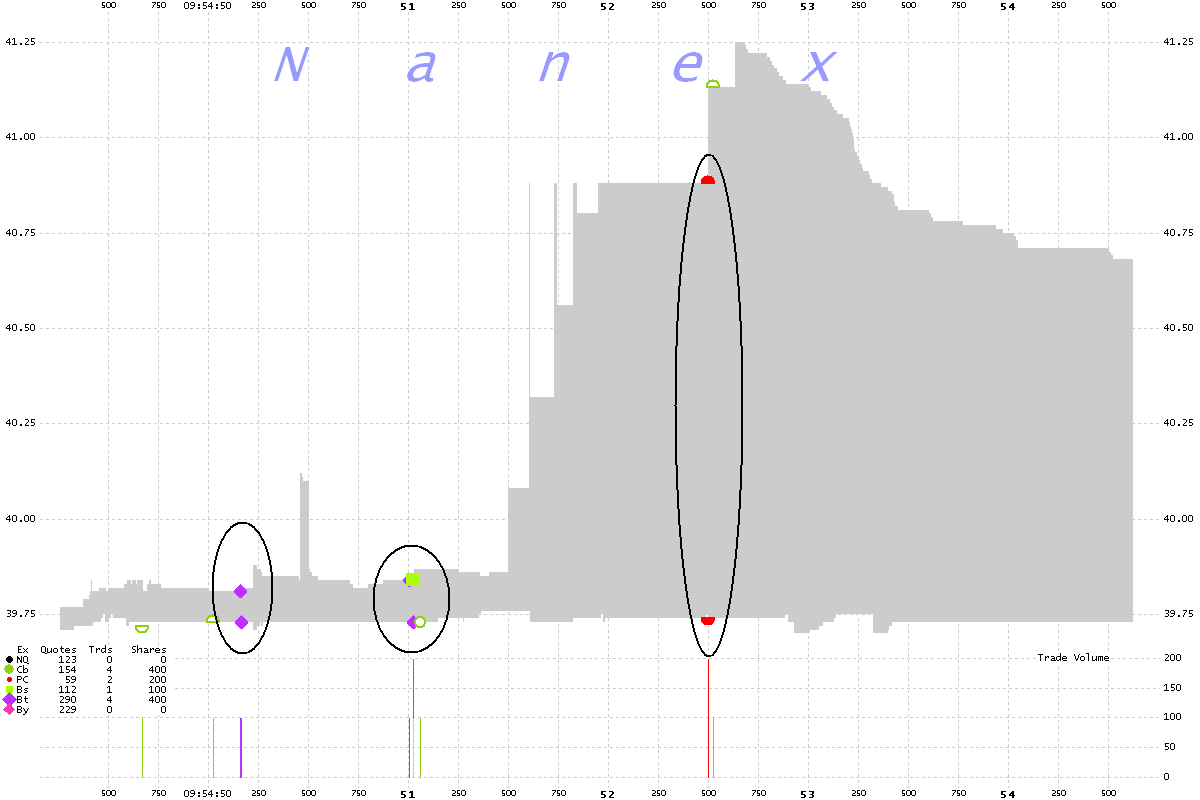
VIIX 5 millisecond interval chart showing trades color coded by exchange.
Groups of trades are circled where trades appear at the same time, and higher priced
trades match ask prices while lower priced trades match bid prices.
VIIX 5 millisecond interval chart showing trades color coded by exchange.
Groups of trades are circled where trades appear at the same time, and higher priced
trades match ask prices while lower priced trades match bid prices.
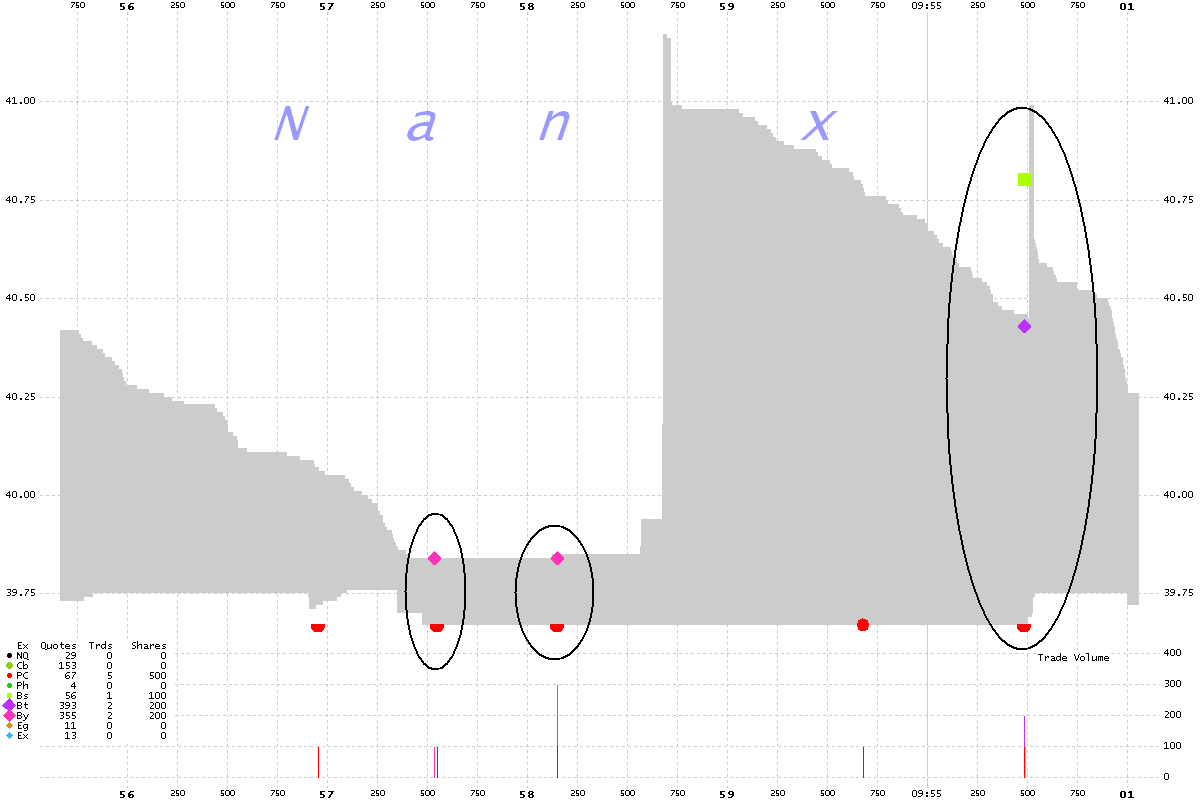
VIIX 1 millisecond interval chart showing trades color coded by exchange.
Groups of trades are circled where trades appear at the same time, and higher priced
trades match ask prices while lower priced trades match bid prices.
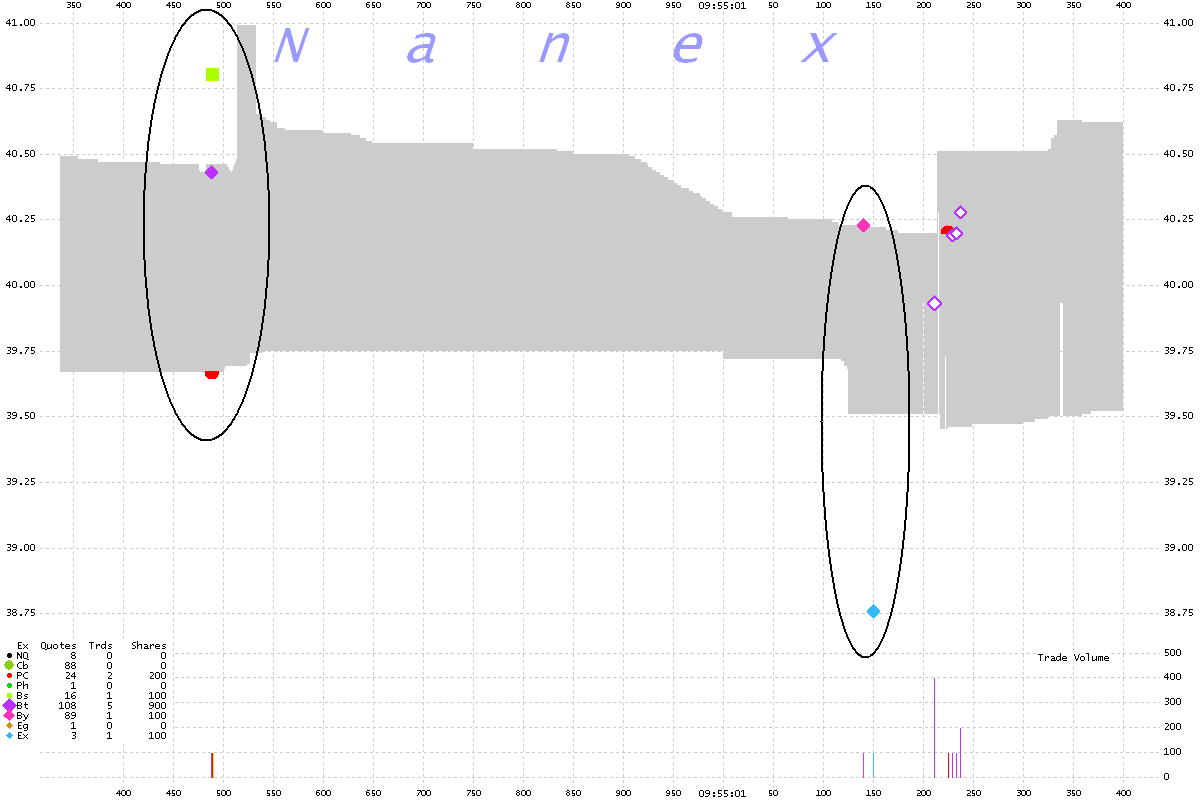
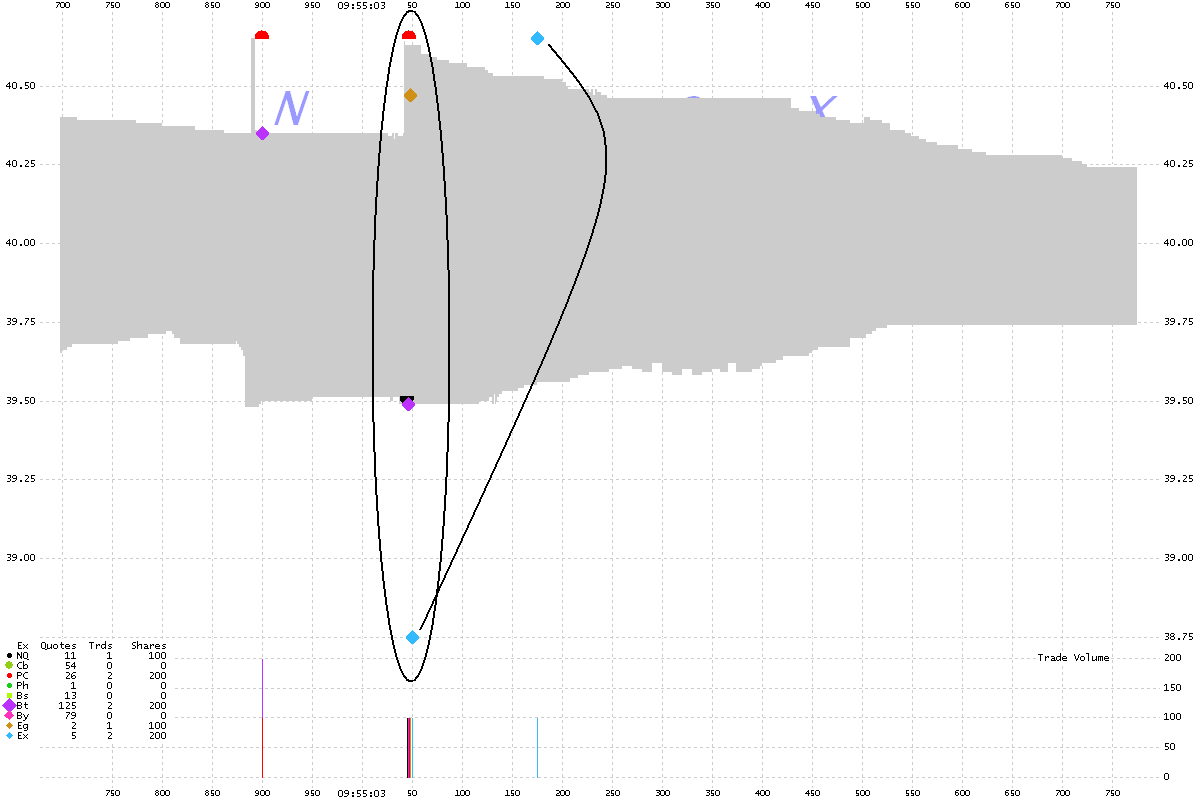
VIIX 1 millisecond interval chart showing trades color coded by exchange.
Trades in circle appear at the same time, the higher priced trades match ask prices,
the lower priced trades match bid prices.
The black line connecting the blue diamonds indicate trades that occurred at the same
exchange within 100ms (EDGE-X) but at wildly different prices.
VIIX Tick Chart showing trades and quotes.
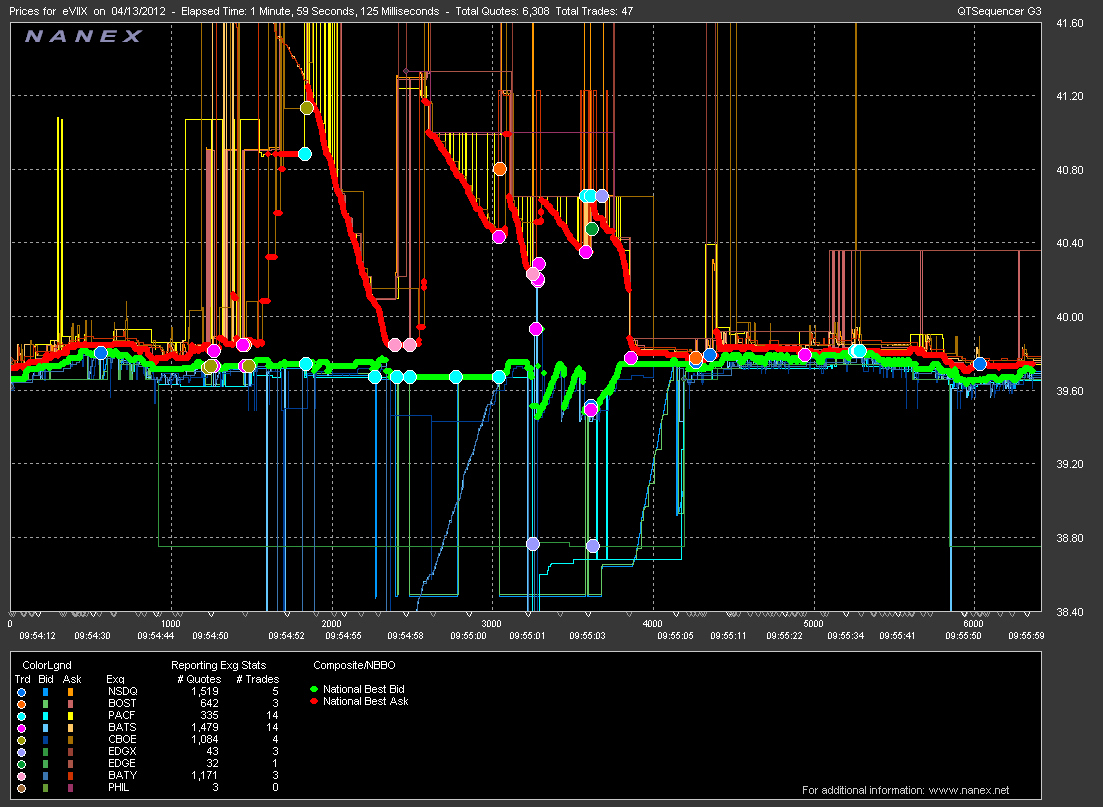
VIIX Tick Chart showing trades and quotes. (zoom of chart above)
Nanex Research


