Nanex ~ 18-May-2012 ~ Facebook IPO

How HFT Caused the Opening Delay, and Later Benefited at the Retail Customer's Expense

See also Nasdaq goes Radio Silent for 17 seconds before open, Facebook Fallout , 127 Miscellaneous Charts, Option repricing events, and other Nanex Research
 
Update: Did a Stuck quote prevent an opening day pop?
Update: We made a video of the open trading period.

Highlights


Time Line

Start Time End Time Elapsed Time Event
11:00:00 11:05 5 minutes Trading to begin (postponed to 11:05)
11:05:00 11:10 5 minutes Trading to begin - 2nd attempt (postponed to 11:10)
11:10:00 11:30 20 minutes Trading to begin - 3rd attempt (postponed to 11:30)
11:10 11:45 35 minutes Erratic prices appear in Apple, Netflix and at least 24 other stocks over next 45 minutes.
11:29:52 11:30:09 17 seconds Nasdaq goes radio silent for all stocks for 17 seconds
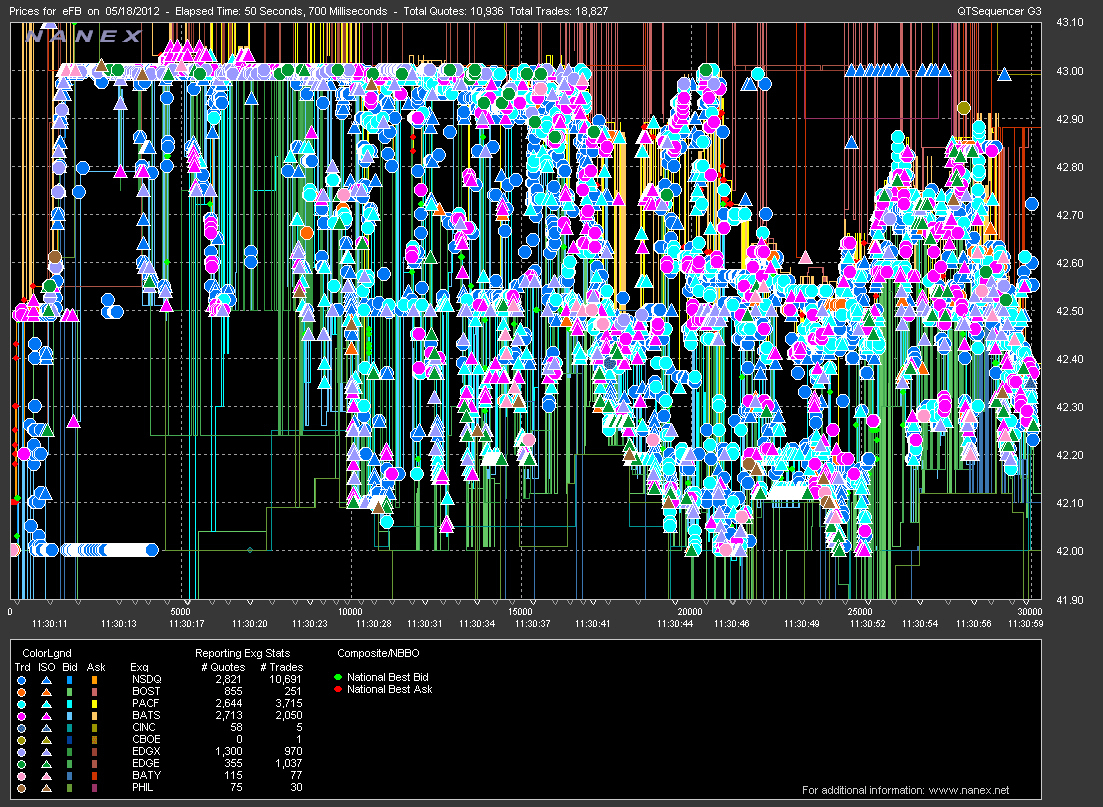
11:30:09 Trades from BATS and NQ-Bost appear
11:30:10 Trades from Nasdaq appear
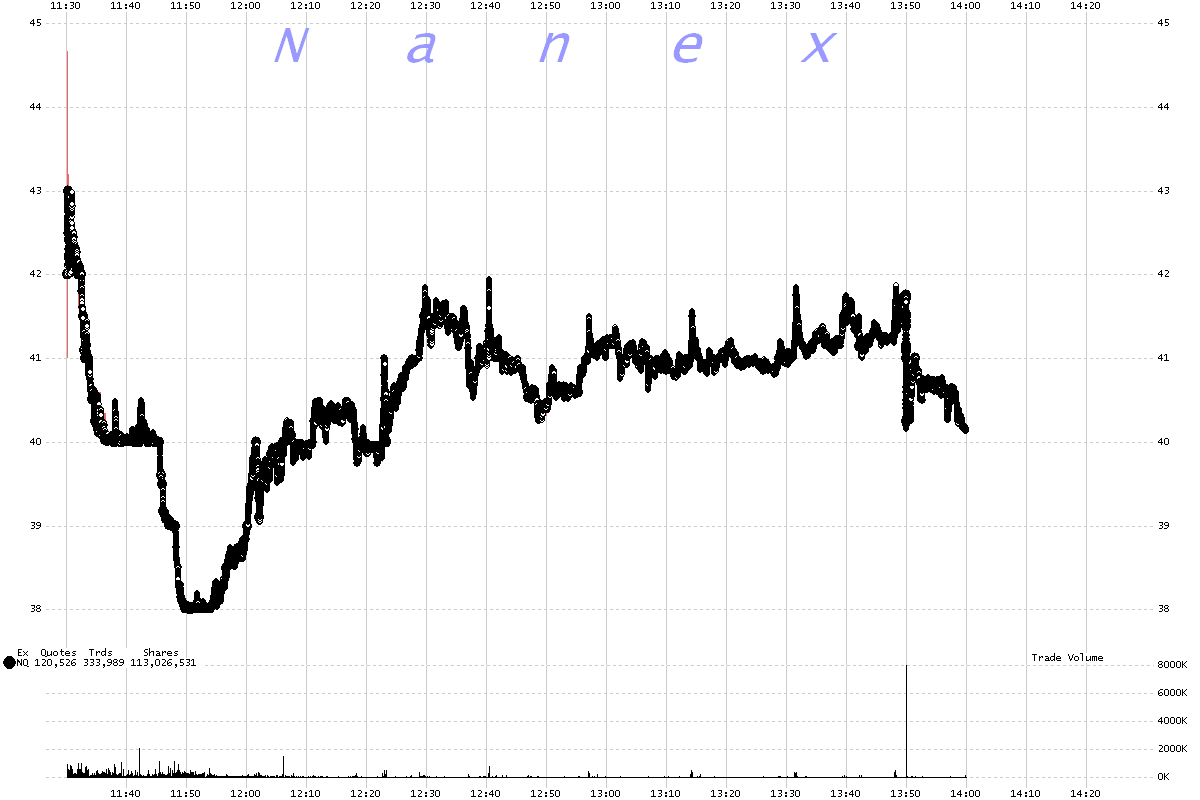
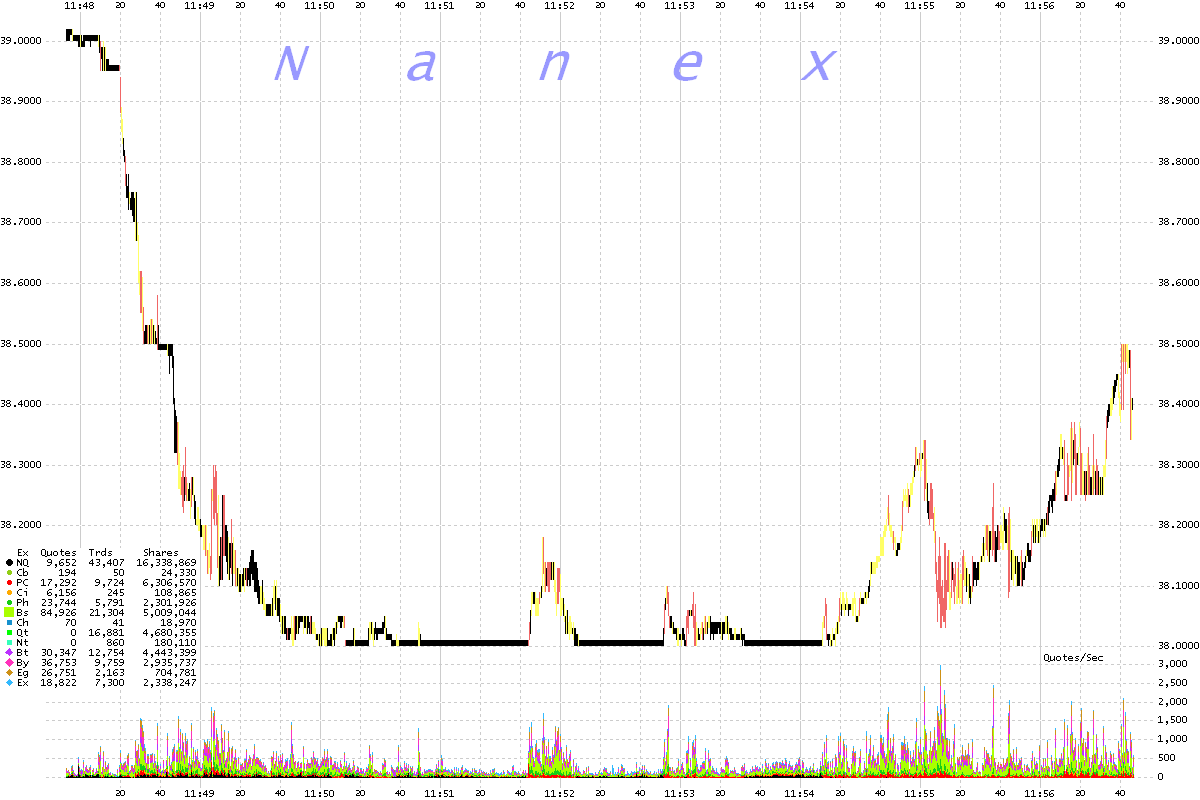
11:30:34 - 13:50 3 hours, 20 mins Nasdaq Bid gets stuck at 42.99. SIP users no longer see NBBO eligible Nq Quote until 13:50
11:30:34 11:54:20 ~ 20 minutes Nasdaq Ask is non-firm (not eligible to set NBBO)
11:50:06 Nasdaq Ask gets stuck at 38.01 -- stops updating when other exchange quotes move higher
11:54:17 13:50 ~ 2 hours Nasdaq Ask remains stuck at 38.01, and stops updating until 13:50 (Other exchange quote prices moved higher)
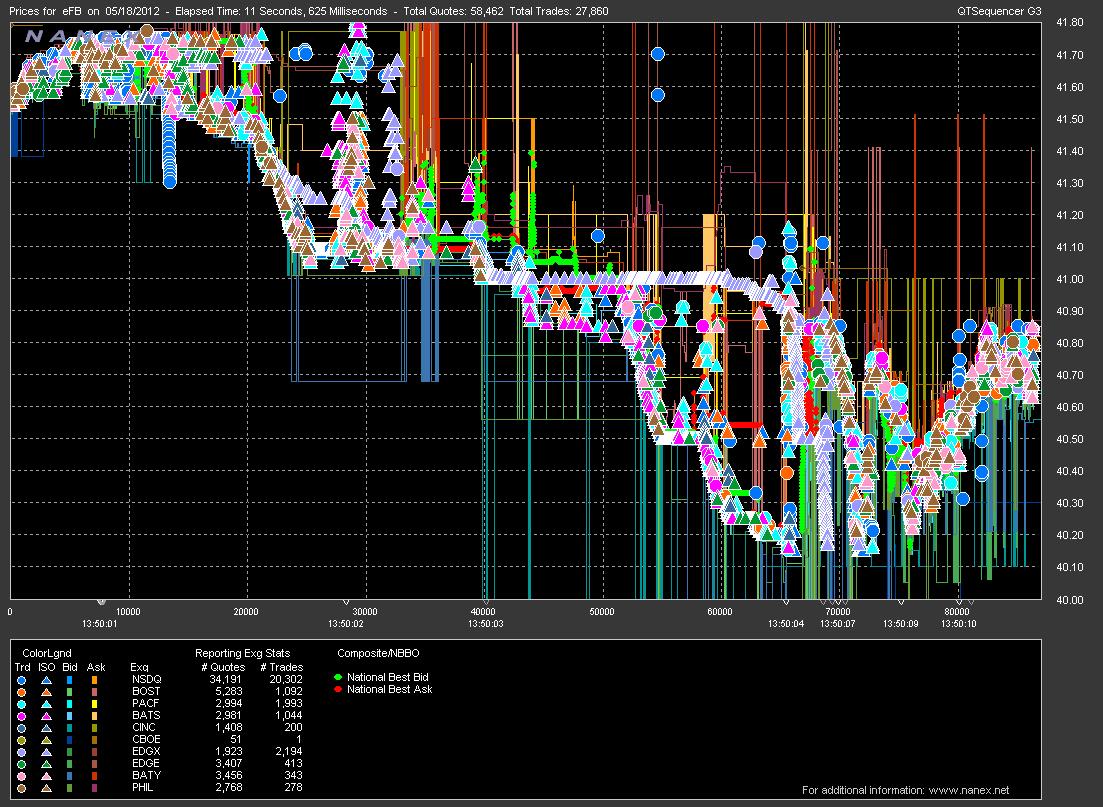
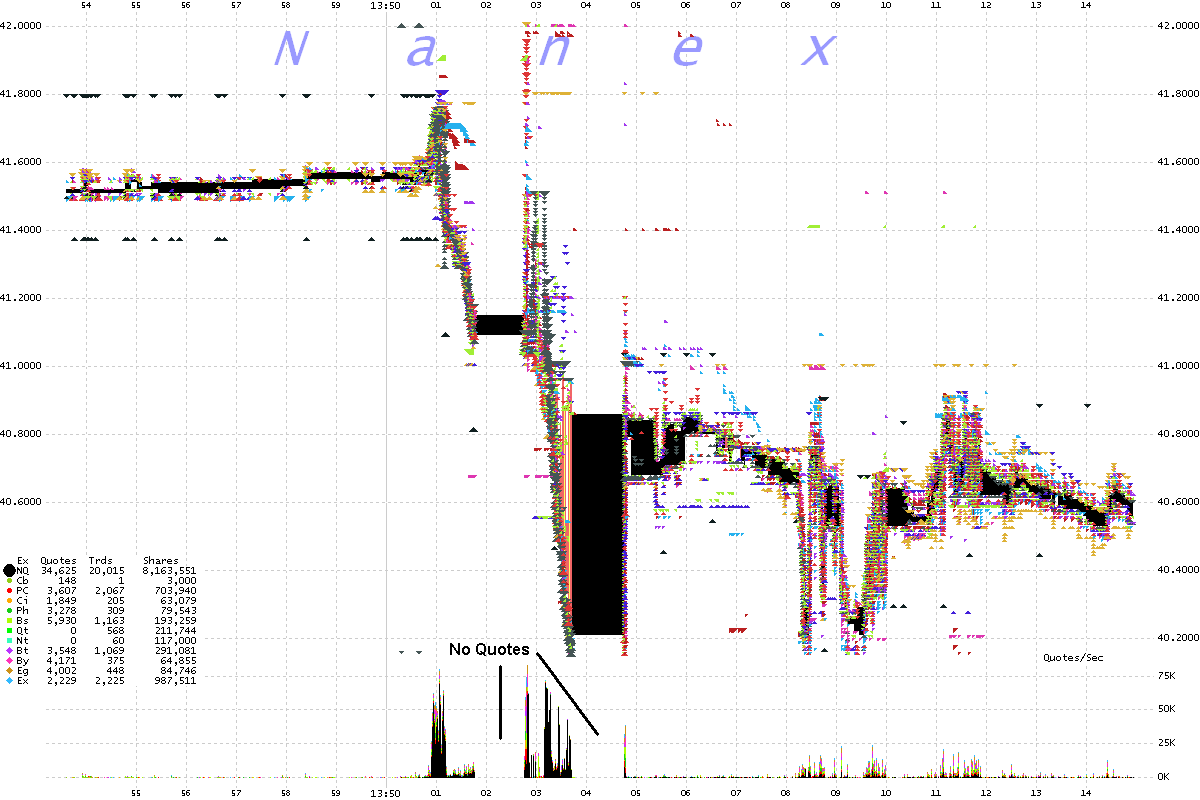
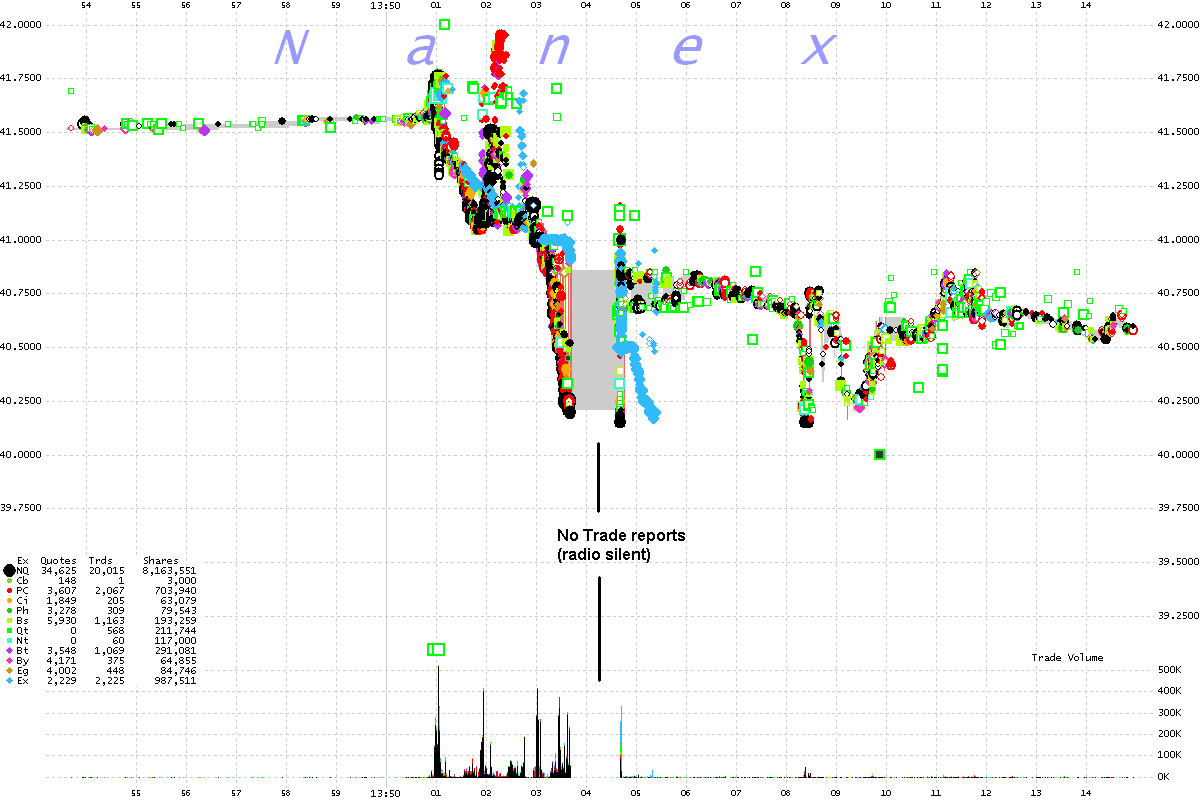
13:50:01 13:50:03 3 seconds Approx 37,000 quotes and 22,000 trades are blasted over 3 seconds from all reporting exchanges, causing several full second outages.


Details


The first warning sign, was the delay in trading. Here's the status messages from Nasdaq for that day.


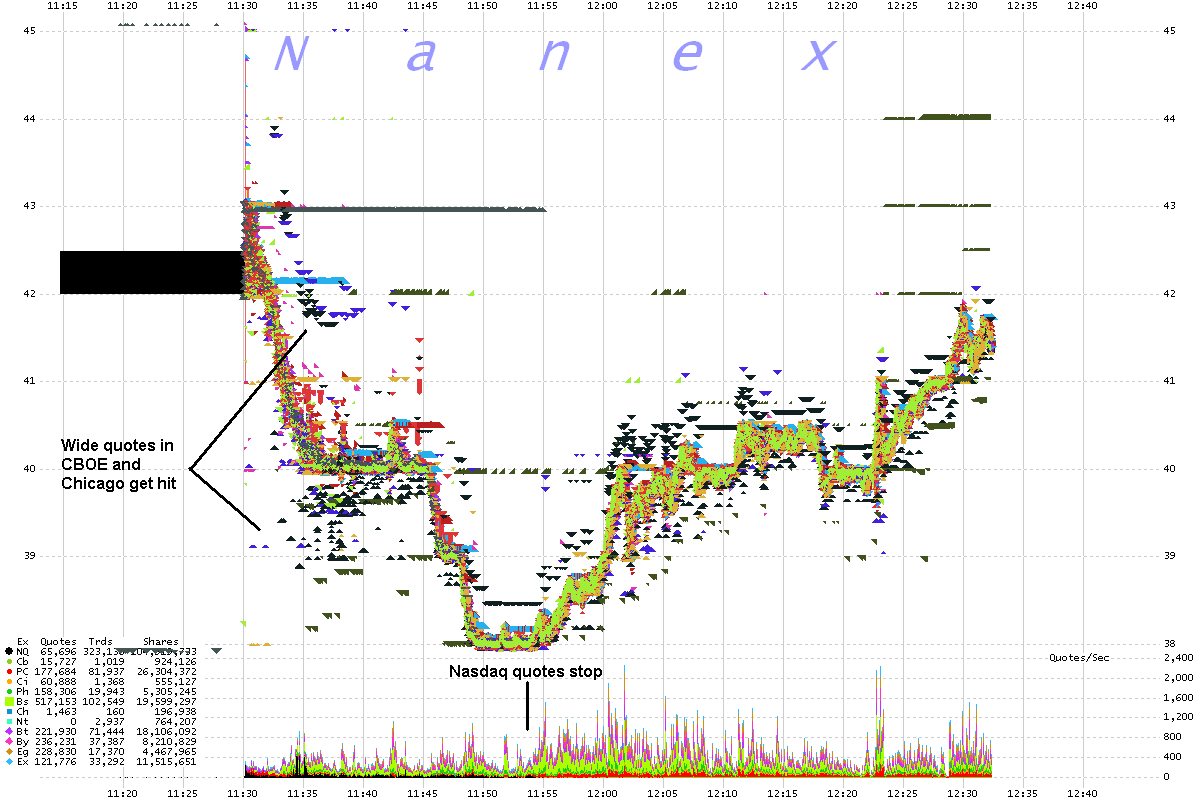
Between 11 and 12 Eastern, bad prices (spikes) began appearing in other stocks, including symbols APPL, INTU, NFLX, PDCO, QCOM, QLD, UST and ZNGA. There are likely other stocks that were affected. In nearly all of these cases the price spikes were executing against quotes that were far outside the NBBO. Most of these executions occurred on the CBOE, and a few on Chicago and AMEX. We think these are related to whatever issues Nasdaq was having in facebook and probably are from errors in routing software. A similar thing happened during BATS failed IPO in AAPL and other stocks. We will post more details about this on another page.


Thanks to the work of Telis Demos in an article ‘Raindrops’ raise questions after Facebook IPO we now know the cause of the opening delay was excessive quote cancellations. From the article:

And it was one quote cancellation sneaking into a five-millisecond window that caused about 20 painful minutes, watched live by the world on CNBC television, of the delay to the opening of Facebook’s initial public offering on Nasdaq’s US market.
..
In brief, the problem was that the system took two extra milliseconds to calculate the opening price. Because of a decision before to allow continuous order placement during IPOs, cancellations kept “fitting in between the raindrops”, in the words of Bob Greifeld, Nasdaq’s chief executive, in the five milliseconds it was taking to determine a price.
Only High Frequency Traders (HFTs) can cancel quotes at that rate. And ironic enough, it was mostly HFTs that benefited later when Nasdaq quotes stopped coming from the Securties Information Processor (SIP) which transmits quotes for everyone who doesn't get the premium direct feeds. The nearly 2 hour outage, from 11:54 ro 13:50 can be seen in Charts 9 and 10 below. Those who are co-located and get the direct feeds, namely HFTs, didn't experience this problem, as trades continued to come from Nasdaq.


What quotes in Facebook sounded like during the first 4 minutes (11.30.09 - 11.34.24)


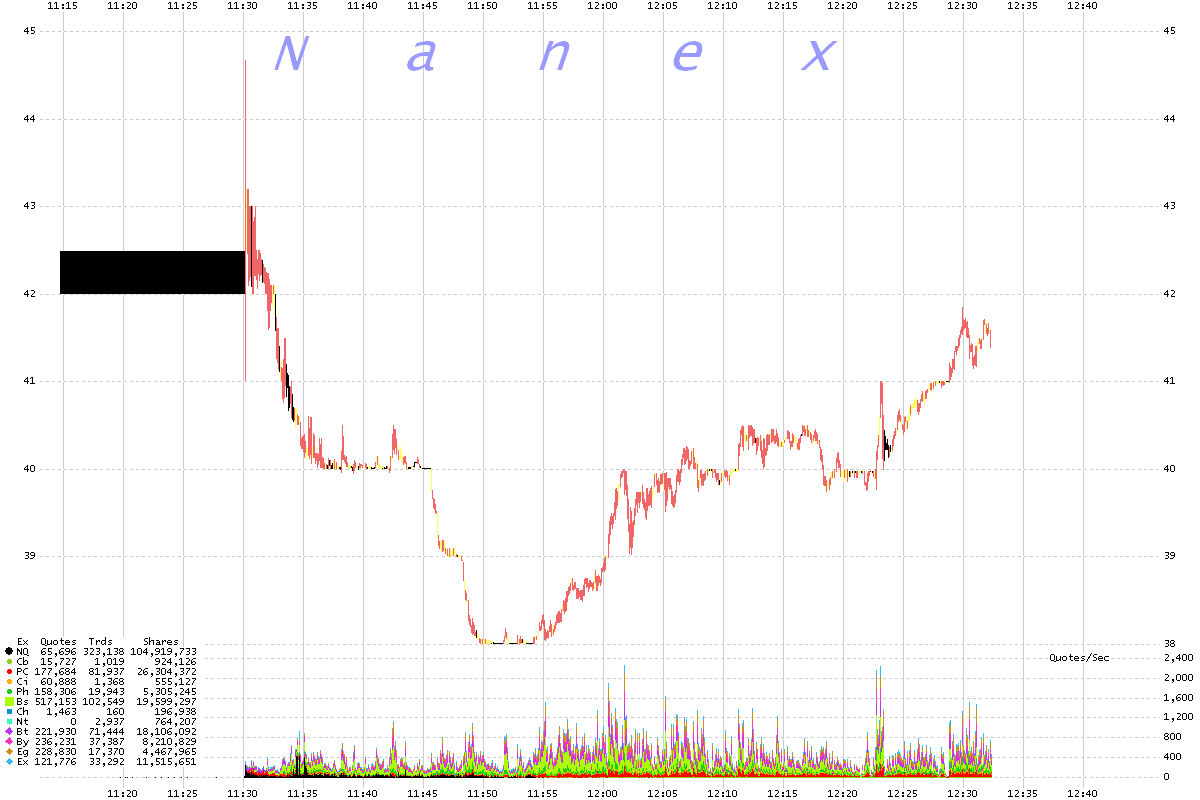
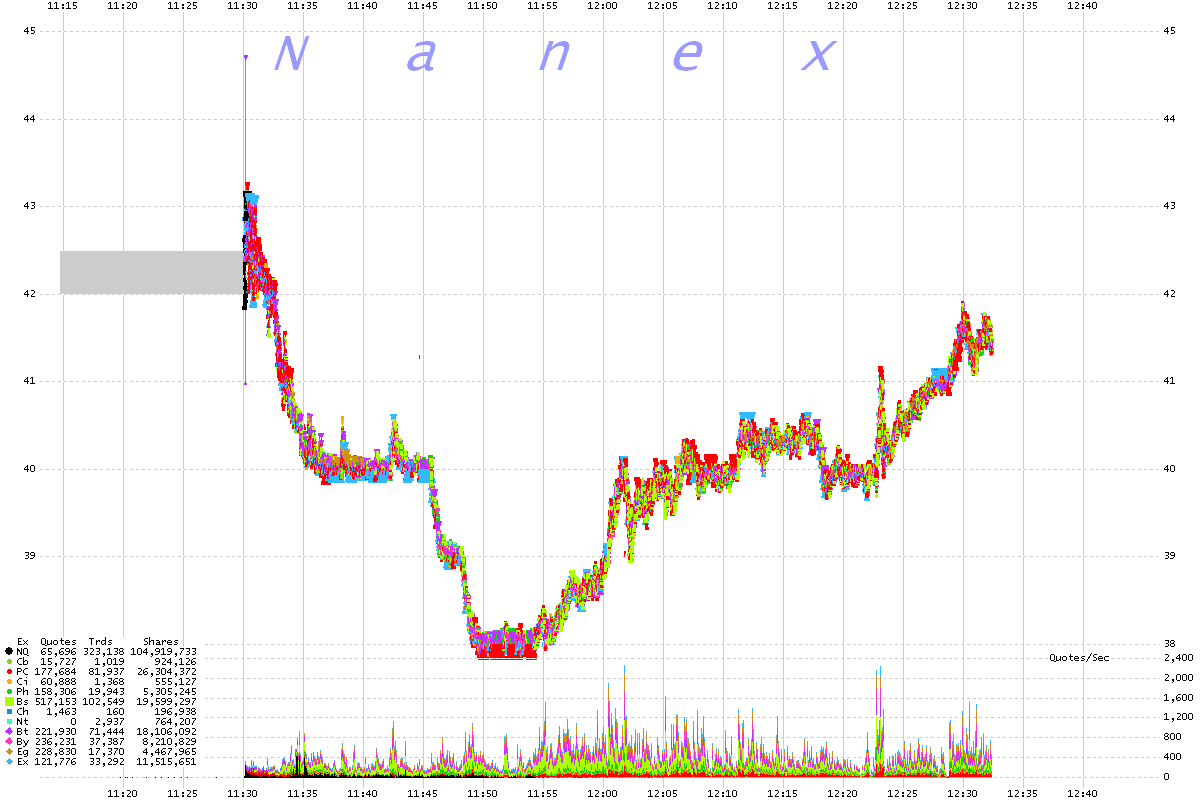
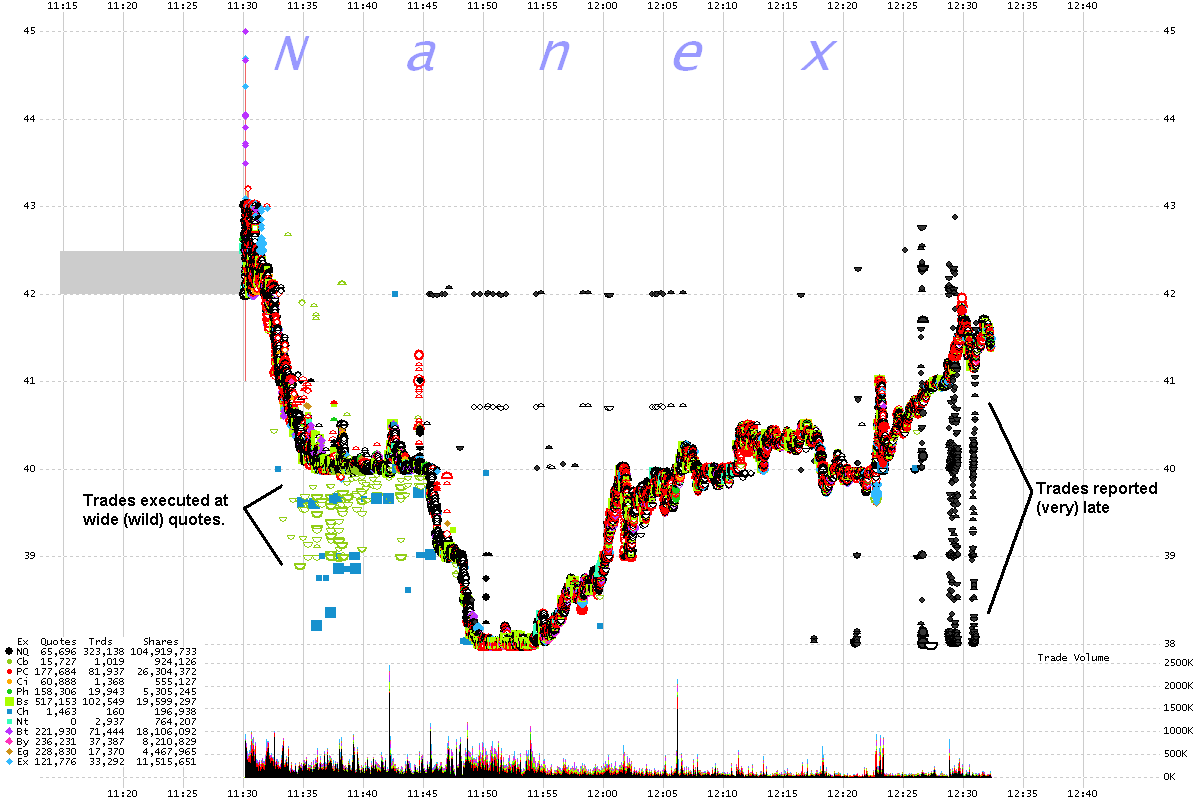
The first 4 charts are 5 second interval charts of Facebook showing the first hour and 15 minutes of quotes and trades.

Chart 1. NBBO (National Best Bid or Offer) Spread. Black: bid < ask (normal), Yellow: bid = ask (locked), Red: bid > ask (crossed) all bids and offers color coded by exchange.


Chart 2. Best bids and offers (NBBO) color coded by exchange.


Chart 3. All bids and offers color coded by exchange.


Chart 4. All trades color coded by exchange.


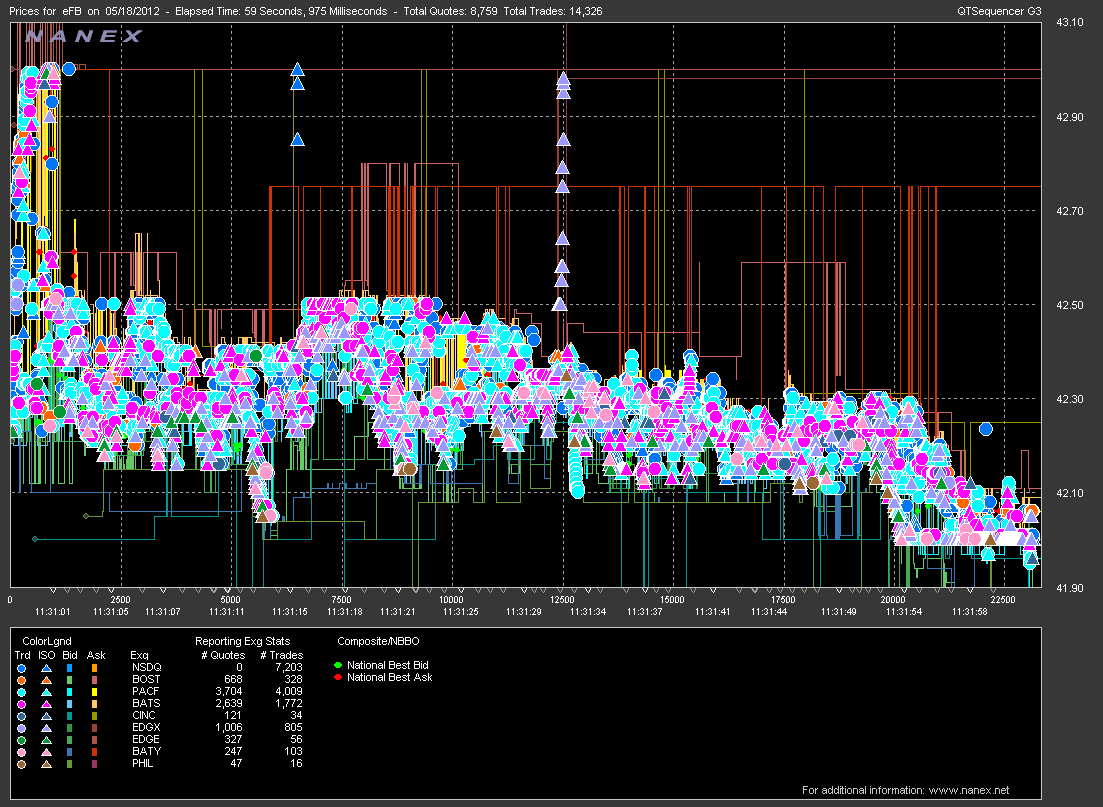
The next 4 images are tick charts showing quotes and trades. How to read these charts

Chart 5. The first seconds of trading.


Chart 6. The first seconds of trading, continued.


Chart 7. Suddenly, a vacuum appears and produces a record 12,285 trades in 1 second.


Chart 8. Same as above, showing just Nasdaq.


The next 2 charts (10 second interval) show how Nasdaq's quote stopped, but trades from Nasdaq did not (direct feeds must have been fine, but not the consolidated).

Chart 9. Nasdaq Bids and Offers along with NBBO.
All Nasdaq quotes until 13:50 are marked non-firm, meaning they won't update or participate in the NBBO calculation. We are surprised that this doesn't seem to affect the proportion of trades executed at Nasdaq.


Chart 10. Nasdaq Trades


The next 2 charts (20 millisecond interval) show the effect when Nasdaq's quote returned. There were two significant gaps in quotes (for all exchanges) and 1 significant gap in trades.
Note how the gap in trades is not at the same time as the gaps in quotes.

Chart 11. All bids and offers color coded by exchange.


Chart 12. All trades color coded by exchange.


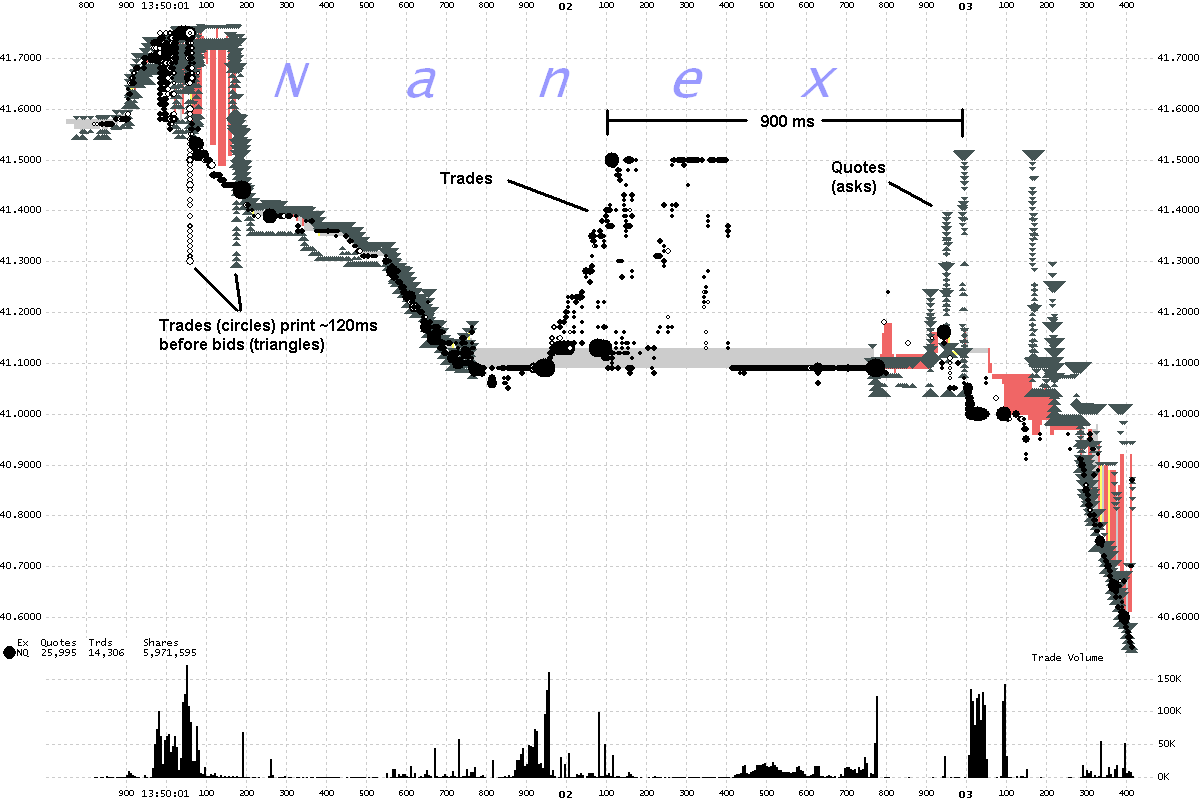
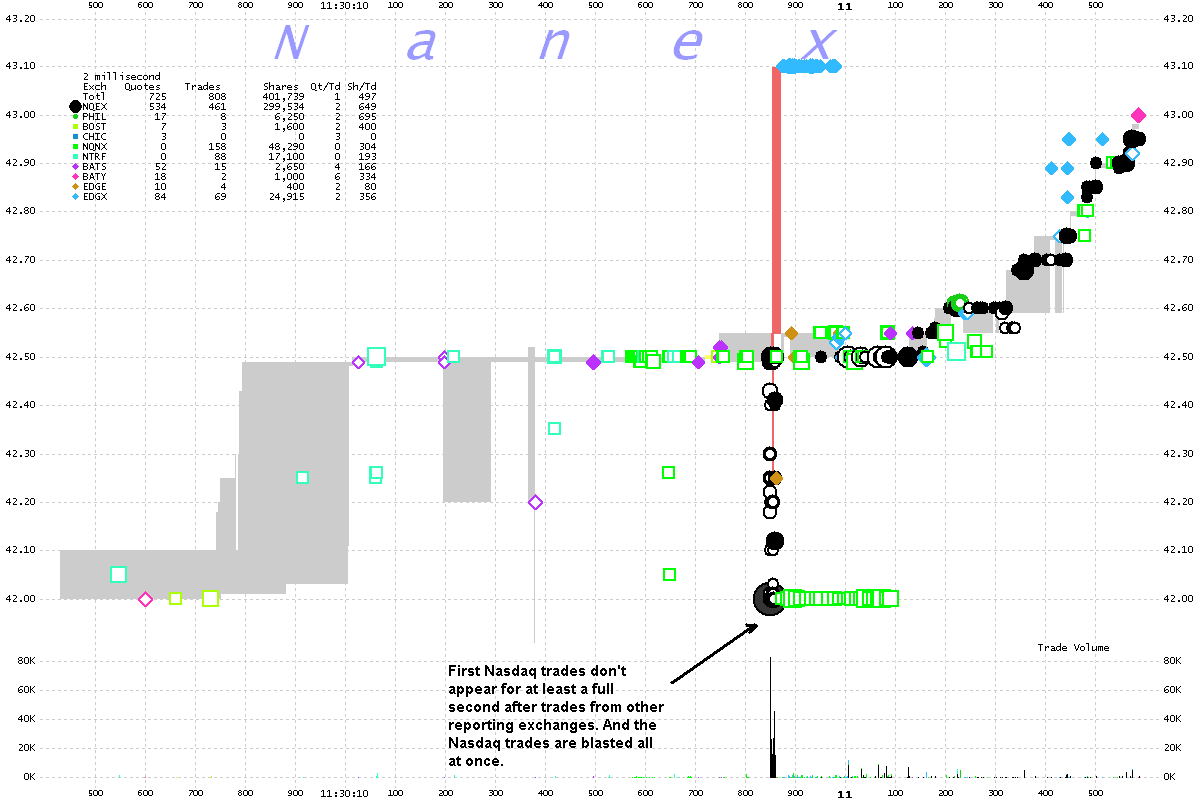
The next chart (5 millisecond interval) shows the result of the blast in trades and quotes when Nasdaq's quote returned. Trades printed at least 900 milliseconds before quotes, an impossibility if orders are being routed according to regulations. We have jokingly referred to this anomaly as fantaseconds.

Chart 13. Nasdaq bids and offers (triangles), Nasdaq trades (circles) and NBBO (gray/yellow/red shading).


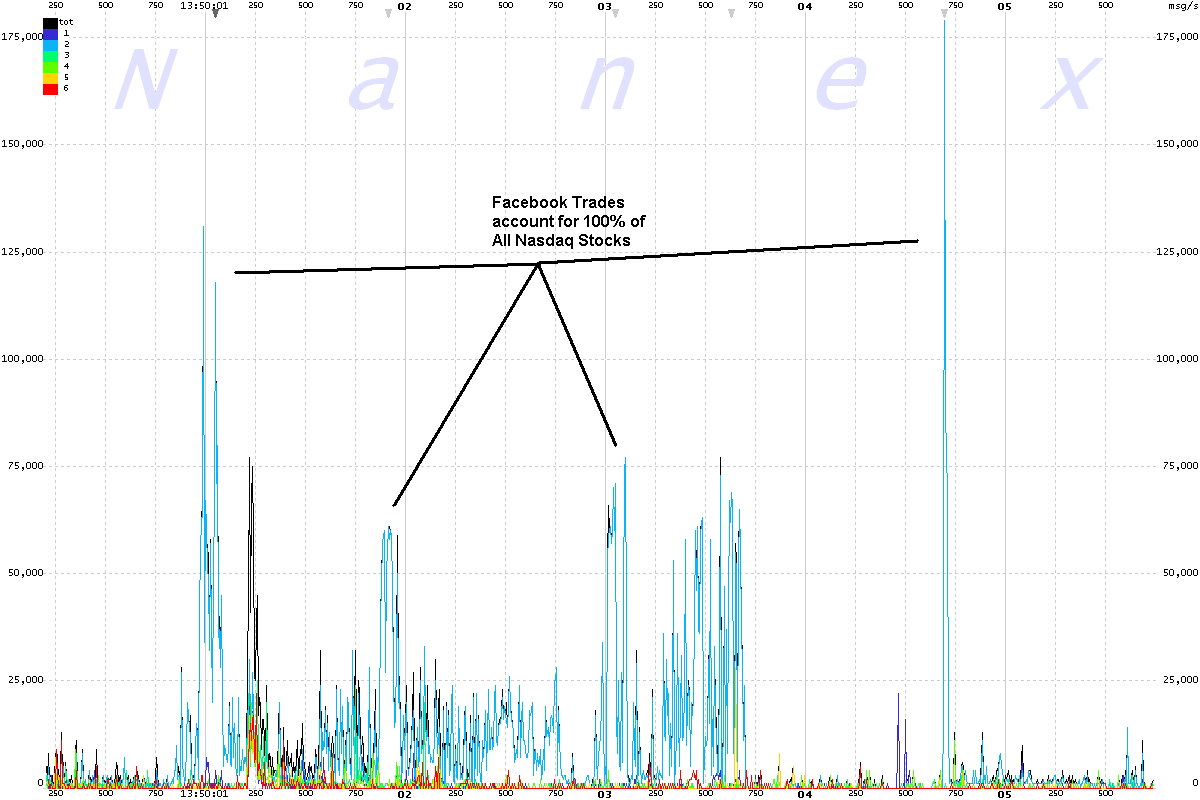
Facebook accounts for 100% of all UTDF traffic during these bursts. UTDF carries trades for all Nasdaq Listed stocks.

Chart 14. UTDF Traffic (5 ms Interval) showing each of the 6 multucast lines plus total.
Facebook is on line 2 along with symbols CE through FDZZZZ. Line 2 accounts for all traffic where the total (black line) is hidden.


The next 2 charts (500 millisecond interval) detail the HFT Tractor Beam area where coincidentally or not, Nasdaq quotes began "sputtering" right before stopping for about 2 hours.

Chart 15. NBBO Spread and quote rate from all exchanges.
Note the flat lines at the bottom. Also note how the quote rate (lower panel) surges when prices rise above the flat line, which is what we would expect. However, on Nasdaq (next chart)..

Chart 16. NBBO Spread and quote rate from just Nasdaq.
When prices rise above the flat line, quotes from Nasdaq stop, exactly opposite of expected behavior and what we see from other exchanges at that time (see chart above).
We think when Nasdaq's ask reached 38.01, something locked it there which in effect caused quotes from Nasdaq to stop transmitting to the SIP until 13:50.


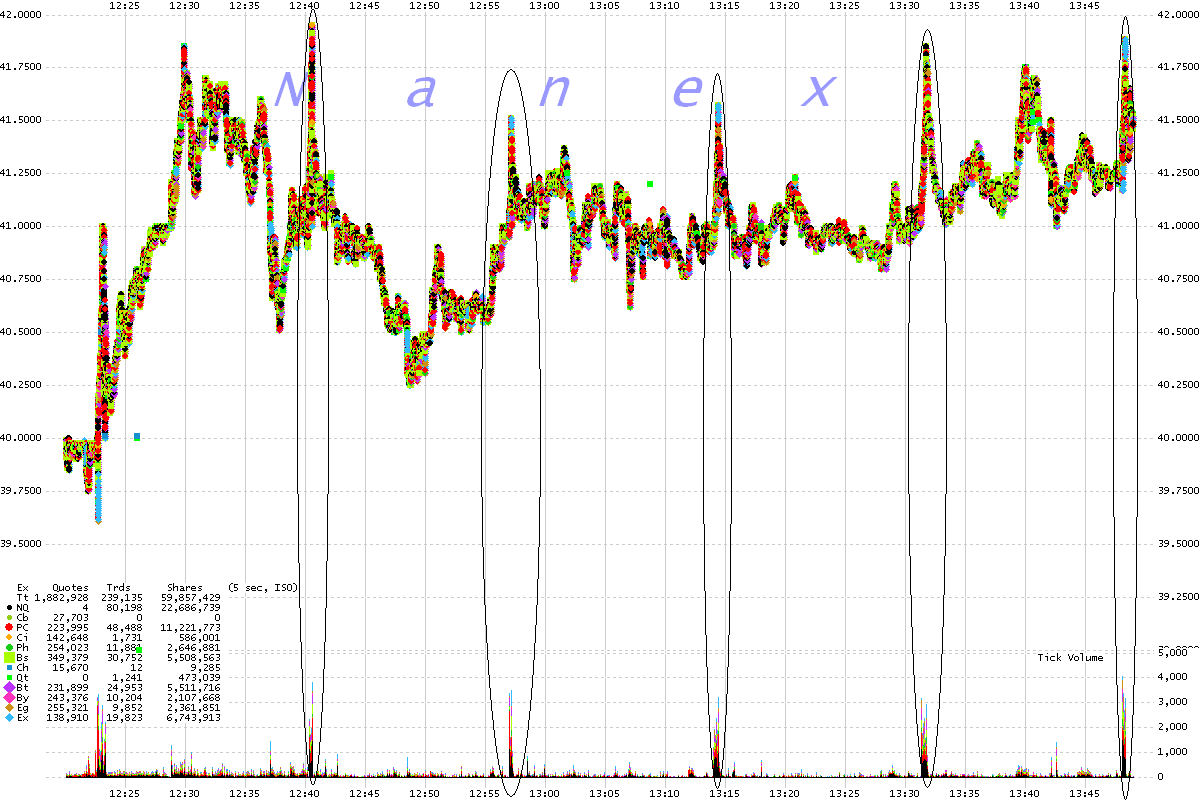
Chart 17. Trades from all exchanges except from Trade Reporting Facilities.
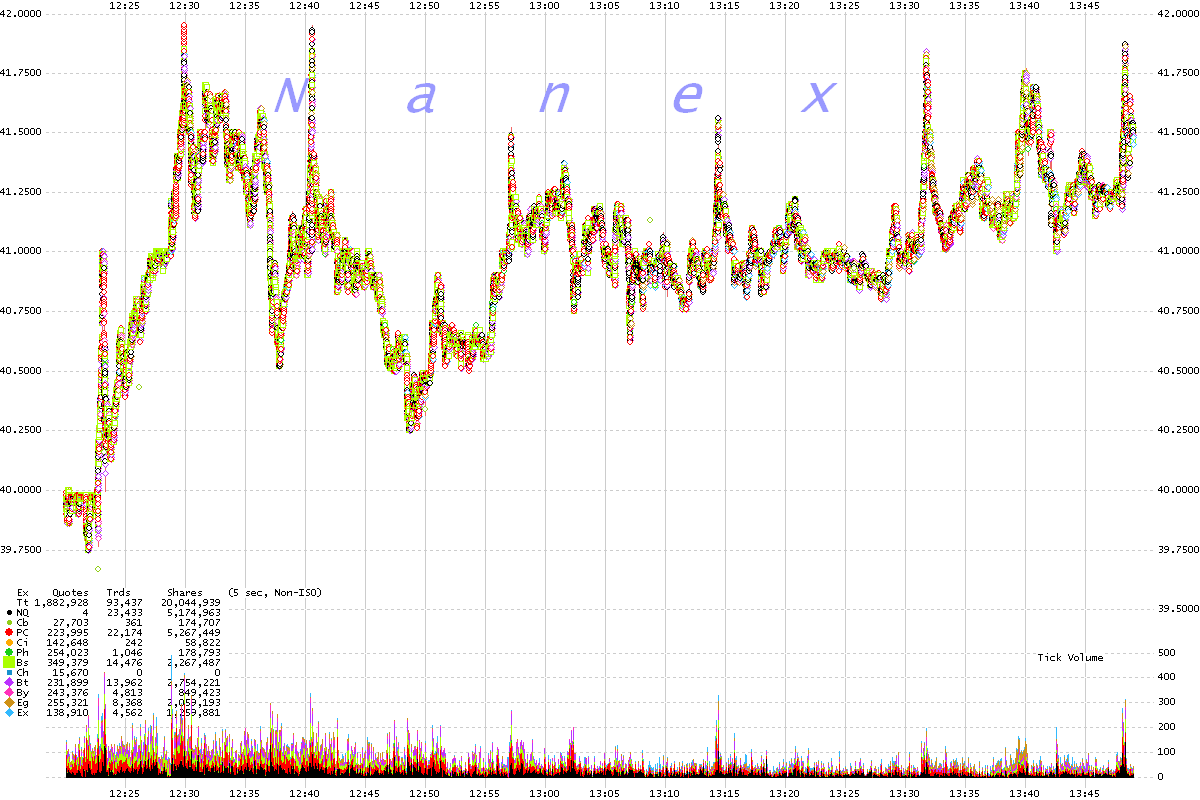
Note the rapid goosing of Facebook stock price about every 15 minutes (circled in the chart below).

Chart 18. Non-ISO Trades from all exchanges except from Trade Reporting Facilities.  Contrast the bottom panel (tick volume) with the chart above.


Chart 19. First trades in Facebook
Note how Nasdaq trades blast on the tape at once, and are a full second behind trade reports from other exchanges. Nasdaq just came out of 17 seconds of silence. Maybe these trades occurred during that silence.


The next 16 images are 1 second interval charts showing trades color coded by exchange. Trades reported on alternate exchanges and dark pools are excluded for clarity. Note the many sharp rallies that immediately break down.


Nanex Research