Nanex Research

Nanex ~ 24-Oct-2012 ~ A Failure to Communicate
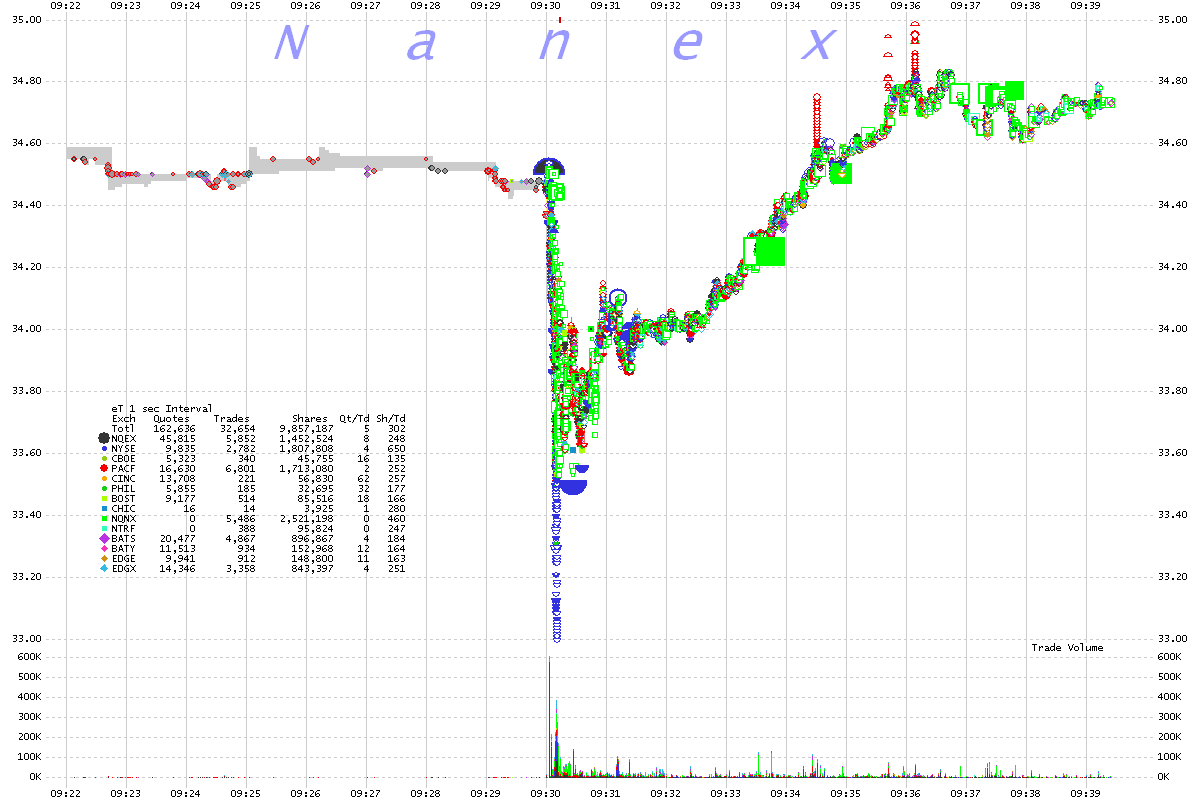
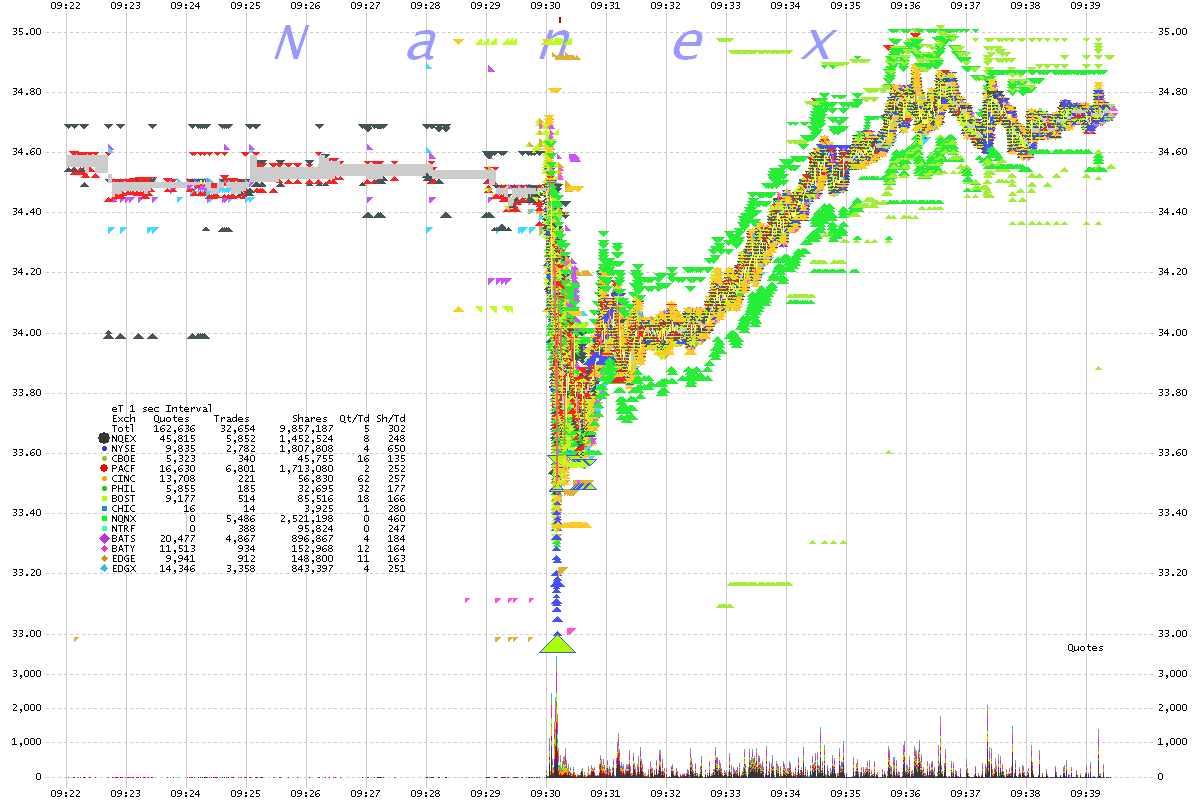
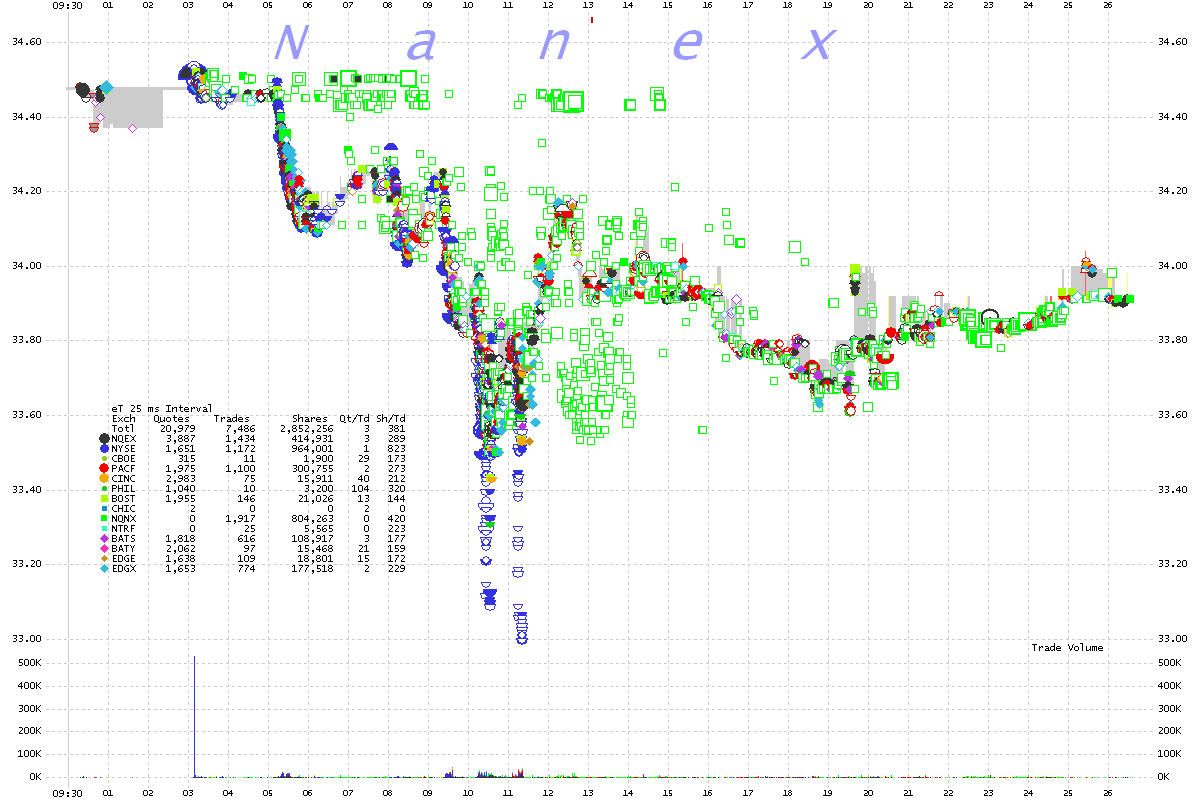
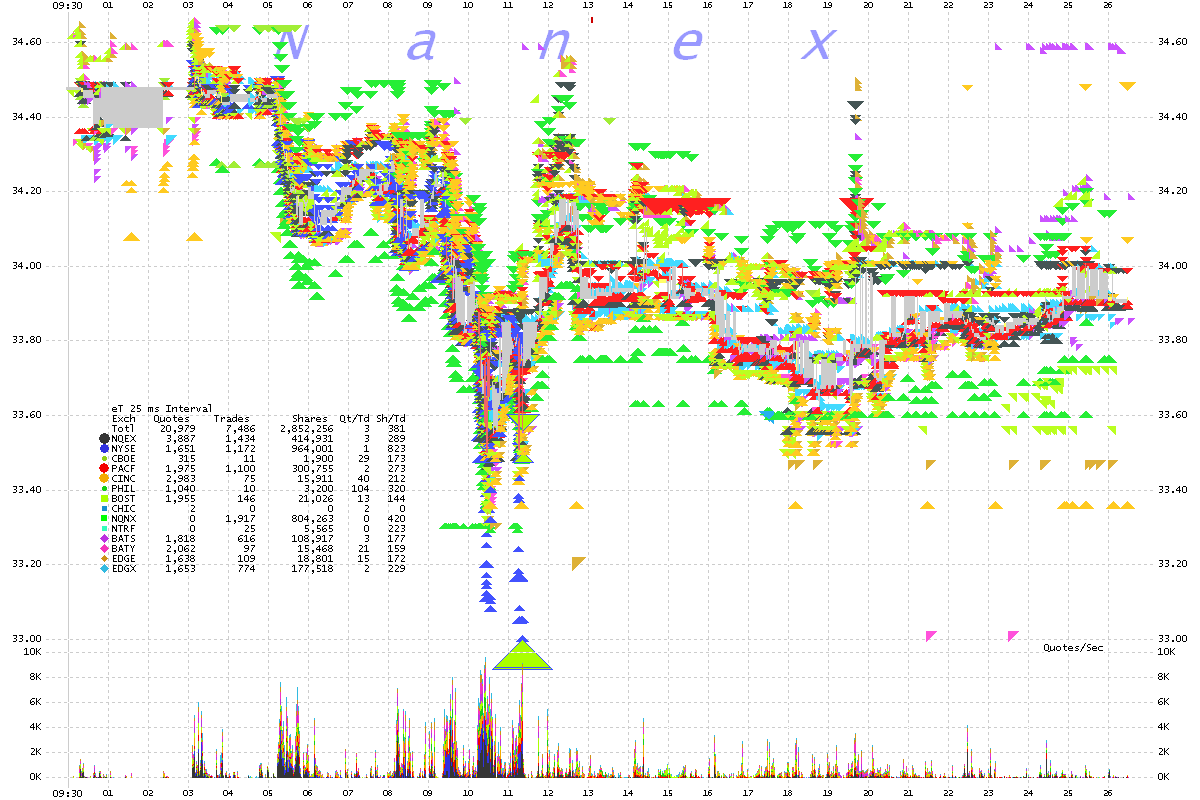
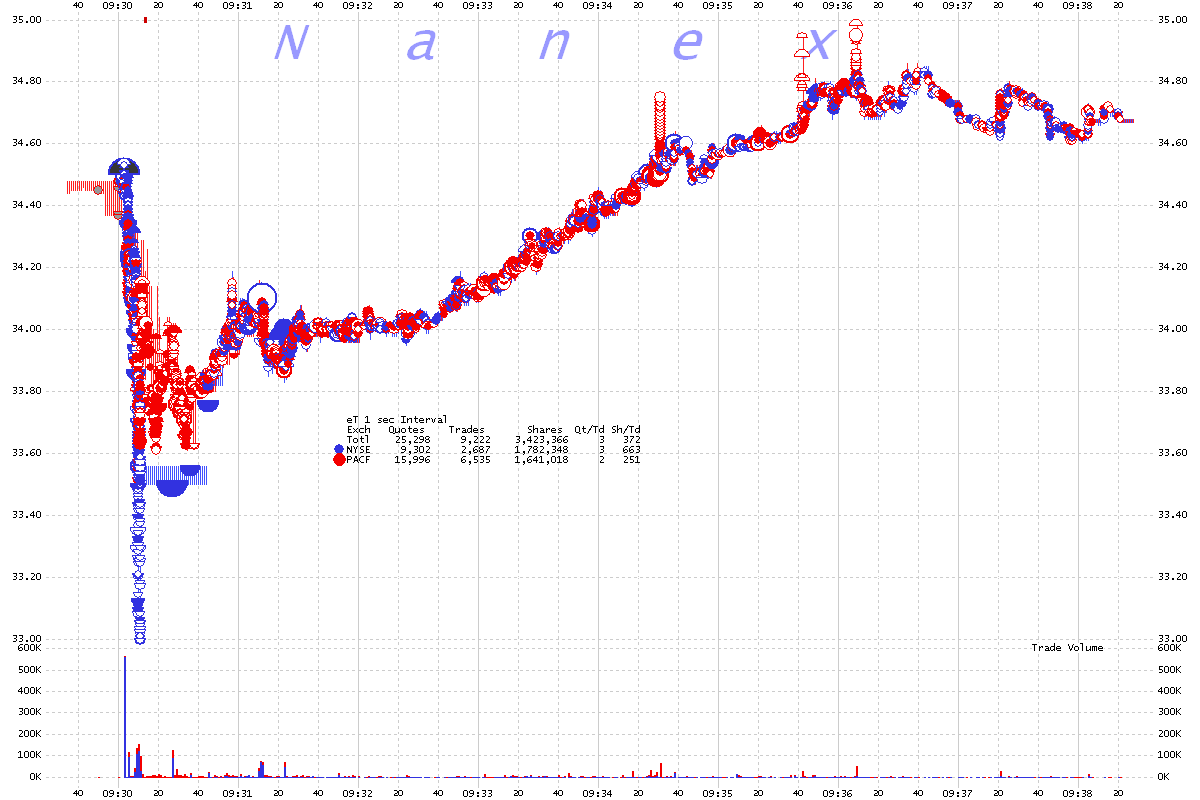
At the open of October 24, 2012, AT&T (symbol T) fell 4.3% over an 8 second period of
time. The stock fully recovered minutes later. The charts show market structure stress,
and epic miscommunication, and severe delays in valuable trading information - the life
blood of stock exchanges.
See also: tick charts of the
opening and A Failure to Communicate 2
1. T 1 second interval chart showing trades color coded by exchange.
2. T 1 second interval chart showing bids and offers color coded by exchange.
3. T 25 millisecond interval chart showing trades color coded by exchange.
4. T 25 millisecond interval chart showing bids and offers color coded by exchange.
5. T 5 millisecond interval chart showing trades color coded by exchange.
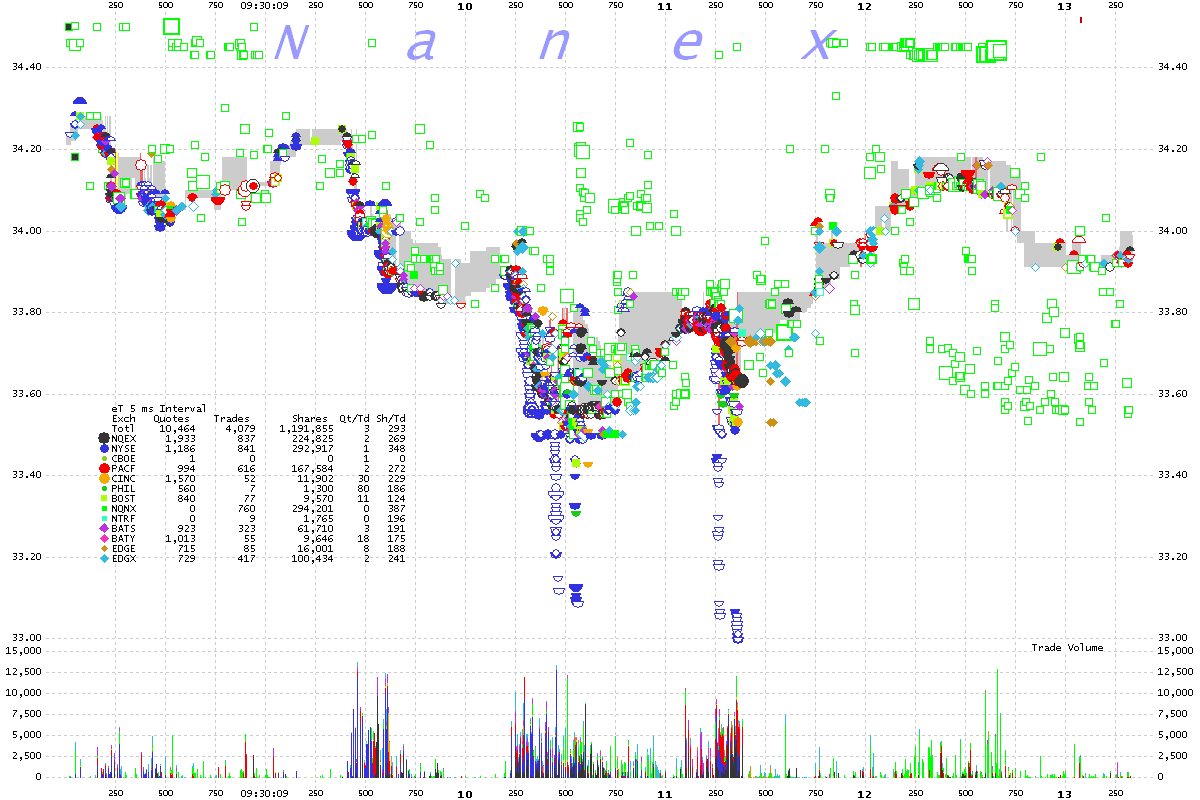
6. T 1 millisecond interval chart showing trades color coded by exchange.
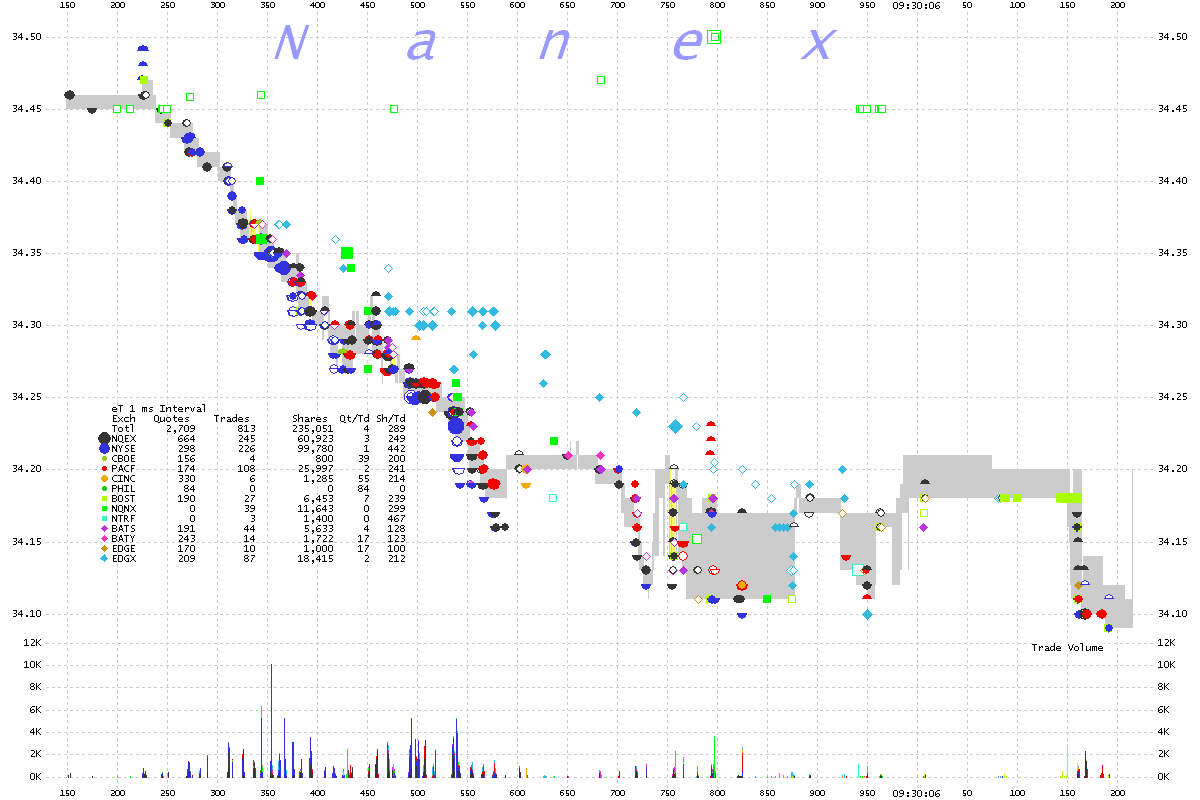
7. T 5 millisecond interval chart showing trades and quote spread for EDGX..
Note how the trades are reported late..
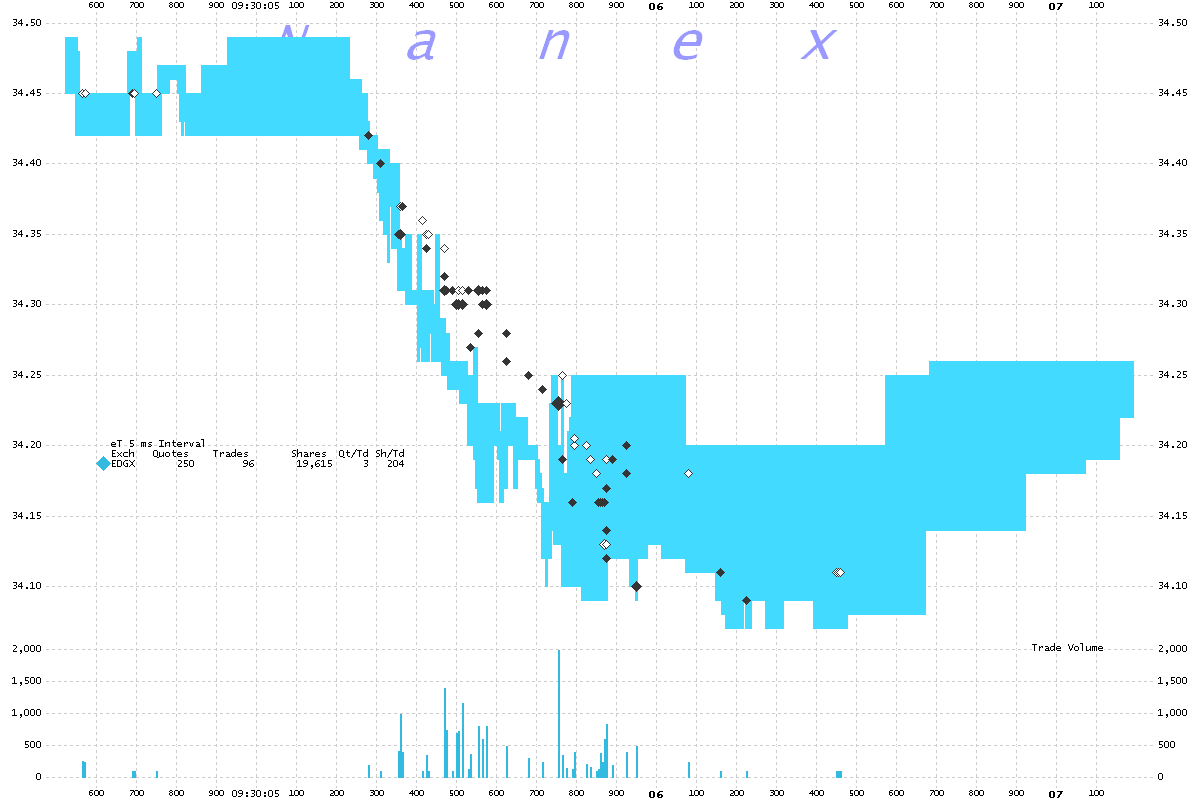
8. T 5 millisecond interval chart showing trades and quote spread for EDGX.
Trade are being reported late (behind quotes)
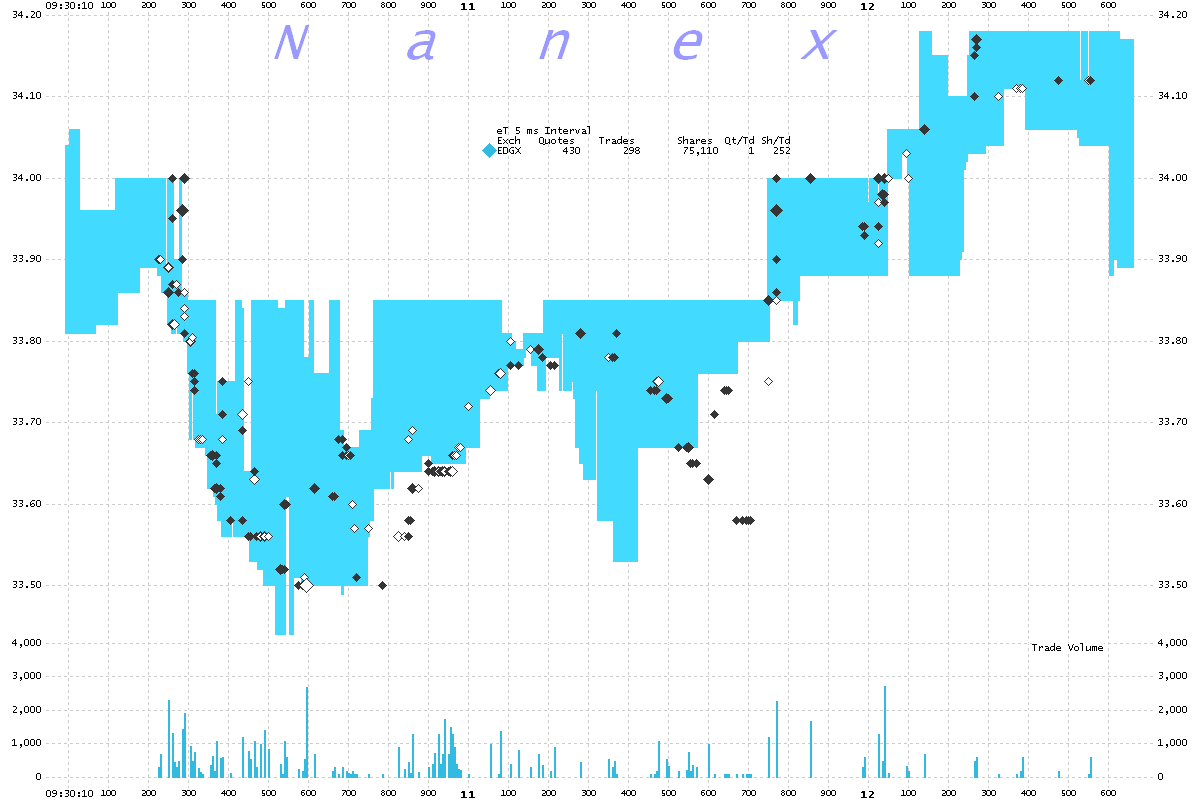
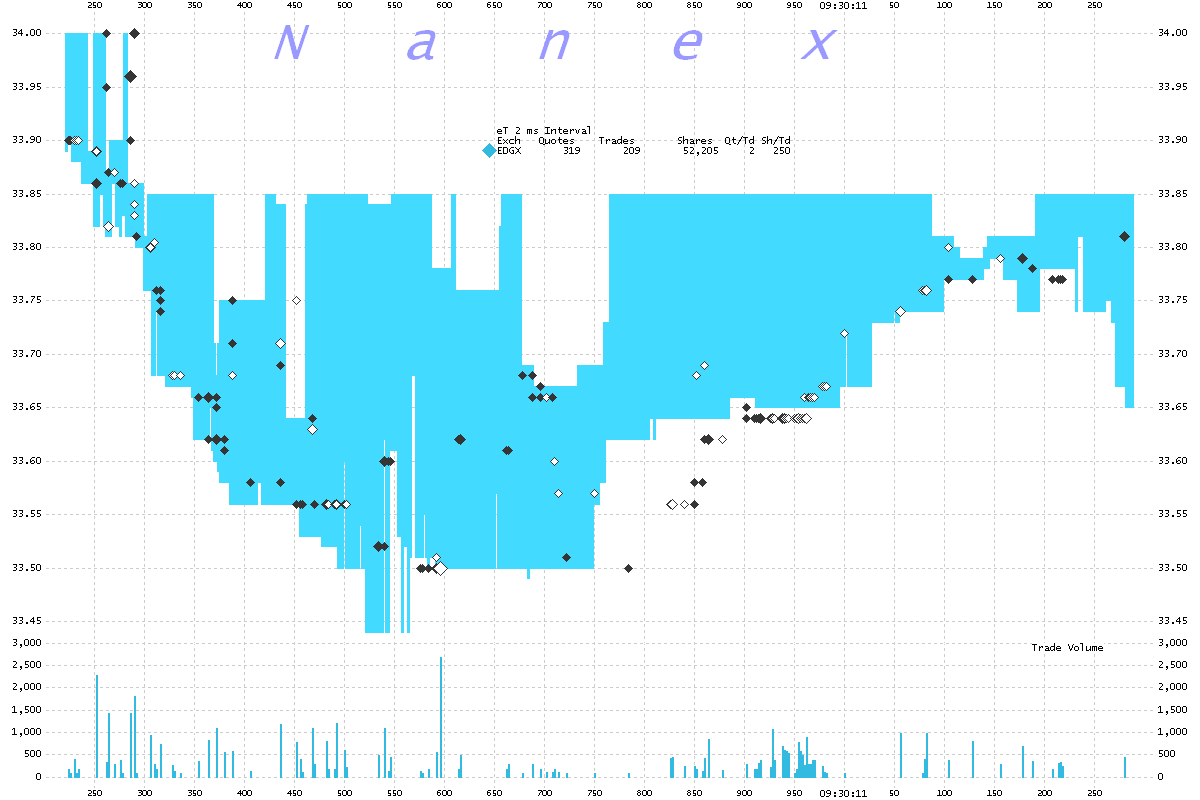
9. T 2 millisecond interval chart showing trades and quote spread for EDGX.
Trade are being reported late (behind quotes)
10. T 1 second interval chart showing trades and quote spread for NYSE and NY-ARCA
(PACF).
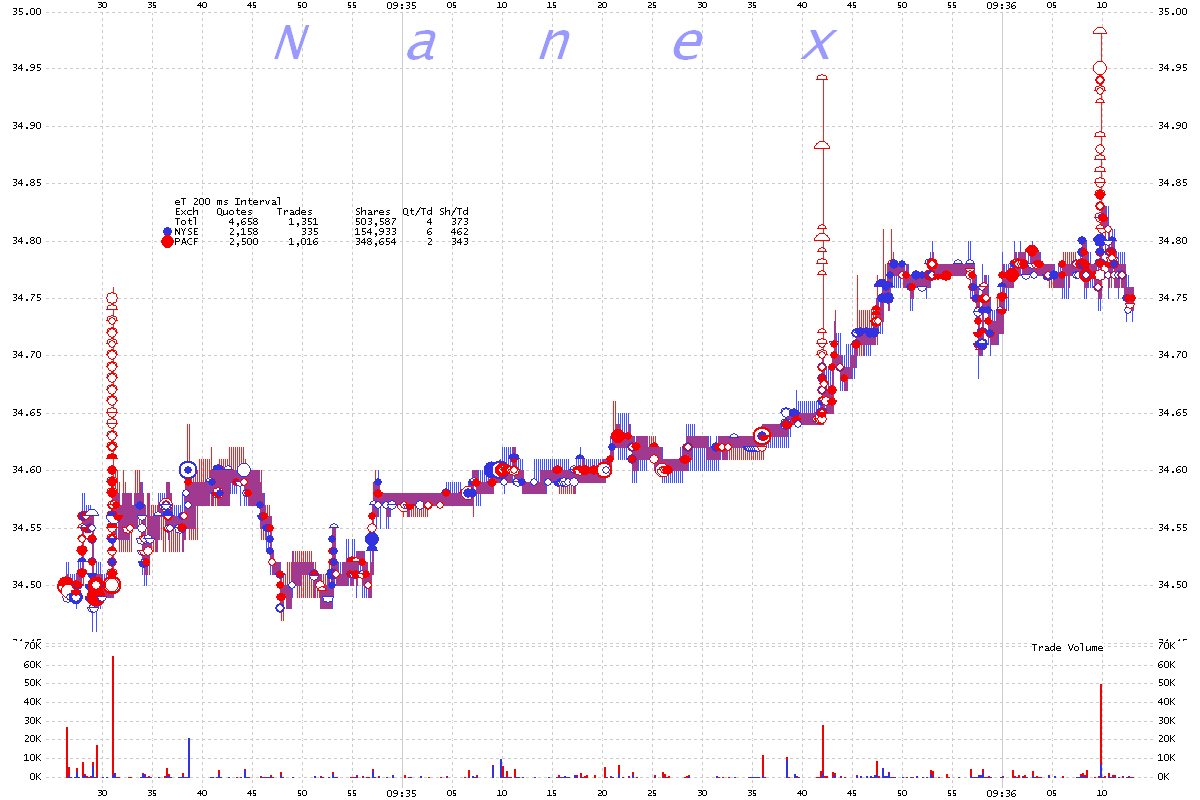
11. T 200 millisecond interval chart showing trades and quote spread for NYSE
and NY-ARCA (PACF).
Nanex Research
Inquiries: pr@nanex.net


