Nanex Research

Nanex ~ 25-Jul-2013 ~ The Gas and Oil Price Distortion Field
At 15:15 Eastern Time every trading day, Platts captures the prices of NYMEX Heating
Oil (symbol: HO) Futures (now called New York Harbor ULSD Futures)
and RBOB (symbol: RB) Gasoline futures. They chose this time
of day to align prices with exchanges in London: you can read all about it
here. Imagine our surprise that the most active seconds of
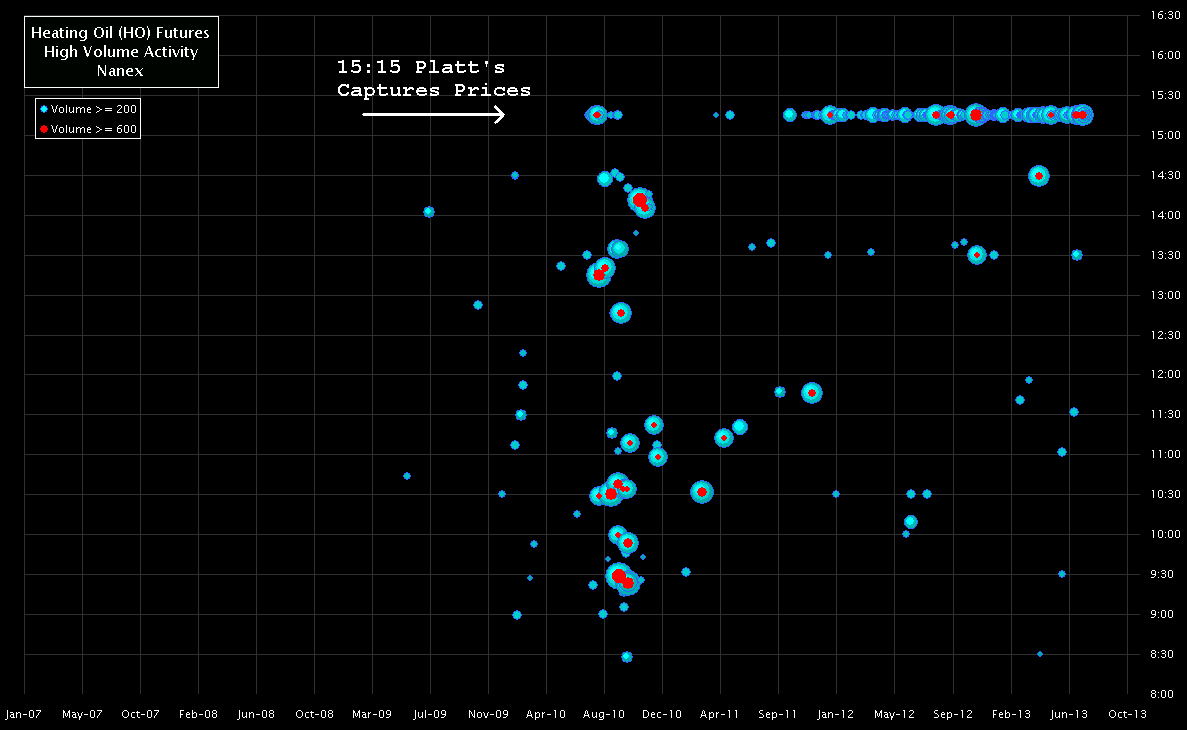
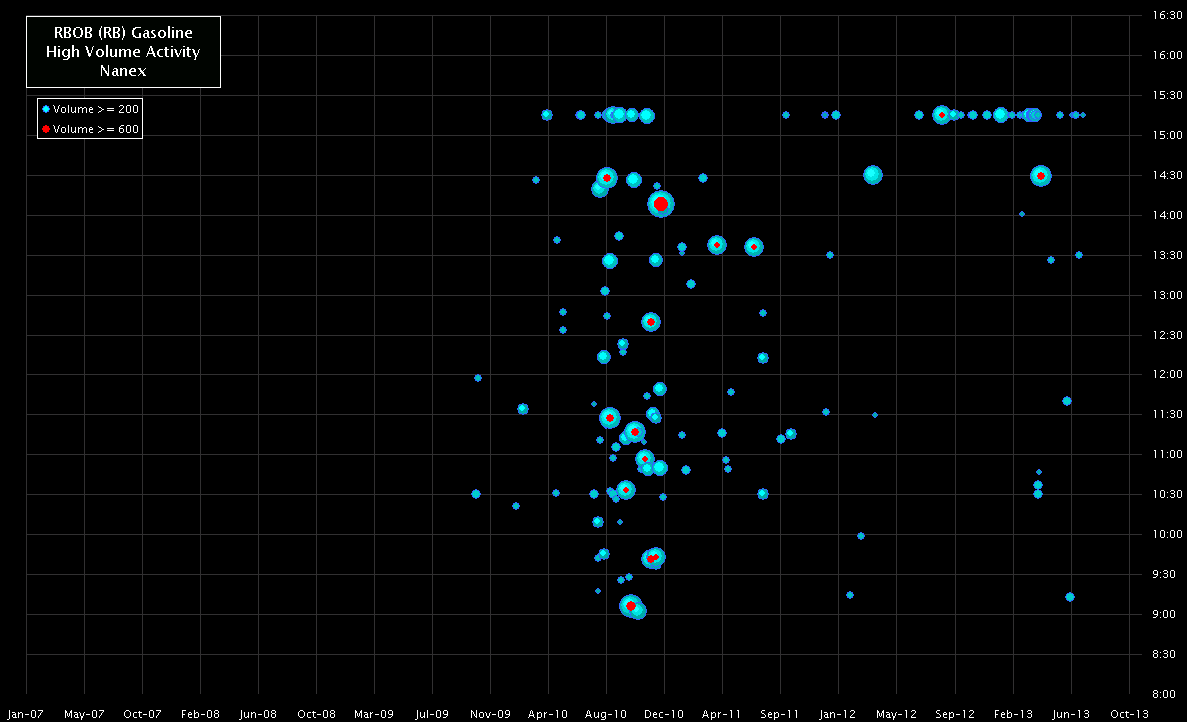
trading in HO and RB happen to be in the few seconds before 15:15pm ET - almost every
day. Looking closely at the prices of these futures during this time was even more surprising.
See for yourself in the charts below.
The first 3 charts show HO trading on July 16, 2013, Platts captured the price of $3.0546
(just 45 minutes earlier at 14:30, the trading session "closed" with an official settlement
price of $3.0469). Note that Platt's essentially captured the peak in the short term
price spike shown below! Now look a the charts below this first set, and you'll see
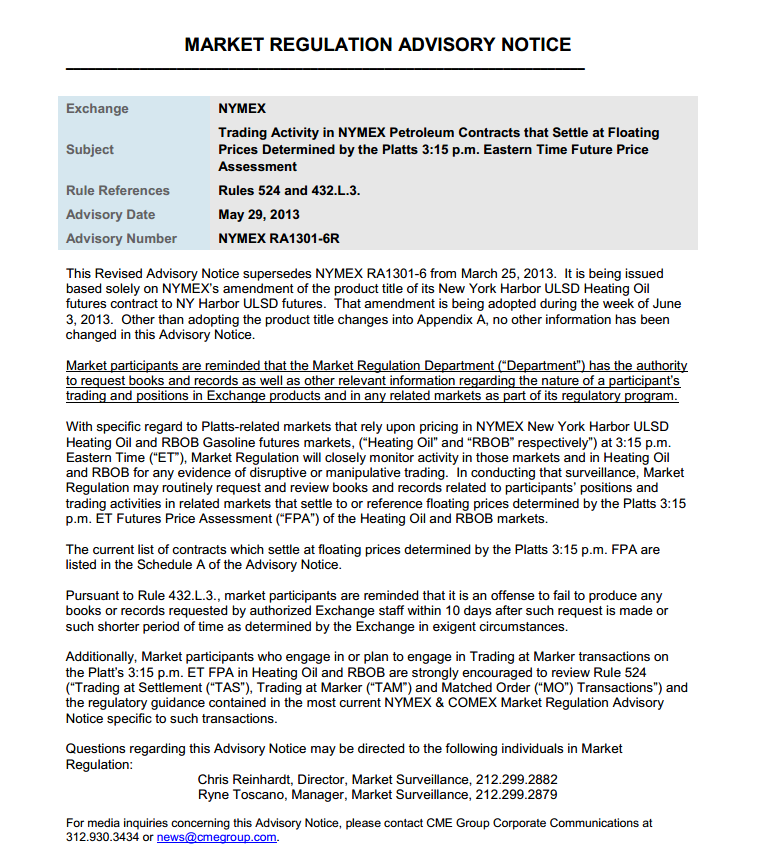
this happens often. Very often. Finally, read the notice the CME put out just a few
months ago.
When Heating Oil (HO) Futures activity peaks. See also
this page for similar charts of Crude Oil and Natural Gas (which
don't exhibit an explostion of activity at 15:15)

When RBOB Gasoline (RB) Futures activity peaks.

Now read this
this notice from the CME:

Nanex Research
Inquiries: pr@nanex.net


