Nanex Research

Nanex ~ 19-Nov-2013 ~ Fifth Third Bancorp's Wild Oscillations
On November 19, 2013 starting at 16:00:37 and continuing for about 10 seconds, a High
Frequency Trading (HFT) algorithm was let loose in the stock of Fifth Third Bancorp
(symbol: FITB,
market capitalization: $17.3 Billion, plus or minus $1 Billion every
second). The
stock price swung wildly, rapidly trading up and down in a 3-5% range many times over.
Just before this algo ran, the stock traded in a 25 cent range over the entire trading
day. This HFT algo sent prices up and down in a $1 range, which is 4 times larger than
the entire day's trading range.
During this algo's short 10 second reign:
- 330,000 shares traded which is 5% of the average daily volume in FITB (5 day average: 6,687,350)!
- Price swung over a $1.02 range which is 3 times the average daily trading
range.
The SEC has called this type of manipulation layering and occasionally even levies a
fine (read more here).
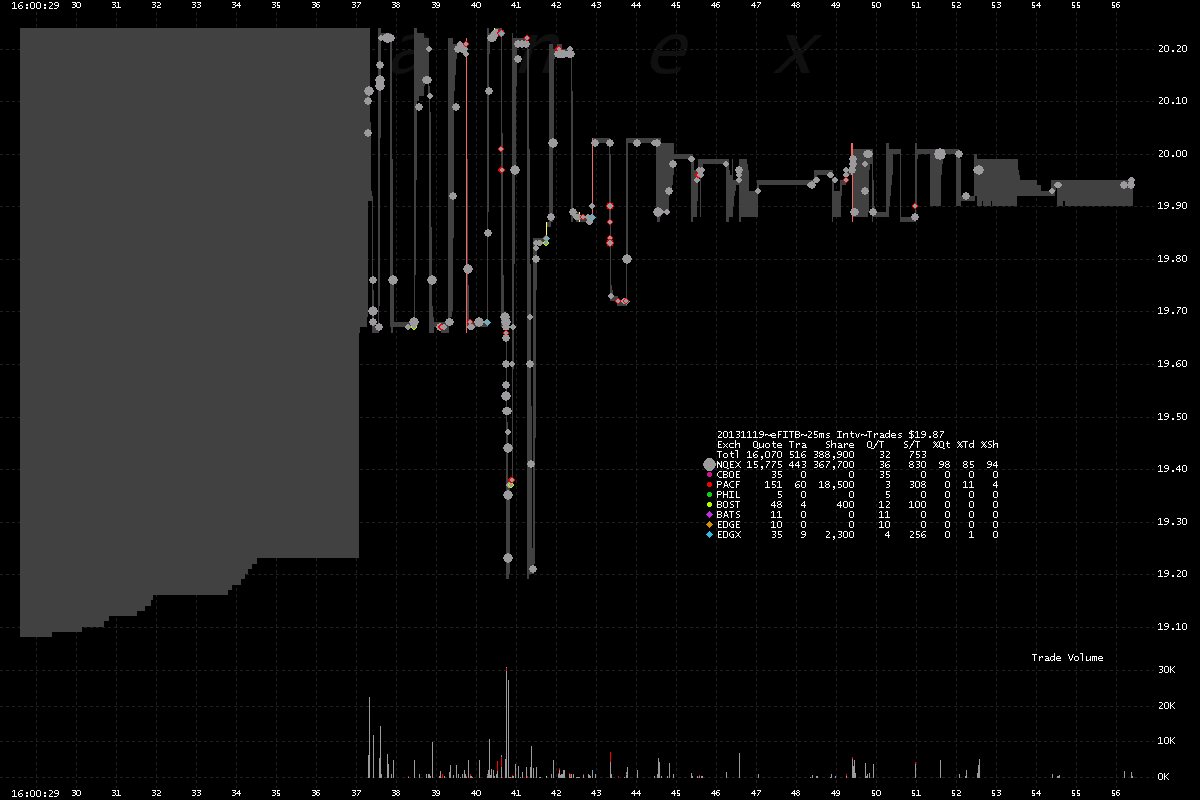
1. FITB - Trades color coded by reporting exchange and NBBO (gray/red shading).
One or more algos were fooled into buying high and selling low.
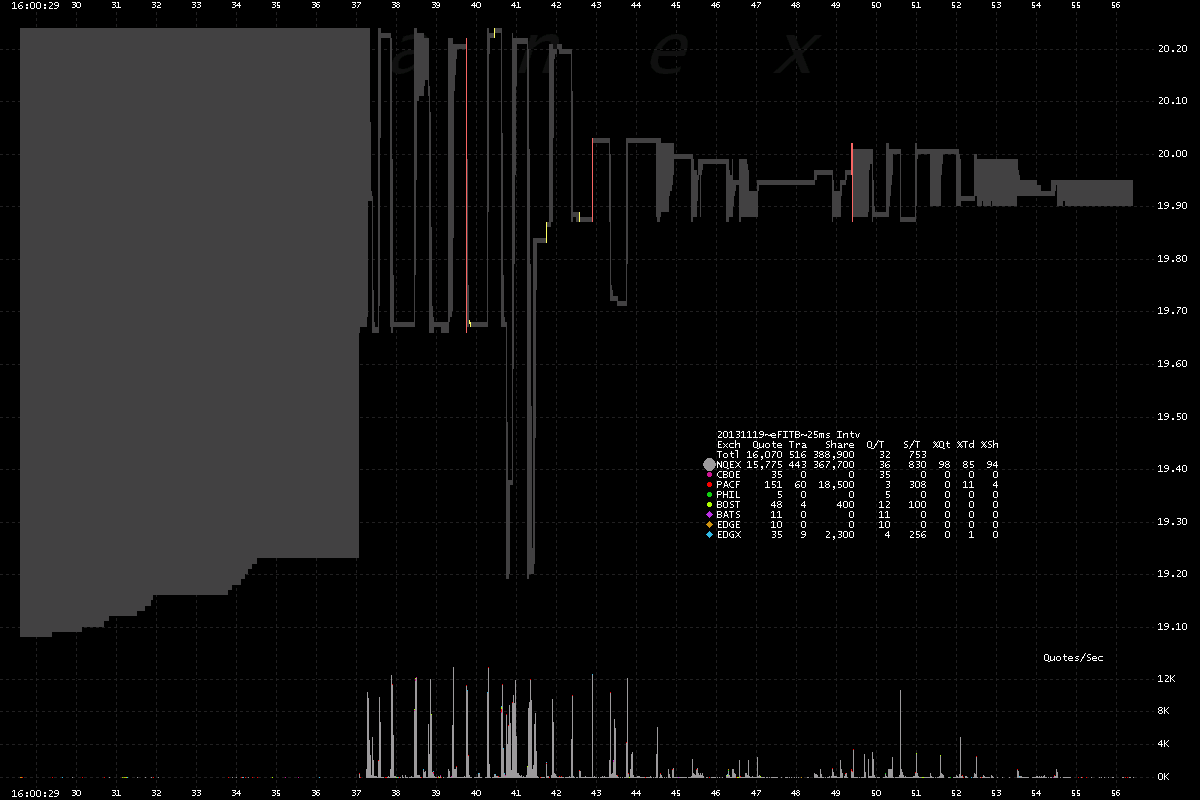
2. FITB - Showing NBBO: red is when it was crossed (bid price > ask price),
yellow when locked (bid price = ask price) and gray for normal.
Here we can clearly see the oscillations. Remember, this is spread between the best
bid and ask. While the spread itself remains narrow, the prices oscillate over a 3 to
5% range in less than a second.
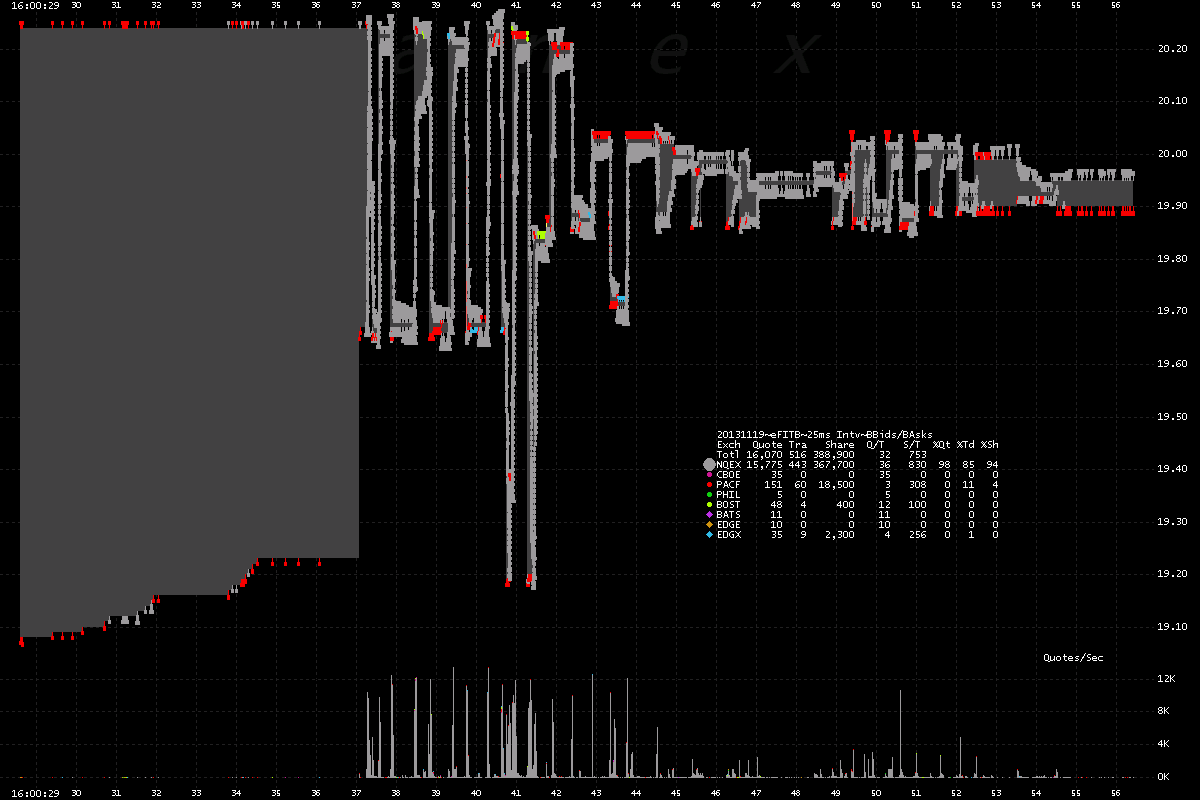
3. FITB - Best bids and offers color coded by reporting exchange.
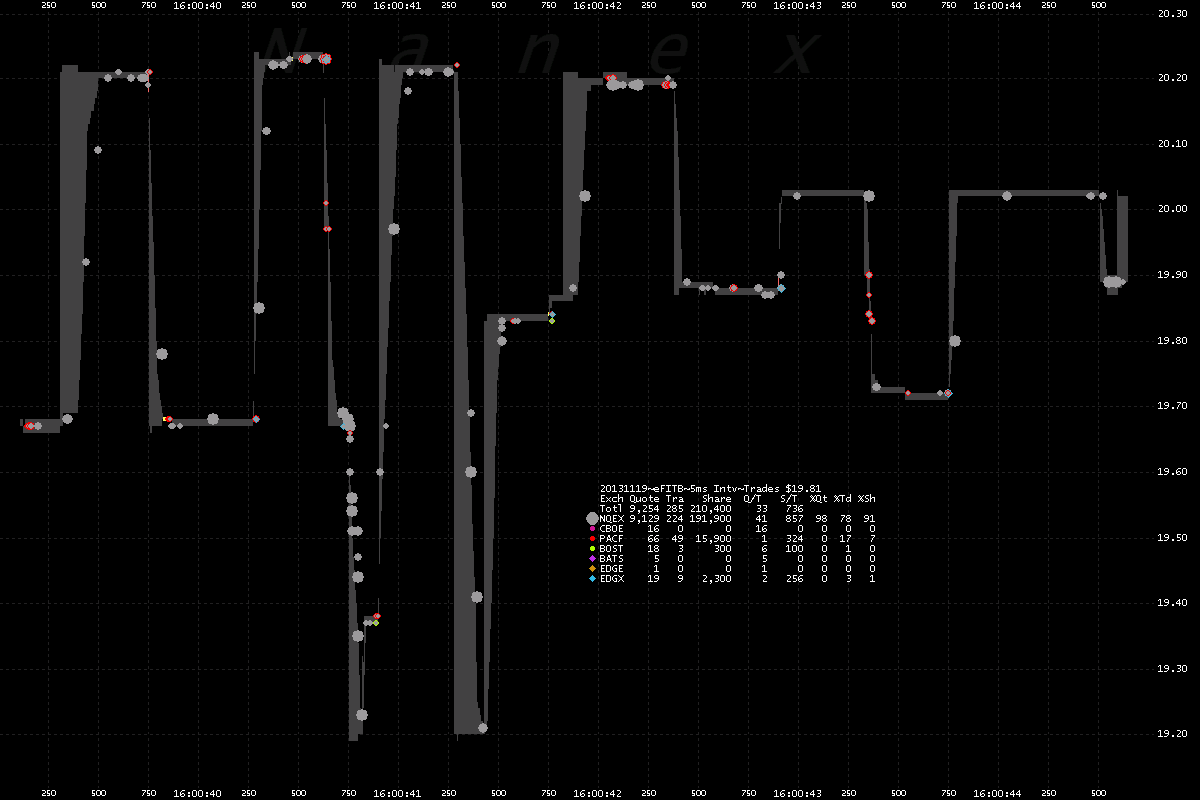
4. FITB - Zooming in on the trades (circles) and NBBO over a 5 second period
of time.
5. FITB - Zoom of the best bids and asks.
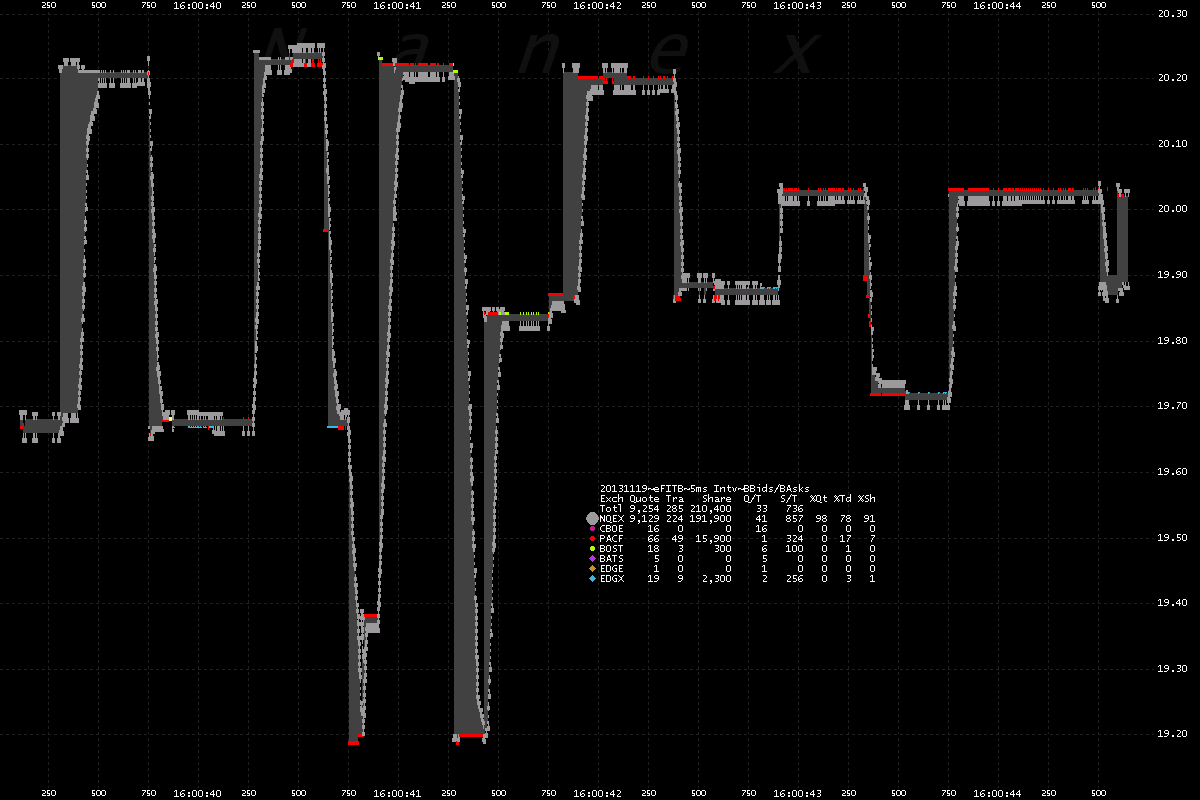
6. FITB - Zoom of all bids and asks.
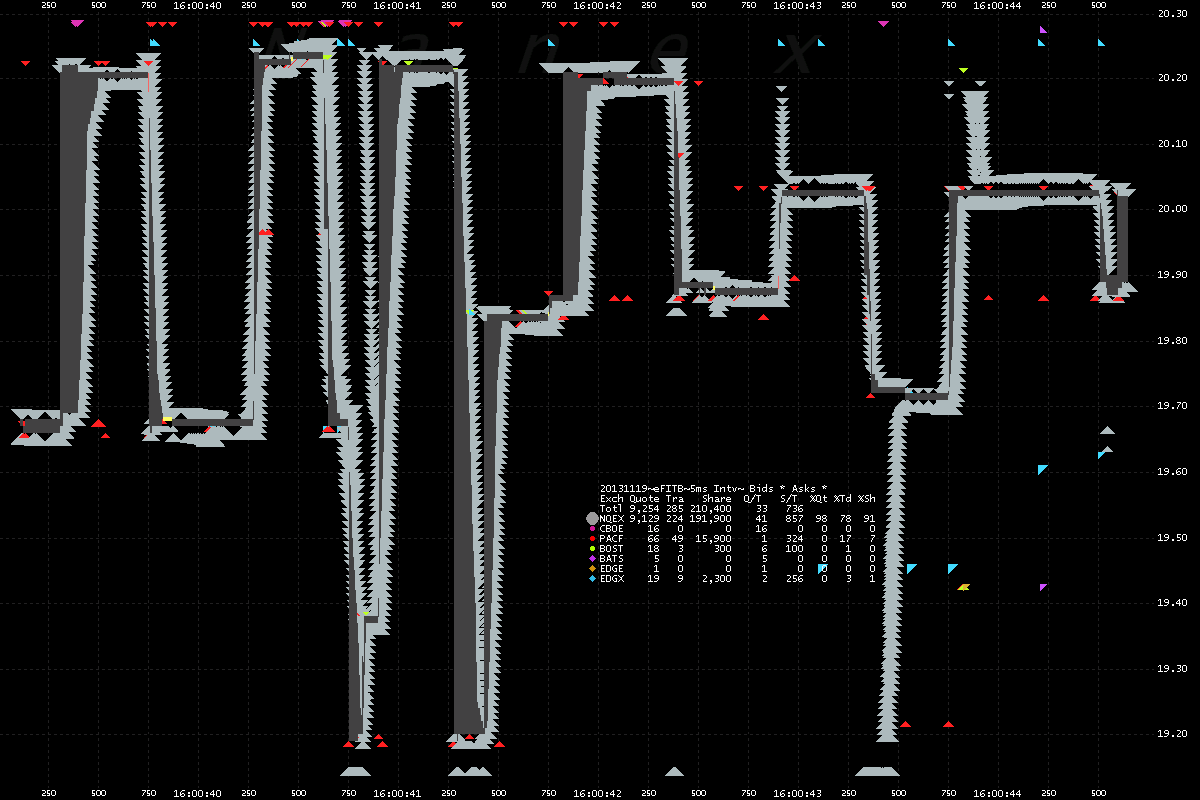
Nanex Research
Inquiries: pr@nanex.net


