Nanex Research

Nanex ~ 06-Feb-2014 ~ DAX Crash and Burn


Update February 19, 2014: New post on this event: Revisiting the DAX Crash

Update February 12, 2014: DAX Options Trades During Halt

Update February 7, 2014: Did trading activity start in the US before Europe?


ECB news release at 7:45 leads to a runaway crash on DAX. Just 10 months earlier, Deutche Borse Group made this bold claim in a tweet to Nanex (@nanexllc):


See also a similar issue (but to the upside) in HSBC on the London Stock Exchange the previous week, and DAX Flash Crash 2, which occurred just a month after Deutche Borse sent the tweet.


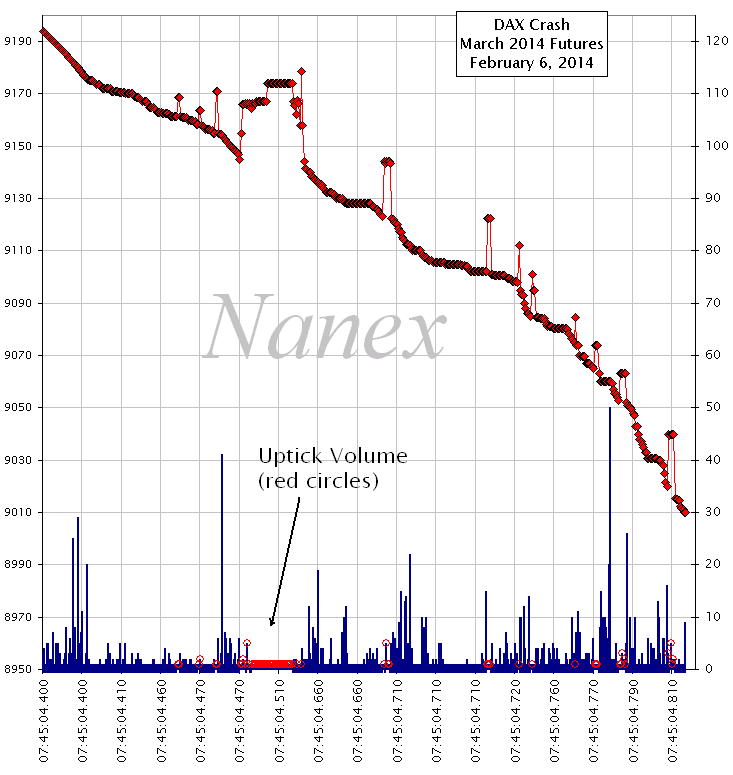
1. March 2014 DAX Futures Tick Chart.
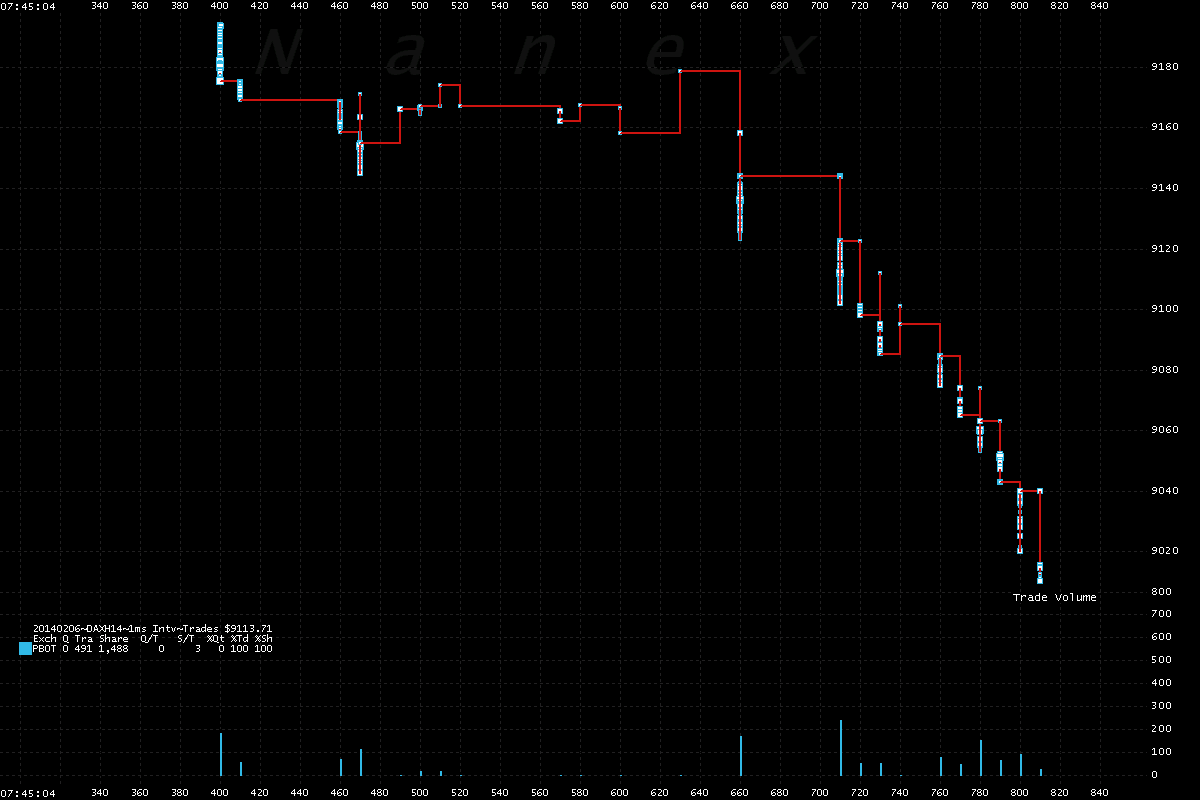
The upticks in the chart below negate the cause as a single market order or stop run. Red circles over blue volume bars indicates uptick volume. Spreadsheet of volume and trades by price level.


2. March 2014 DAX Futures Trades.
The price dropped from 9194 to 9010 in 410 milliseconds on 1488 contracts in 491 trades.


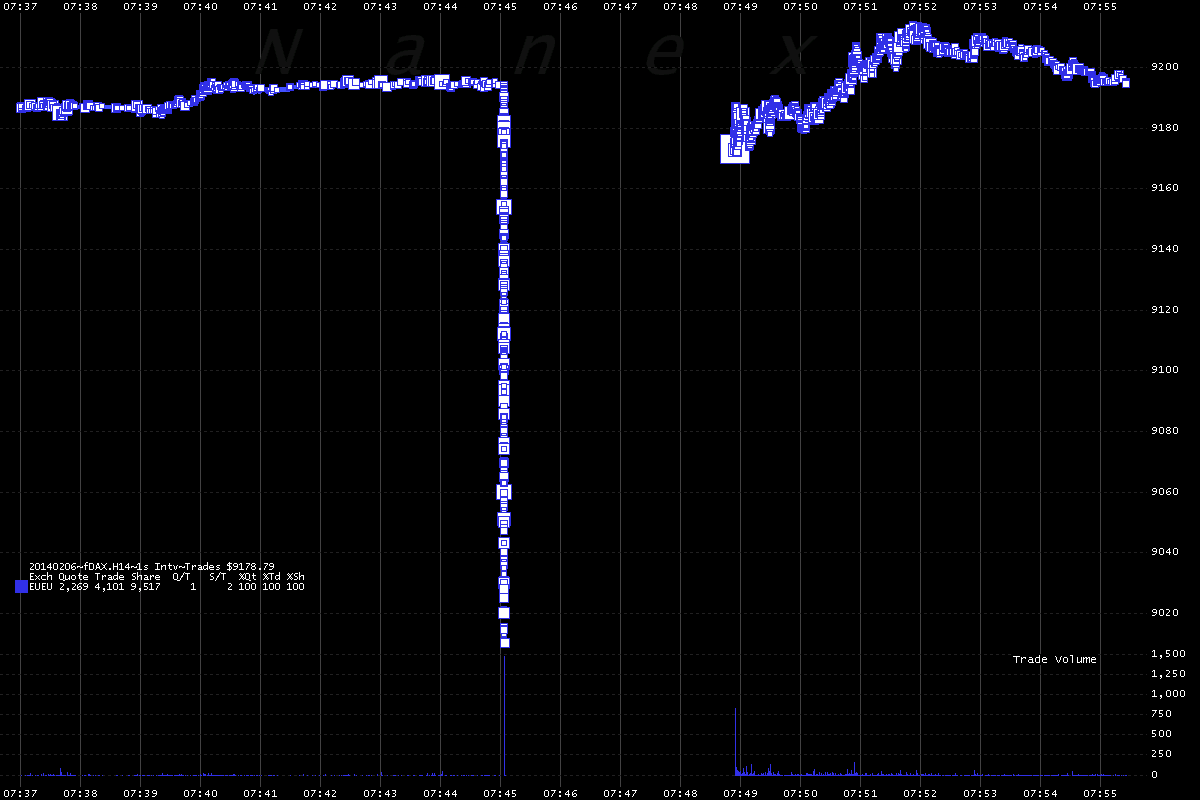
3. March 2014 DAX Futures Trades - 1 second resolution.
Not just one bad price, but trades all the way down. At this resolution, it appears to be from a large market order or out-of-control stop run. But close inspection (above) reveals upticks during the drop, which rules out a simple market or stop order. 

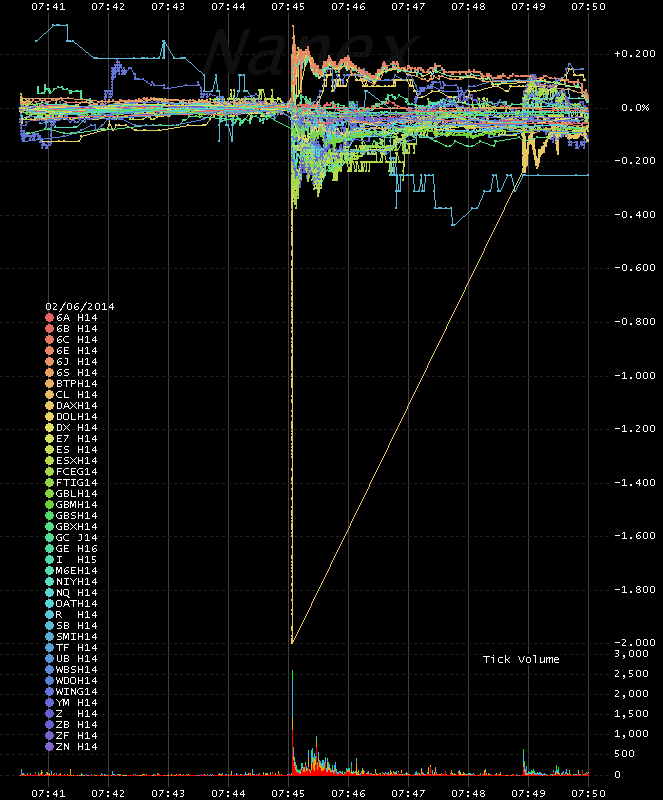
4. The most active futures contract during the 7:45 ECB news release, showing net change in price from 7:45.
The DAX clearly stands out - note that it drops exactly 2% before halting.


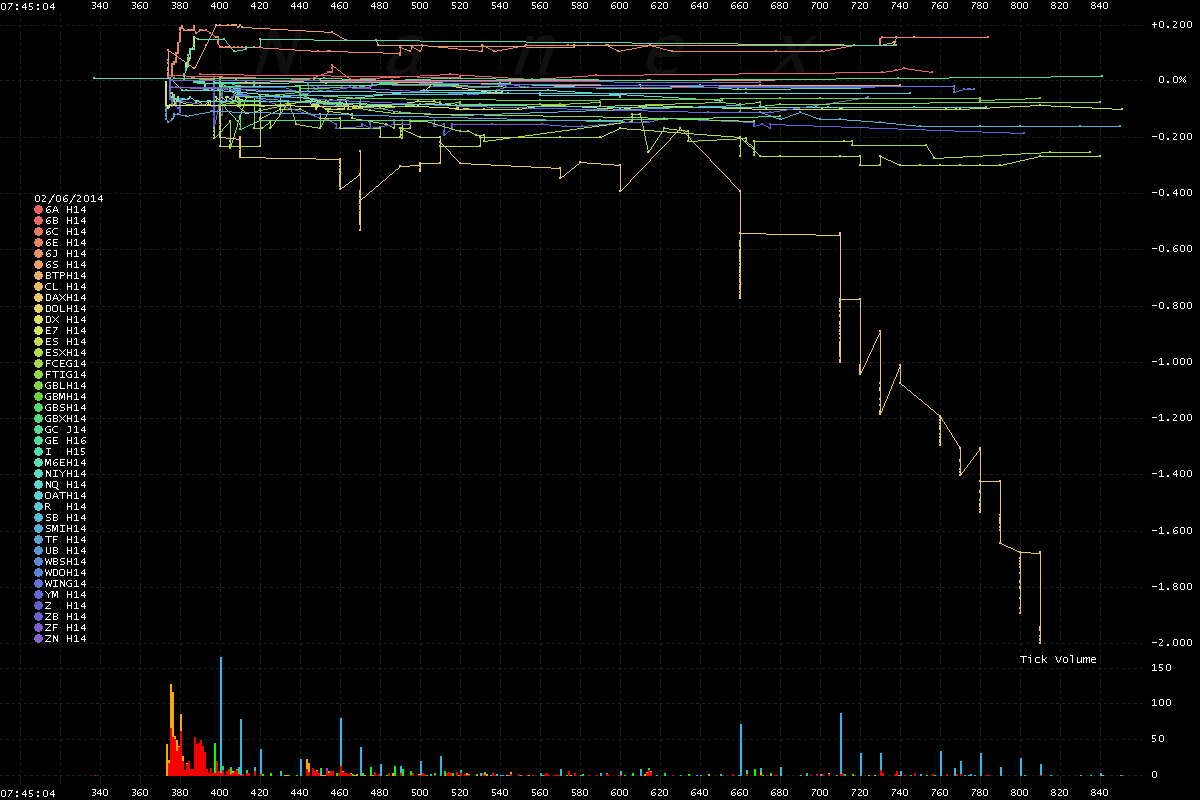
5. Zooming in to 0.5 seconds of time.
The DAX did not move first.


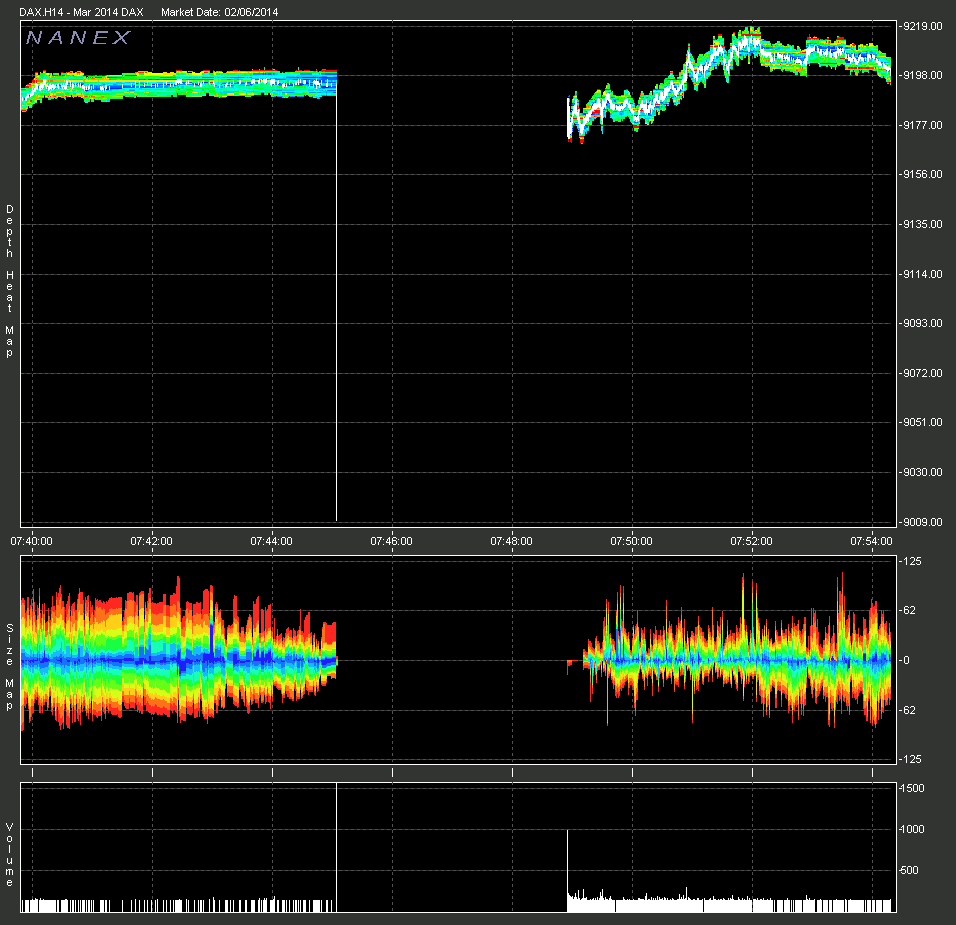
6. March 2014 DAX Futures Depth of book.
Showing the trading halt.


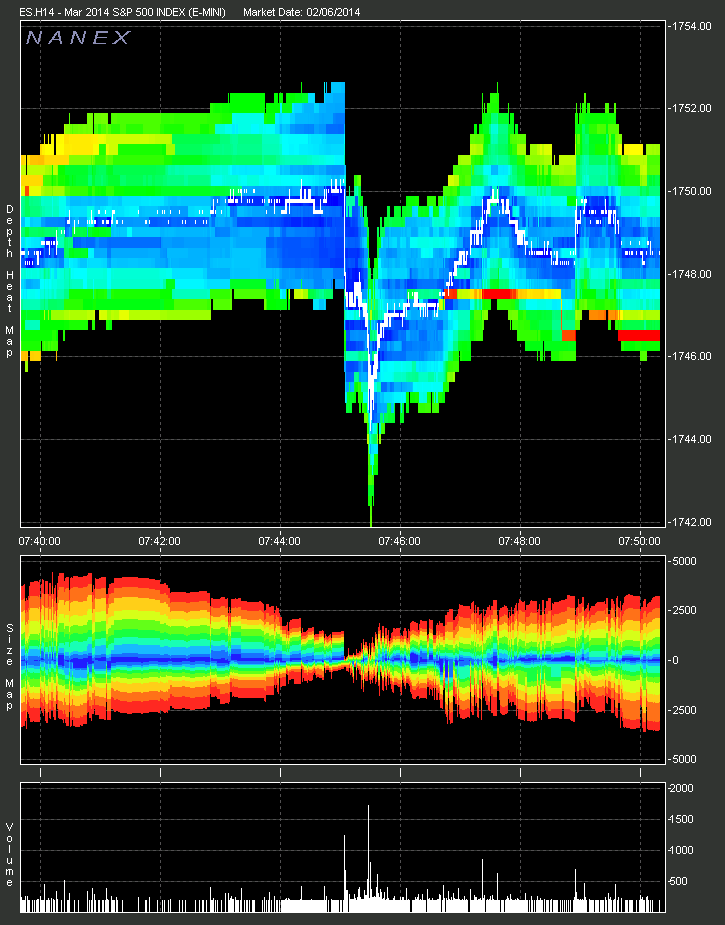
7. March 2014 eMini (ES)Futures Depth of book.
eMini also drops on ECB news.


Update February 7, 2014

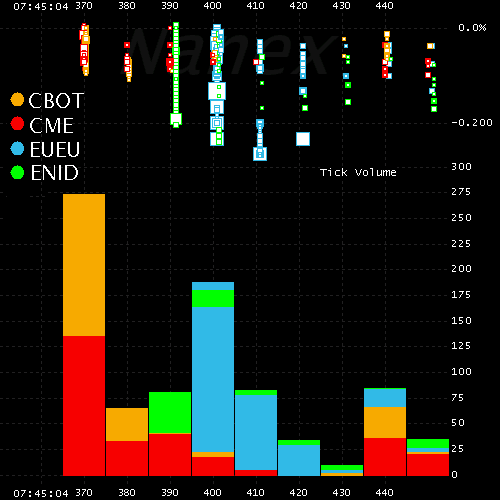
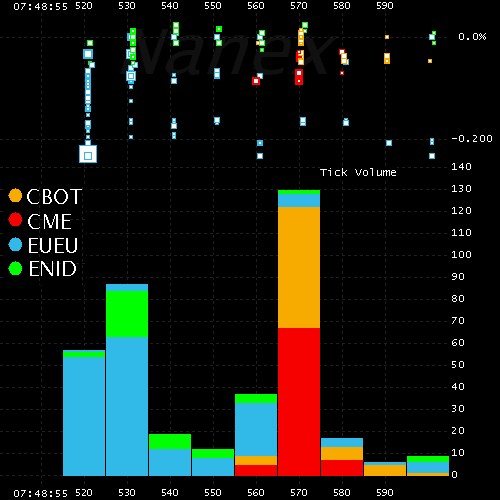
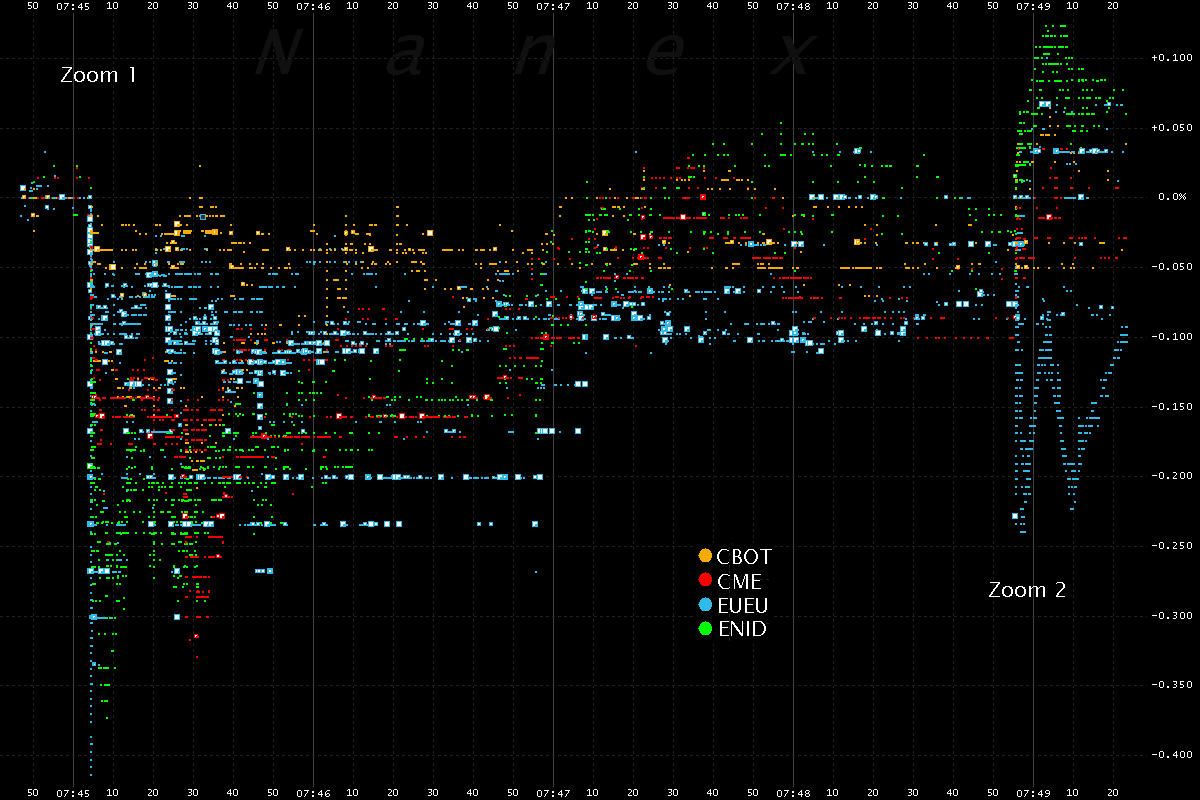
If we look closely at the time when markets first reacted after ECB news was released (7:45:04 ET) and compare it to the time when DAX trading resumed from the halt (7:48:55), we find somewhat of a mystery. Namely the order of trading activity differs substantially in the two time periods labelled Zoom 1 and Zoom 2 on the chart below.

Right after the ECB news release at 7:45 (Zoom 1) we see that markets in Chicago (CME - red, CBOT - orange) trade about 20 milliseconds before markets in Europe (EUEU - blue, ENID - green). But when the DAX resumes trading (Zoom 2), we see that Chicago doesn't react for 40 milliseconds. The delayed reaction in Chicago is expected due to the distance from Europe and the speed of light and the fact that a timed news service wouldn't likely carry information on when the DAX halt lifted. That lets us confirm that the timestamps (which come from the exchange) are properly synchronized. Which leads us to wonder why Chicago traded ahead of Europe. It could be that the timestamps between Europe and Chicago are off a little - our European data has timestamps at 10 millisecond resolutions, while the U.S. market data timestamps are in milliseconds. Taking that into account, the disparity is still higher than expected. The evidence so far points to a possible earlier release of ECB news in Chicago, but this isn't nearly as conclusive as what we found in The Great Fed Robbery. It might be worth investigating, but we are going to pass on going down that rabbit hole.

8. Comparing Select Futures contracts traded in Chicago (red/orange) with those traded in Europe (blue/green).


Comparing the ECB news release time period with the DAX trading resumption period. Note how the Orange/Red (Chicago) appear first in Zoom 1 by 20 milliseconds, while the Blue/Green (Europe) appear first in Zoom 2 by about 40 milliseconds. It takes about 40 milliseconds for information to travel from Europe to Chicago due to the speed of light.
Zoom 1 - ECB News Release Zoom 2 - DAX Resumes Trading


Update February 12, 2014

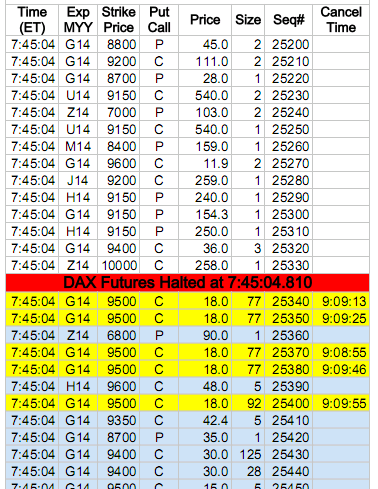
Trades in DAX Options around the time of the halt provides additional clues as to what happened. The only DAX options trades canceled that day by the exchange (including all symbols) were DAX  options that traded right after and during the halt.

However, not all options traded during the halt were canceled. The first part of the list is shown in the image on the right (download the full list).

Trades are arranged by time and sequence number. Canceled trades are highlighted in yellow and include the time they were canceled - all about an hour and 20 minutes later. The canceled trades all have large (and similar sizes). The trades highlighted in light blue executed during the halt in DAX futures.

The option trades during the halt would have been very profitable (or a great loss for the other party). We didn't calculate the amount, but there is enough information to make a reasonable estimate.

The length of the halt in DAX futures, a whopping 3 minutes and 51 seconds, is an exceptionally long time.


Nanex Research

Inquiries: pr@nanex.net