Nanex Research

Nanex ~ 1-Jul-2014 ~ The Odd Lot Bot

Painting the tape and causing latency in one algo.


There is a new High Frequency Trading  (HFT) Algo afoot, probably designed to measure, or cause system latency. This algo sends extreme bursts of 1-share orders in a symbol to two different exchanges: Nasdaq and BATS. The result is a system-impacting surge of quote updates, similar to quote stuffing, but accompanied by an extremely high number of 1-share trade executions. These trade executions often consume the entire SIP output line, as indicated by continuous sequence numbers with no gaps.

Other observations:
  • The algo seems to prefer low, to very low priced stocks.
  • The price executed at both Nasdaq and BATS is always the same - this isn't from arbitrage.
  • The burst of trades is accompanied by a burst of quotes.
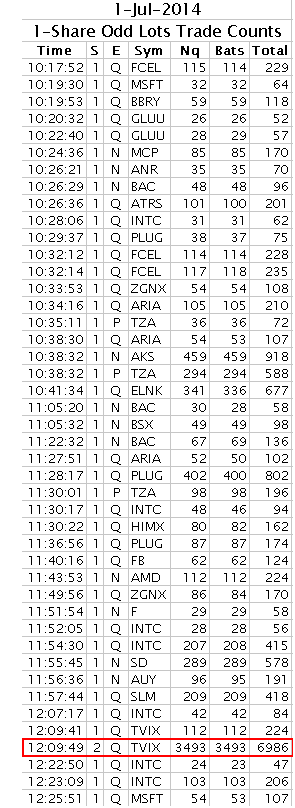
The table on the right shows a list of events we detected on July 1, 2014. Take a look at the event outlined in red. This event involved the symbol TVIX which traded at $2.89. At 12:09:49, over a 2 second period, there were 6,986 trades in TVIX: 3,493 executed on Nasdaq, and 3,493 executed on BATS. Every one of these trades was for a single share which cost $2.89 each.

Now take a look at the graph on the left. It plots these events as colored bubbles, with each bubble sized according to the number of trades during the event. Extreme events show up as large bubbles - such as the TVIX event which is the largest bubble. The vertical axis shows the time of day, and each day's events are plotted along a vertical line. This helps to see if the algo runs at certain times of the trading day.

The bubbles are color-coded depending on which combination of exchanges are involved - in this close-up of 4 days, only one other exchange combination appeared - Phil and BATZ (green).

The bubble labeled GLUU was the most extreme of these events, until it was superceded by TVIX, which happened while we were writing this paper.

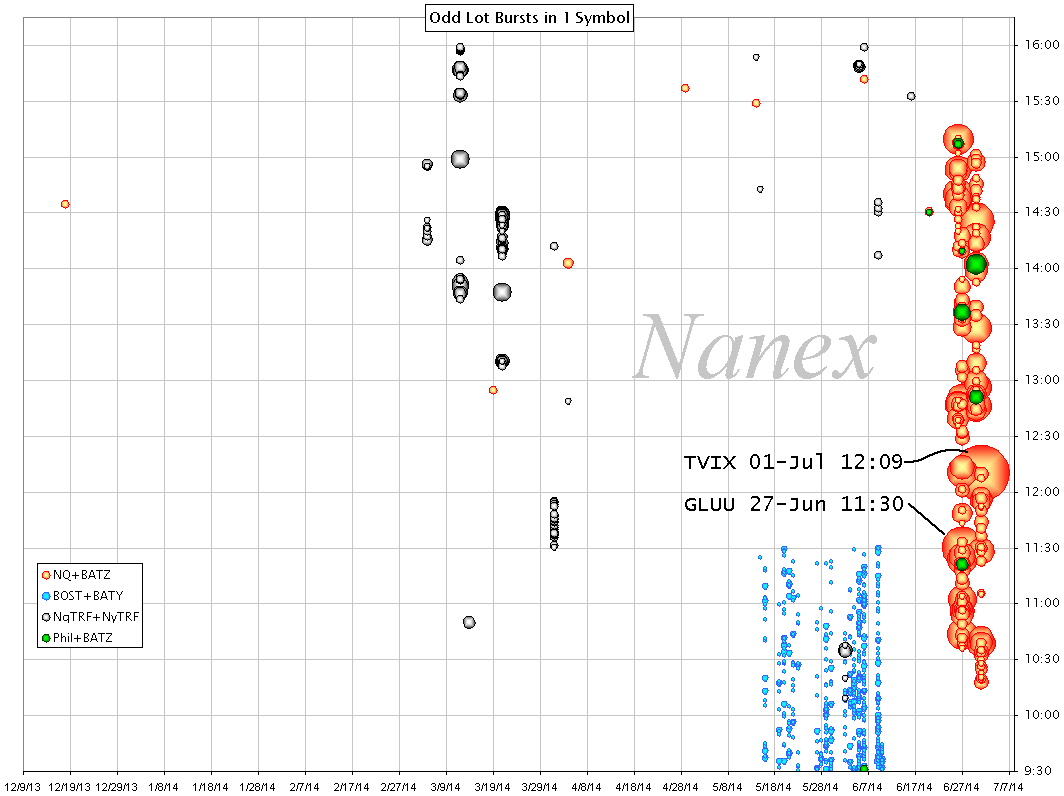
If we expand the chart and look further back in time, we find that the NQ+BATZ combination is new. The columns of large orange bubbles make a significant appearance on June 26, 2014, which coincidentally or not, is the first trading day after the New York Attorney General announced it was suing the Barclay's Dark Pool (this is a must read). We aren't sure if the two are related, but it's possible. Maybe a HFT got kicked out of a dark pool and is figuring out a new way to game the system.


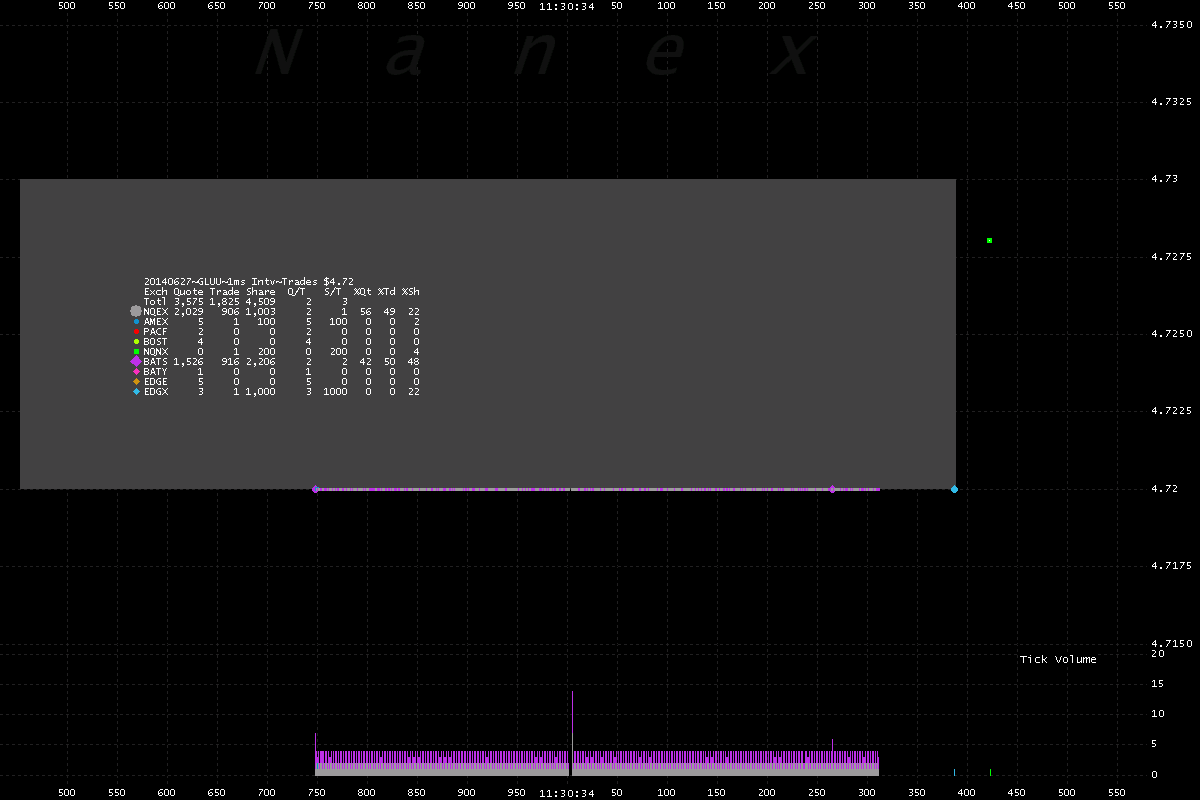
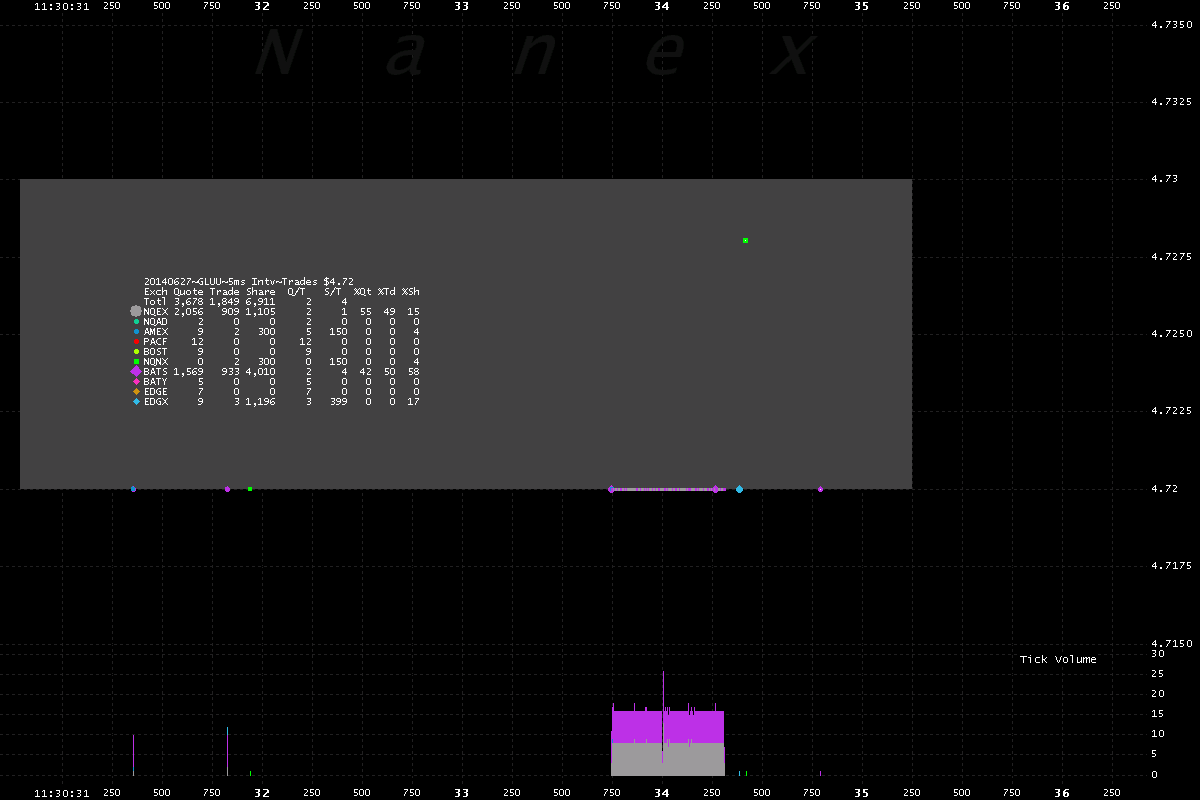
Here's a close-up chart of the event in GLUU. It's not very exiting, just a spotted line representing the surge of trades.

1. GLUU Trades on June 27, 2014 over 1 second of time starting 11:30:33.500.


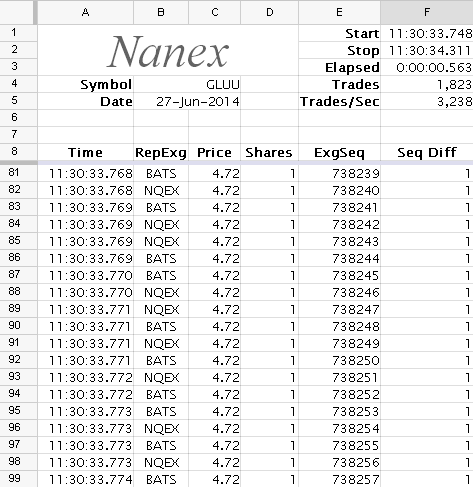
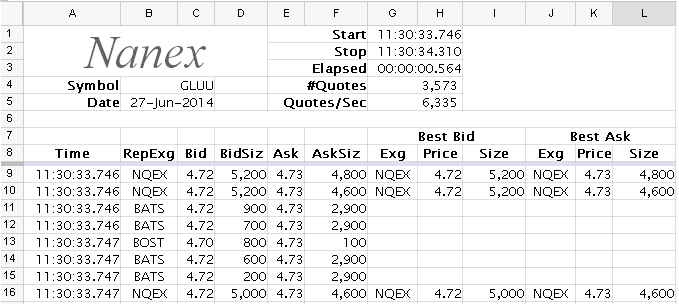
The image below shows quote statistics along with the first few quotes (out of 3,573) involved in this event. The image on the right shows trade statistics, and a sample of 19 trades. You can see how trades alternate between Nasdaq (NQEX) and BATS (sometimes there will be a slightly different pattern). Note the last column - which would indicate a sequence gap if the value was other than 1. This means no other trades are being reported from the SIP on this multicast line - (GLUU shares the line with other Nasdaq listed symbols beginning with the letters FE to LM). Also note the first column shows 3 to 4 trades each millisecond - which is a rate of 3,000 - 4,000 trades/second which is close to maximum capacity.


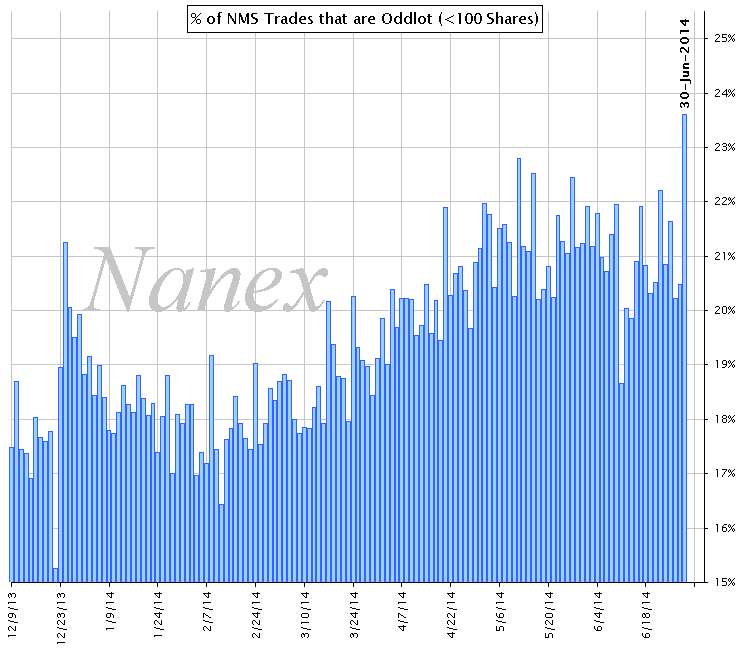
The Oddlot Bot may explain why the percentage of trades that are odd lot is at a record high (23.6%).

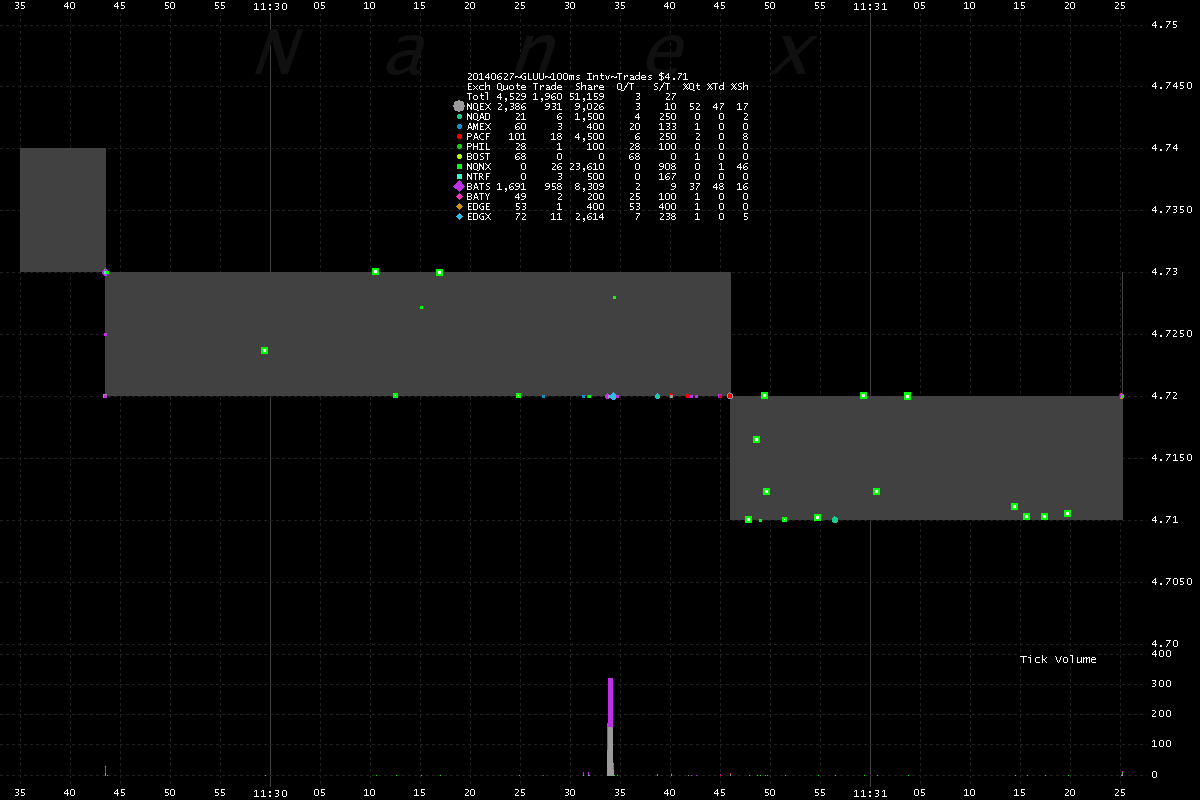
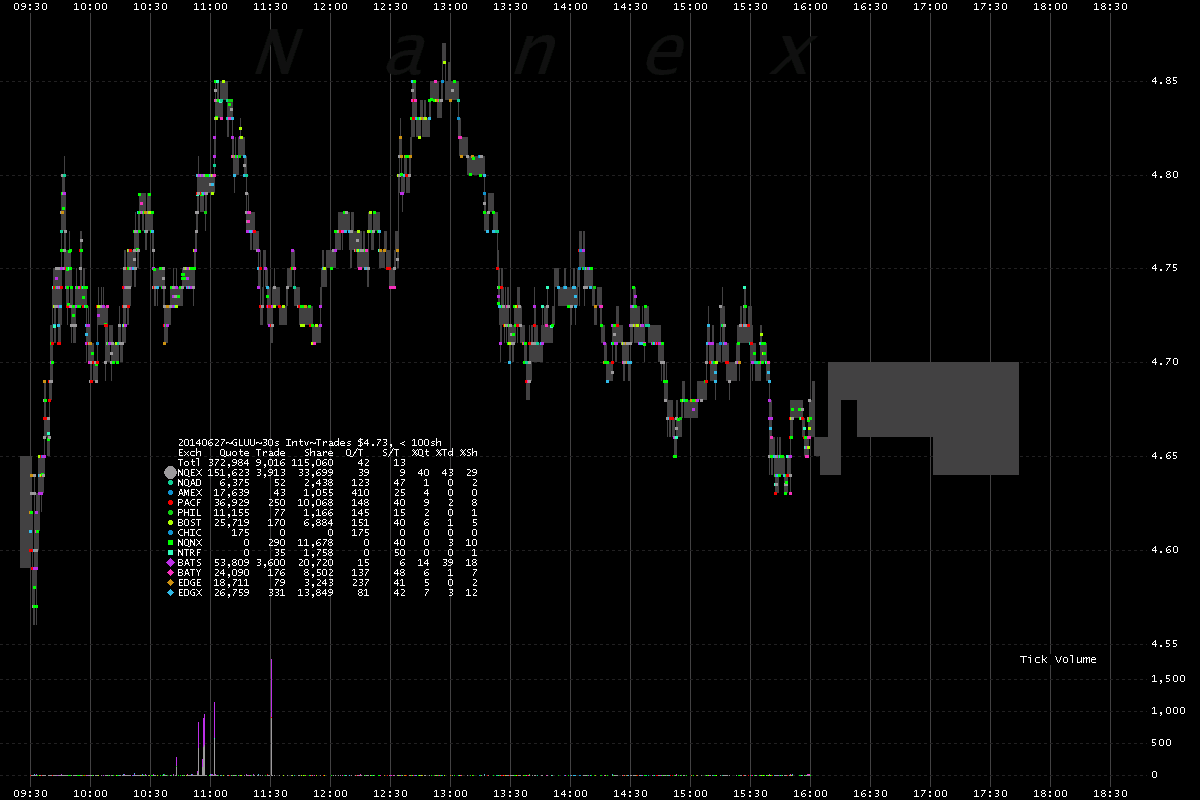
2. GLUU - Chart 1 zoomed out to 5 seconds of time.


3. GLUU - Zooming out to about 2 minutes of time.


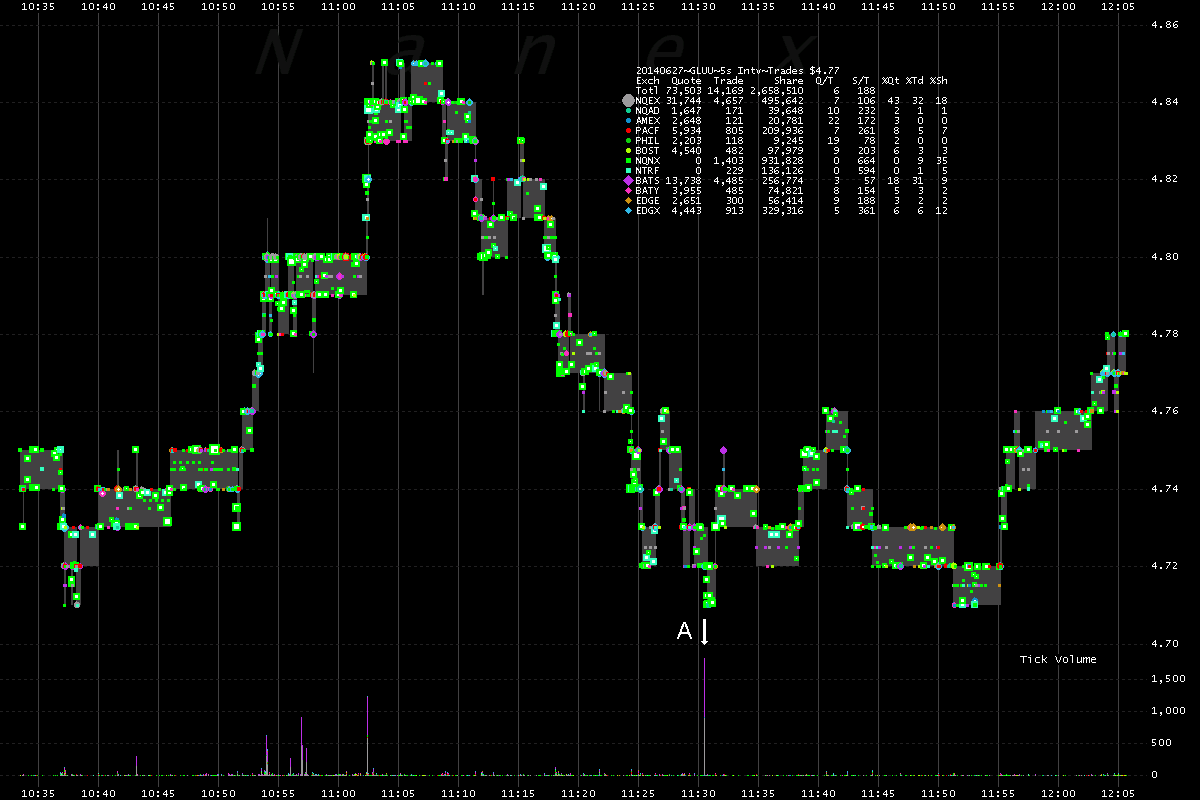
4. GLUU - Zooming out to about 90 minutes of time.
At this resolution, we can see there are other events involving the odd-lot bot.


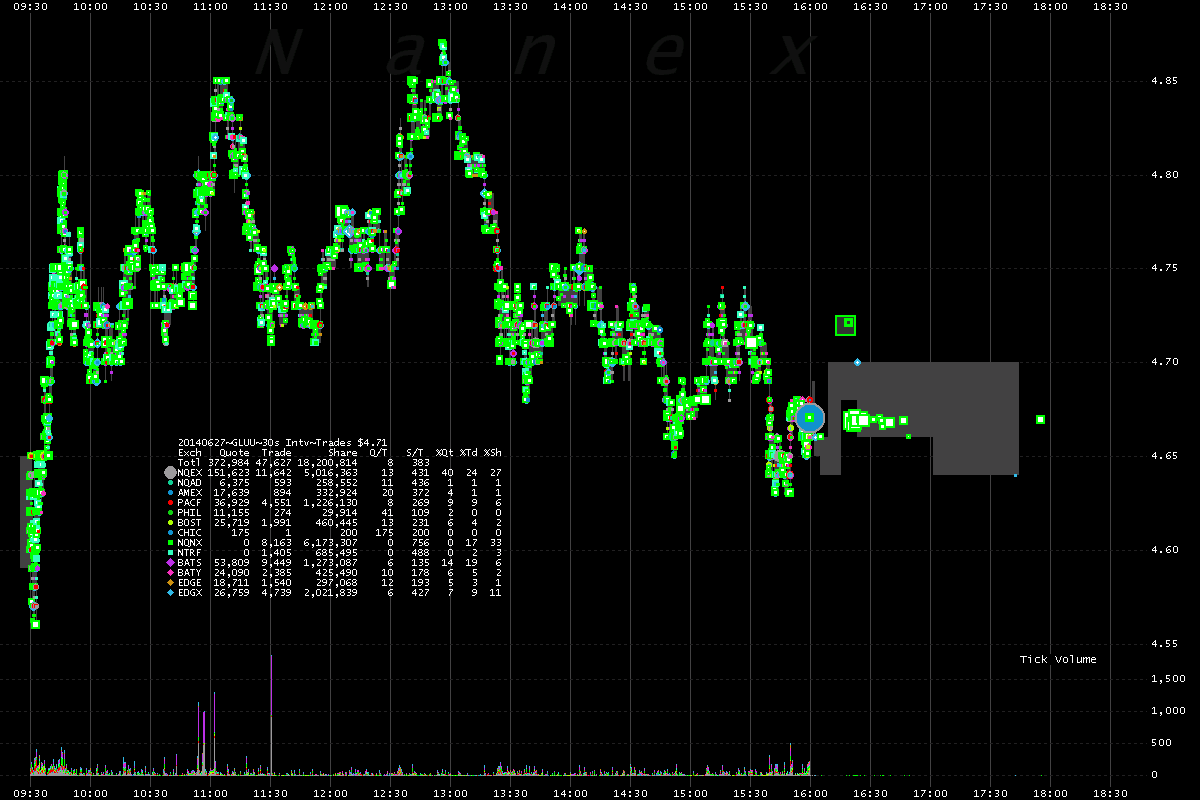
5. GLUU - Zooming out to the entire day.


6. GLUU - Same chart as above, but only showing odd-lot trades (< 100 shares). The algo's activity clearly stands out.


7. TVIX Trades on July 1, 2014 over about 30 minutes of time, including the event at 12:09:49. 


Nanex Research

Inquiries: pr@nanex.net