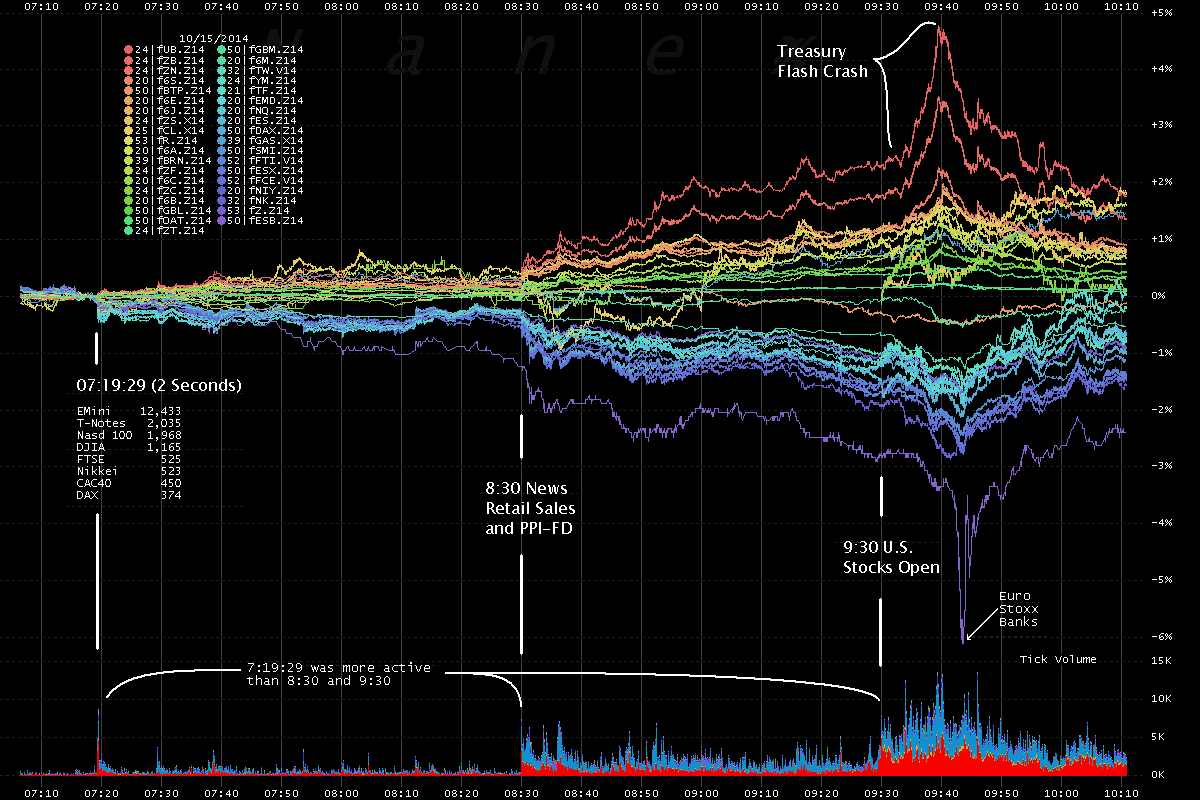
On October 15, 2014 between 9:33 and 9:45, interest rates in U.S. Treasury Futures flash crashed which was covered here. New information points to massive trading activity that began at 7:19:29 Eastern Time as the origin of the price move which led to a world-wide collapse in liquidity and price instability.
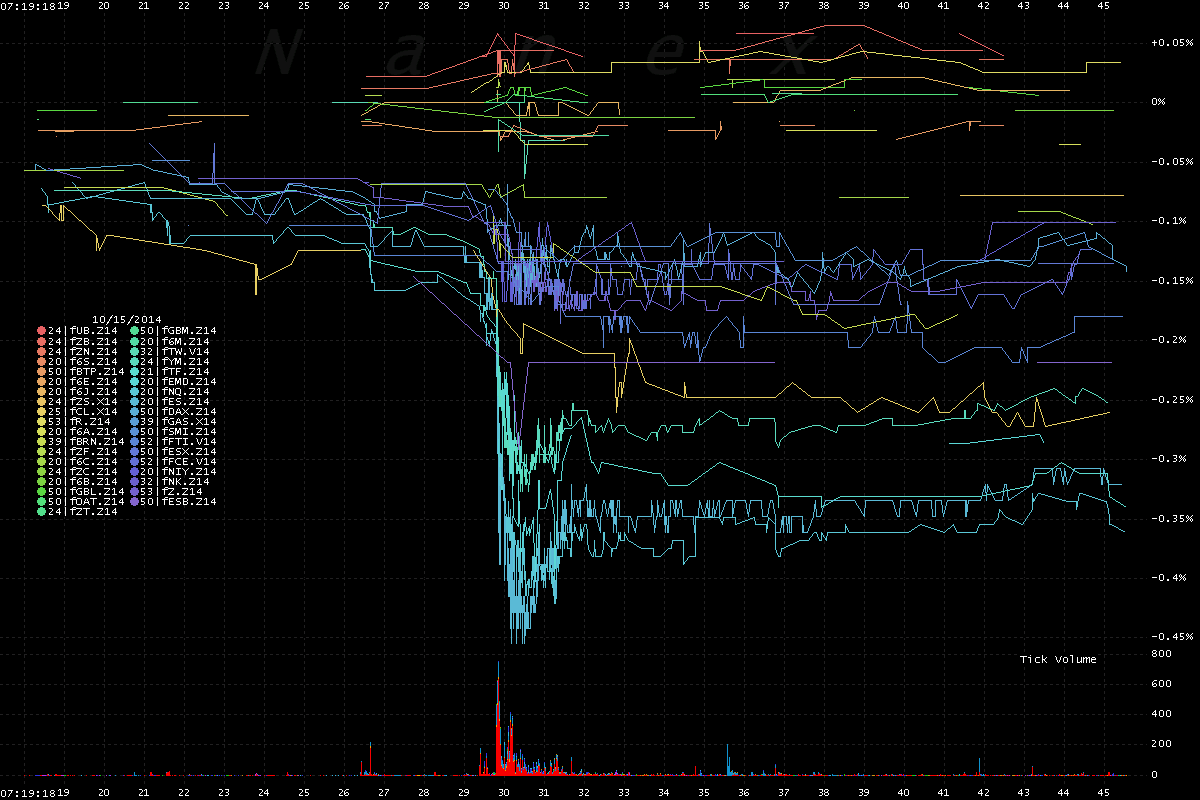
At 7:19:29, our unusual-activity screening software indicated a sudden burst of trading in many stock index and interest rate futures world-wide, most notable was that 8,169 EMini futures (ES) traded in 1 second. This high activity persisted for little over 2 seconds and was so unusual that it eclipsed the level of activity during the 8:30 news event and the U.S. Stock Market opening (a rare feat).
In addition, the price movement that began at 7:19:29 continued in the same direction through the 8:30 news event and the Treasury Flash Crash at 9:40. If this was a large (huge) bet, it was correct.
1. Chart of most active futures contracts world-wide shows the sequence of events which began at 7:19:29 and ended with the Treasury Flash Crash.
