Nanex Research

Nanex ~ 15-Oct-2014 ~ Treasury Flash Crash
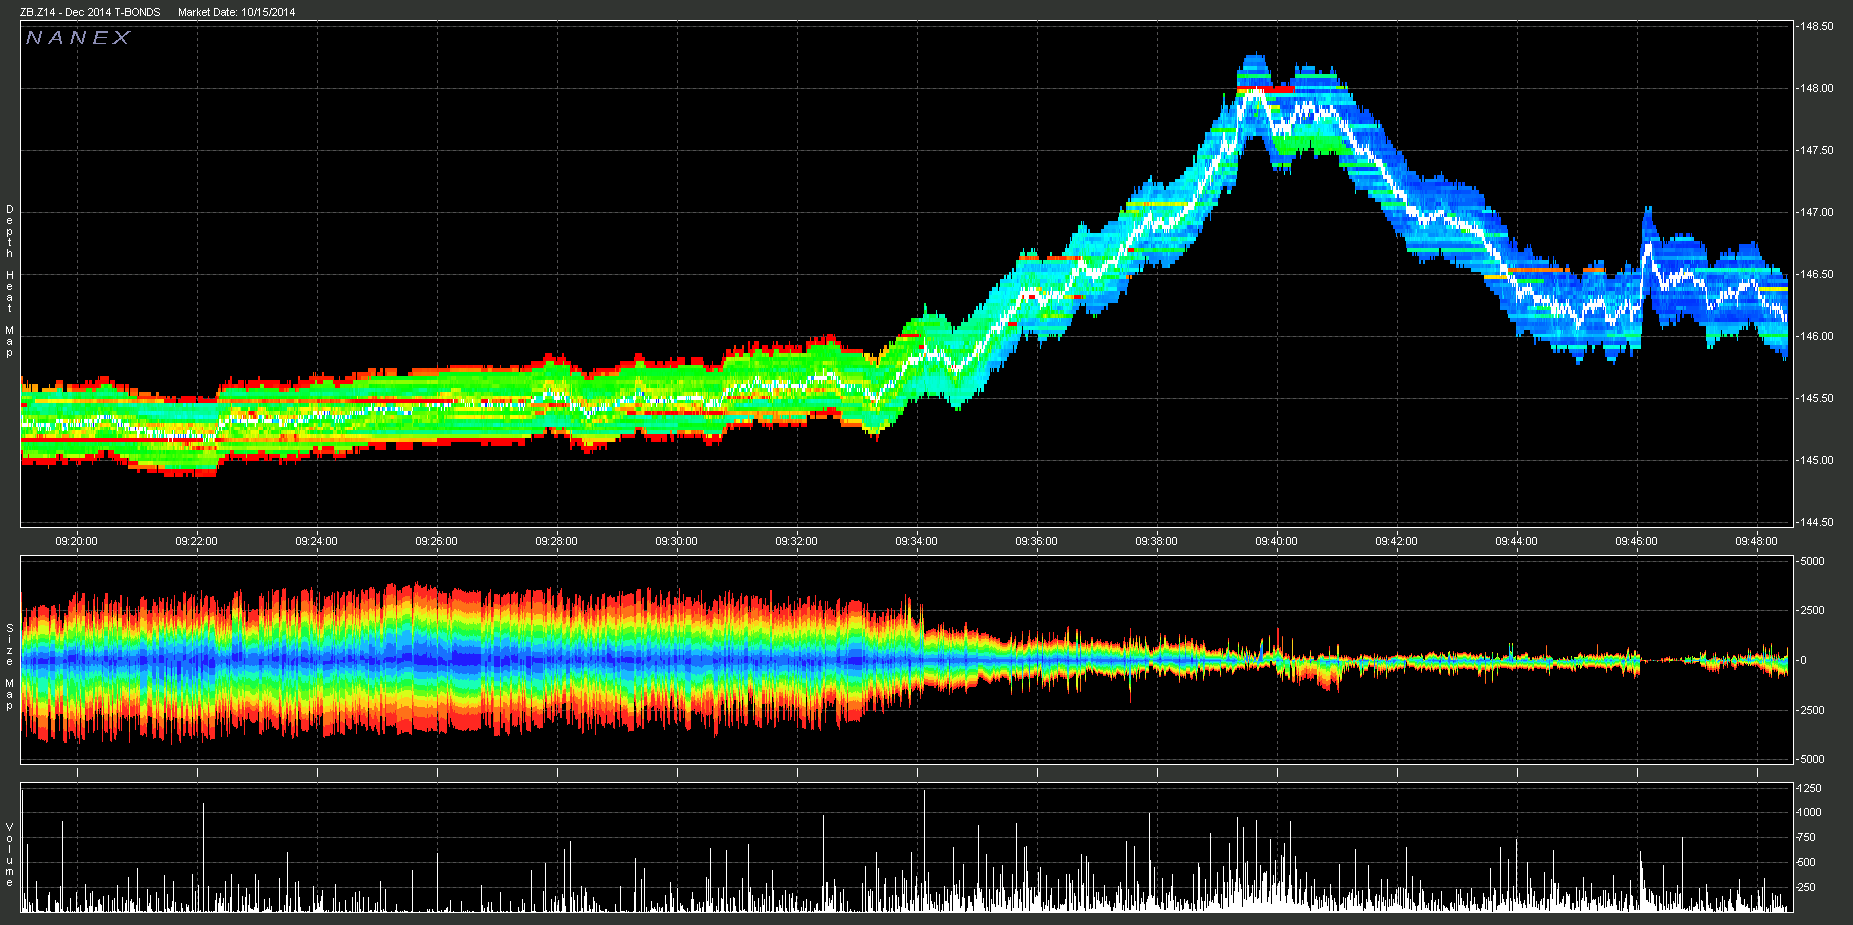
On October 15, 2014 between 9:33 and 9:45, liquidity evaporated in Treasury futures
and prices skyrocketed (causing yields to plummet). Five minutes later, prices returned
to 9:33 levels.
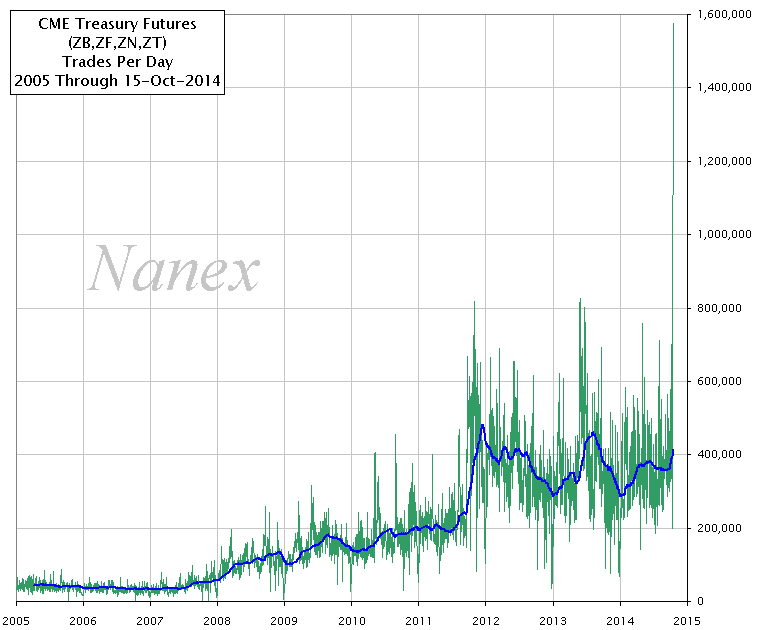
Trading activity was enormous, sending trade counts for the entire day to record
highs - exceeding that of the Lehman collapse, the financial crisis and the August 2011
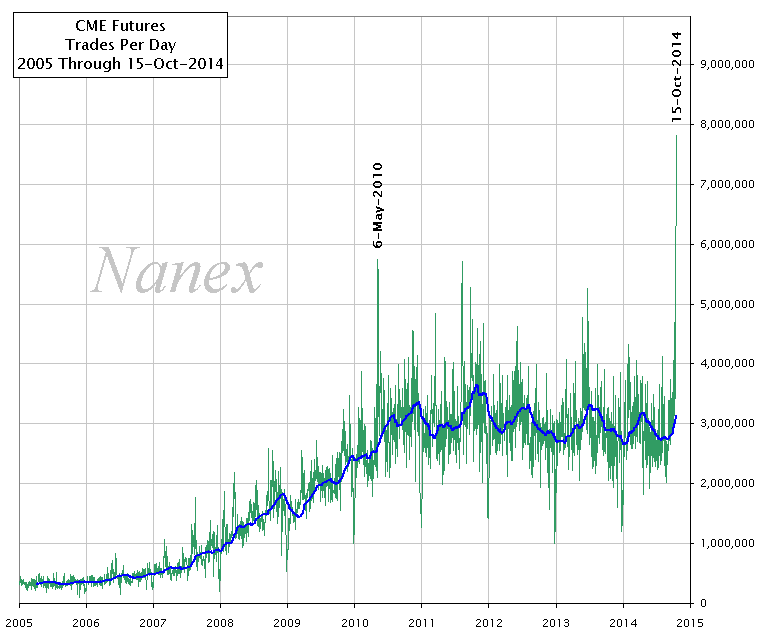
downgrade of U.S. debt. Treasury futures were so active, they pushed overall trade counts
on the
CME to a new record high.
1. Chart of most active futures contracts world-wide.
Treasury futures are rarely the biggest movers. It appears that a flash crash in Euro
Stoxx Bank Futures may have been caused by the treasury futures move.

2. Percent changes for the 30 year (ZB), 10 year (ZN), 5 year (ZF) and 2 year
(ZT) .

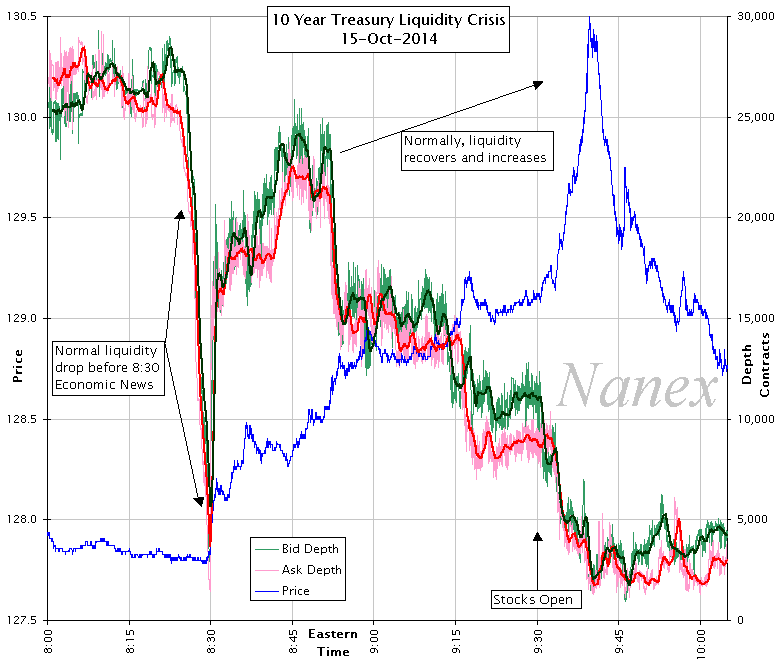
3. Liquidity in the 10 year as measured by total sizes of orders in 10 levels
of depth of book.
Note how liquidity just plummets.
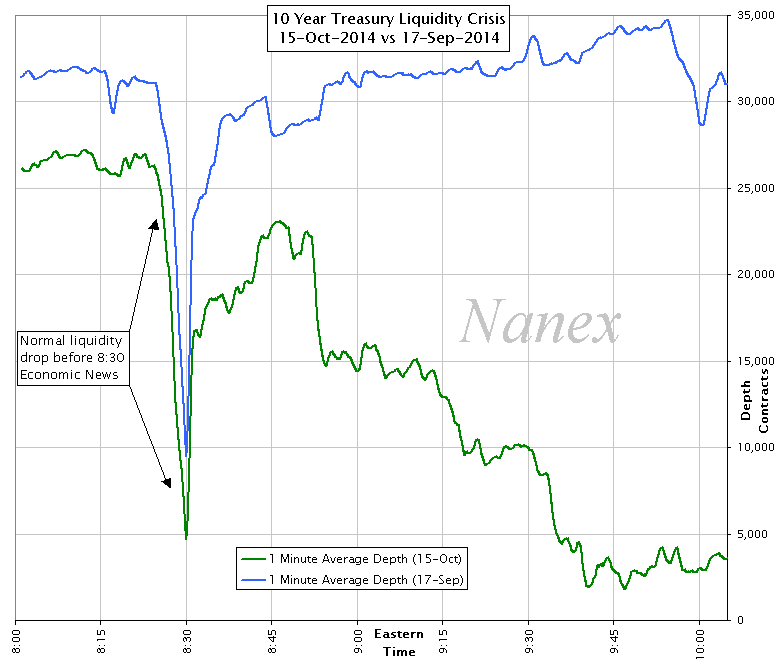
4. Comparing October 15 with a similar trading day a month earlier (September
17).
Liquidity on October 15 (green line) never recovers after the 8:30 economic news report.
5. Trades per day explodes to record highs.
6. Sending total number of trades on all CME futures to a new record high.
7. World Currencies.
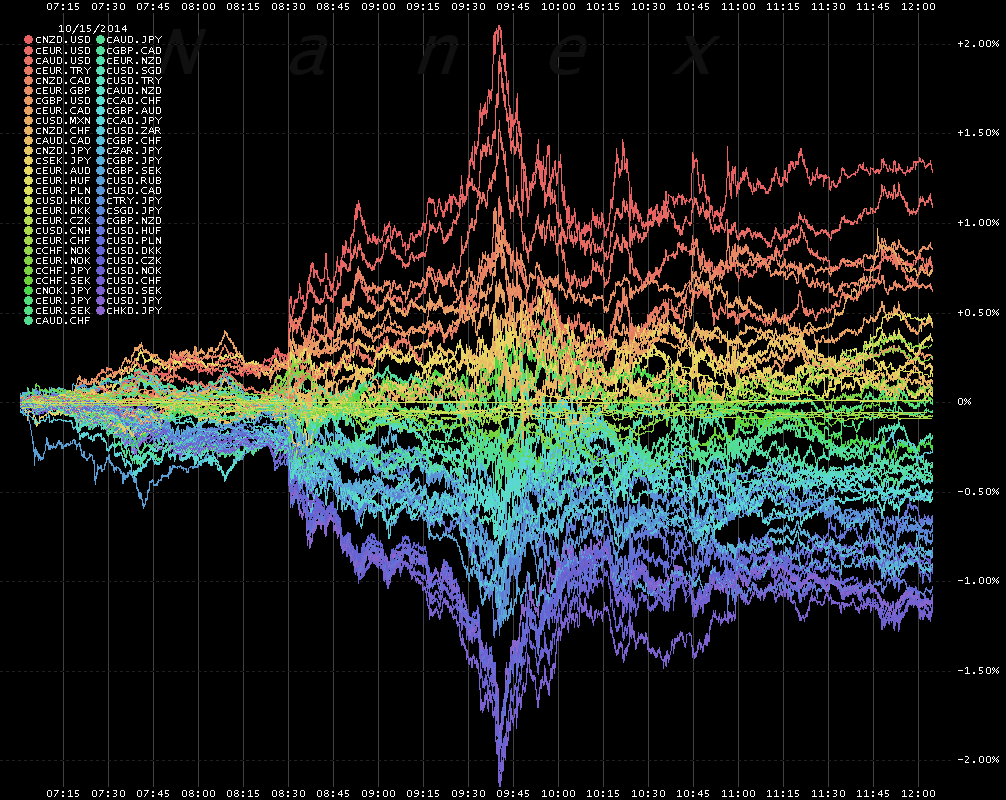
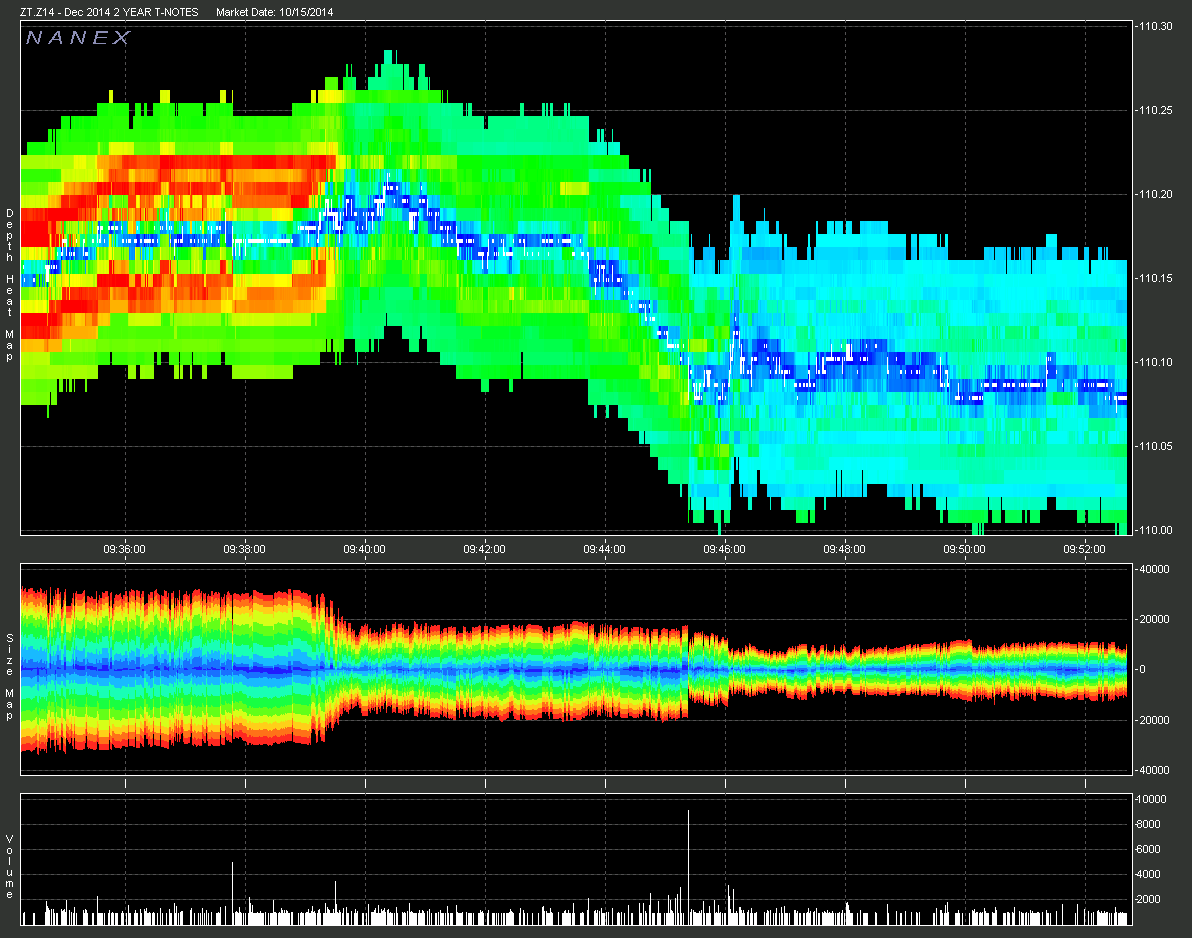
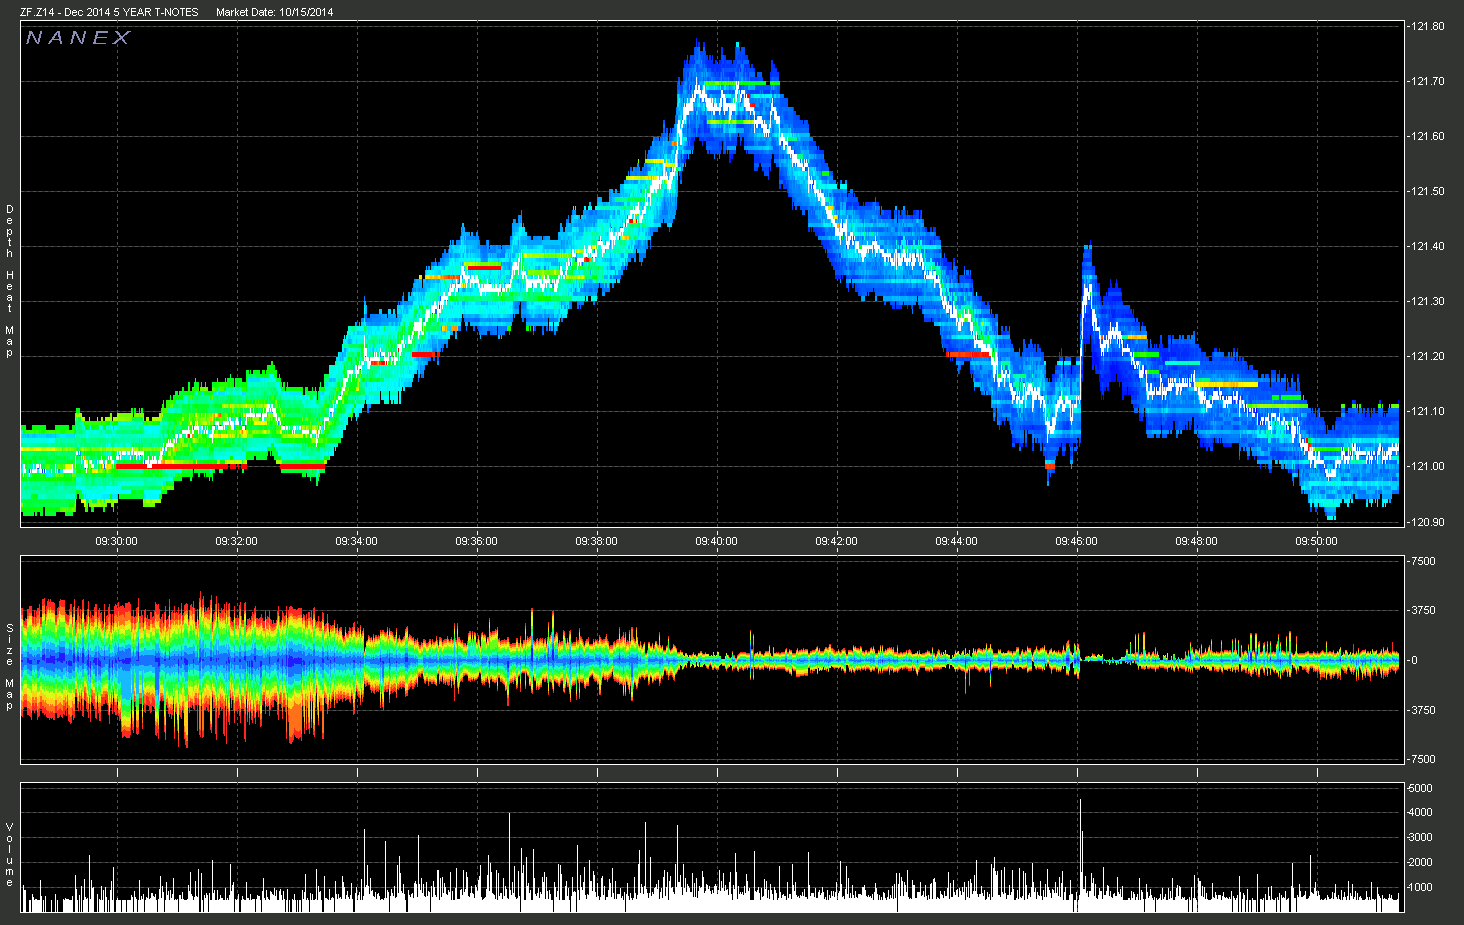
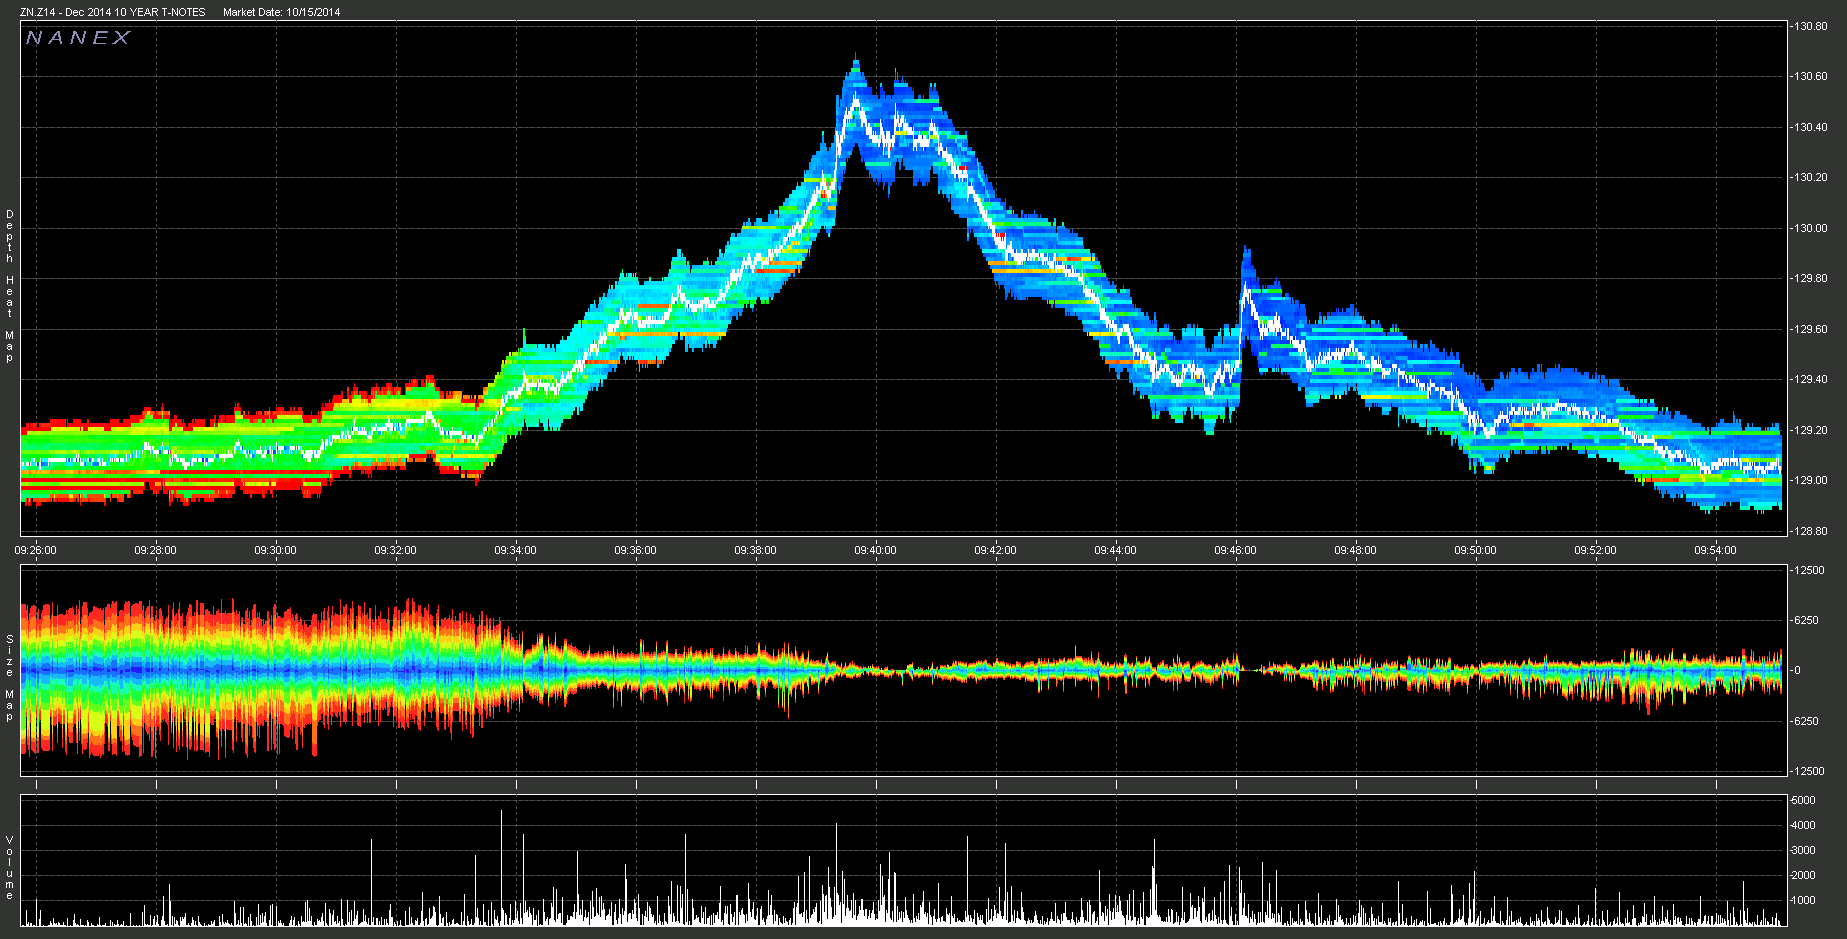
Nanex depth of book charts (how to read these charts).
8. ZT 2-Year Treasurys.
Even liquidity in the 2 year evaporated.
9. ZF 5-Year Treasurys.
10. ZN 10-Year Treasurys.
11. ZB 30-Year Treasurys.
Nanex Research
Inquiries: pr@nanex.net


