Nanex Research

Momentum Ignition Events (January 2007 to March 2012) for every 5-second period
between 12:00 and 13:00.
An animation of these events over the entire day can be found
here.
Momentum Ignition Events are caused by some HFT strategies which seek to cause short term market disruptions. We have discovered that these events are associated with a sudden evaporation (widening) of the bid/ask spread in a large number of stocks.
Each line shows the maximum number of symbols that experienced a sudden increase in
quote spreads during each 5-second period. Note the frequency of these events: before the birth of HFT in late 2006, they were very rare, yet today these events occur in almost every 5-second
period of the
trading day -- even during the normally quiet
noon hour!

Let's zoom in on one of the days shown in the animation above.
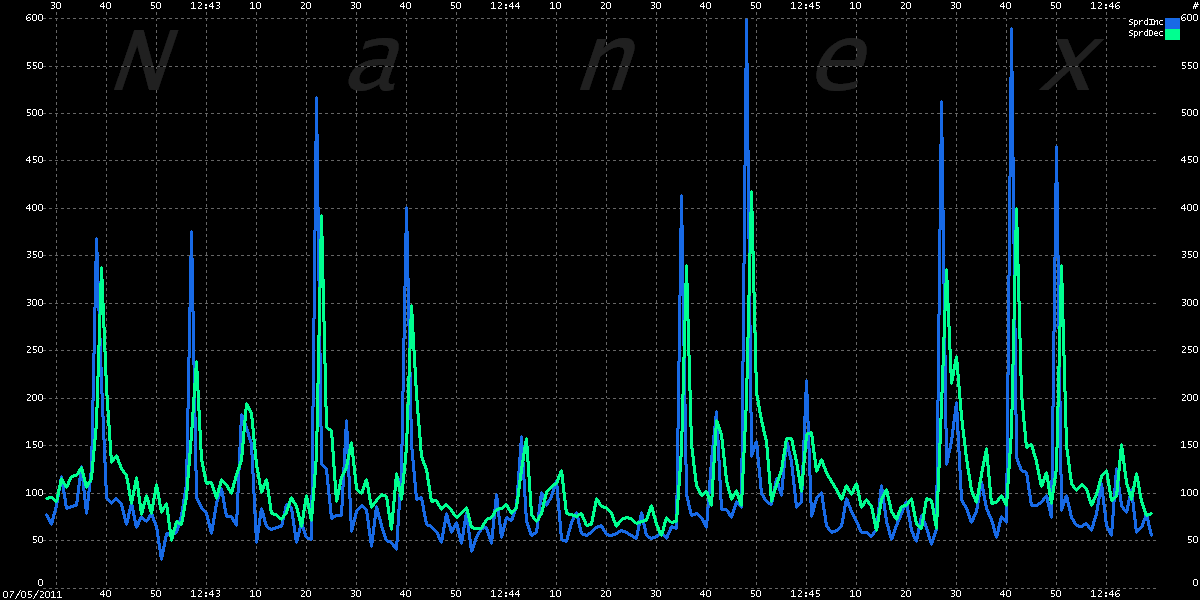
The chart below
covers just under 4 minutes of trading on July 5th, one of the quietest trading days
of the year. The blue line is the number of stocks that had widening quote spreads during that second. The green line is the number of stocks
that had narrowing spreads during that second. See more examples.

Note the recurring pattern -- a sudden
surge in stocks with widening spreads (blue), followed by a slighly lower surge in the number of stocks with narrowing spreads (green). The 9 blue spikes followed by 9 green spikes would appear in the
animation as single red lines at the following coordinates: 370 x 12:42:39, 375 x 12:42:58, 520 x 12:43:22,
400 x 12:43:40, 410 x 12:44:35, 600 x 12:44:48, 510 x 12:45:27, 590 x 12:45:41, and
460 x 12:45:50.
So in less than 4 minutes, there
are 9 market disrupting events where
spreads evaporate in hundreds of stocks..
during the noon hour..
on the quietest trading of the year.
This behavior simply did not exist before HFT, and bears no relation to economics
nor does it convey benefits such
as price discovery, improved stock price valuation,
tighter spreads, or increased liquidity . It does however, greatly
increase the cost of receiving, processing and storing stock pricing information (quotes)
for everyone. It also makes audit trail analysis much more difficult.
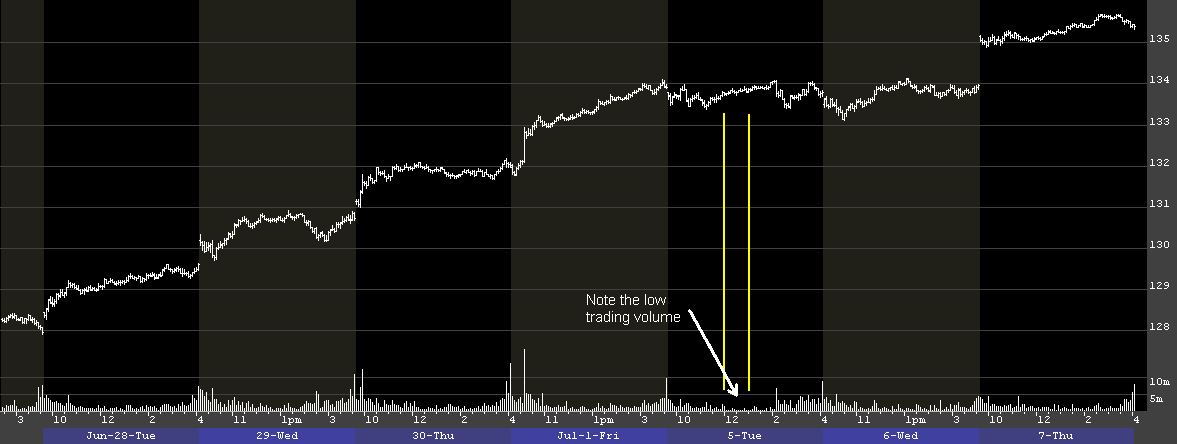
Below is a 5-minute interval bar chart of SPY that includes July 5, 2011. The 12:00 to 13:00 time period
is indicated between the yellow lines. On the surface, the market appears
moribund, and economically speaking, it is about as quiet as it gets. As for
HFT manipulation games however, it might as well be
Black Tuesday. Just one hour later, in spite of a
33% increase in exchange network capacity to handle 1 million quotes per second,
quote traffic surged to new records and completely filled available capacity. If the
regulators can't figure out what is going on during the quietest trading day of the
year, then for all practical purposes, there is no regulator.
Which is probably why
this type of behavior continues unchecked.

Nanex Research


