Norwegian Interview
E24 Interview with Eric Scott Hunsader on January 27, 2012
|
| On Friday, January 27, 2012, Sverre RÝrvik Nilsen,
a journalist from E24, Norway's largest financial
and business newspaper,
interviewed Eric Scott Hunsader of Nanex on the topic of HFT
anomalies in Norwegian market data. |
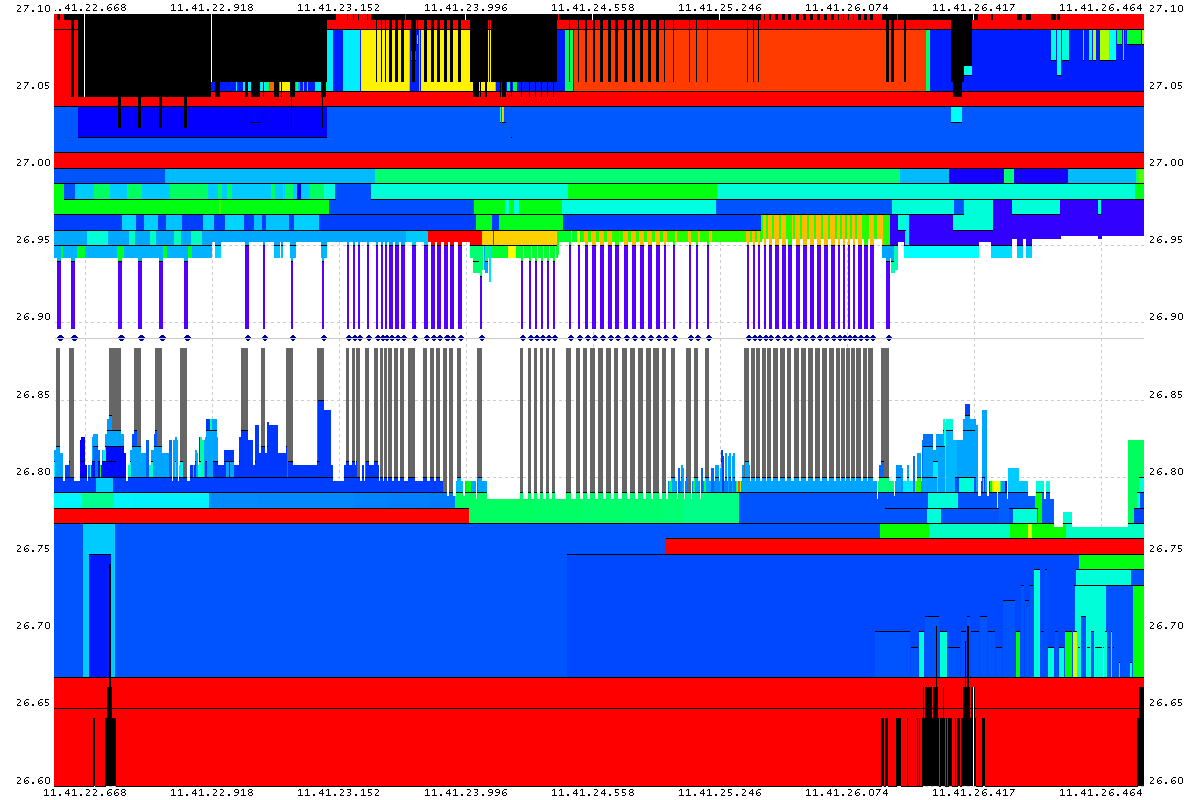
Tick chart with 10 order book levels of Store Brand on November 23, 2011
Trade executions are drawn as blue circles and sized according to the number of shares
traded. The 10 best bid and 10 best offer prices are drawn below and above respectively.
Each order book level is color coded from Red to Violet by the number of shares at
that level. Red represents a large number of shares, and violet represents a small
number. This allows us to quickly and easily see the amount and direction of activity
in the order book.
In this first chart, note the high rate of trades executing at 26.89. In every case
there is first a buy order for 2 shares at a limit price of 26.89 immediately followed
by a sell order for 100 shares at a limit price of 26.89, resulting in a trade execution
of 2 shares at 26.89. The remaining 98 shares of the sell order is immediately canceled.
Note there are many other changes to the order book that do not result in trades.
This chart shows about 4 seconds of data. The buyer id for every trade on this chart
is CAR and seller id for every trade is MLI.
Download Trades for chart below
Download Quotes for chart below
(click charts for higher resolution)
|

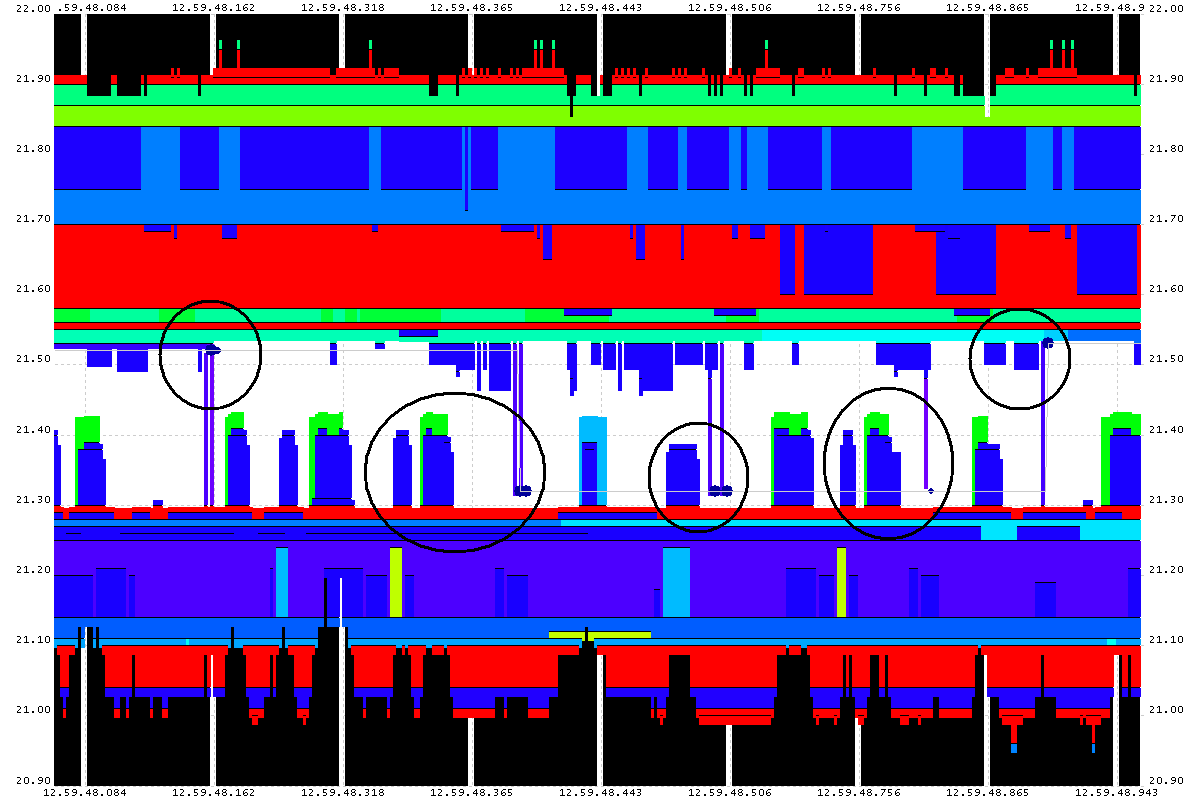
Tick chart with 10 order book levels of FrontLine on November 22, 2011
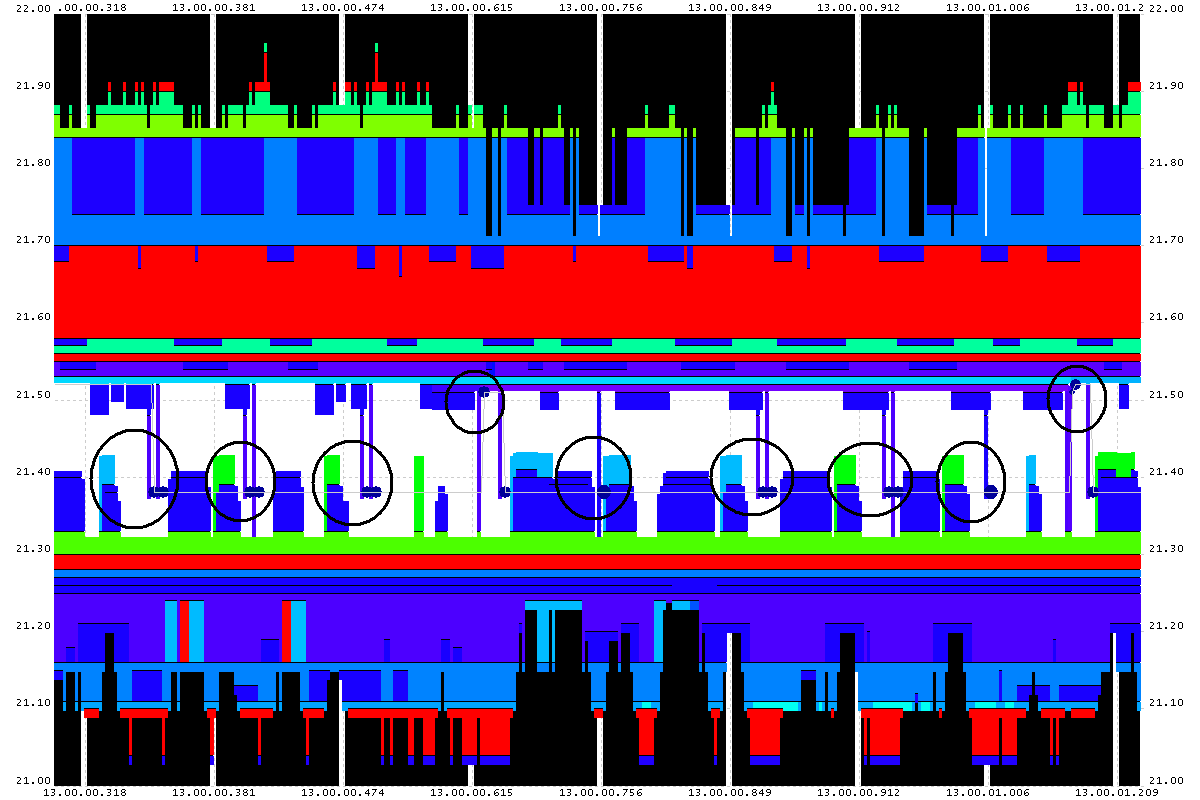
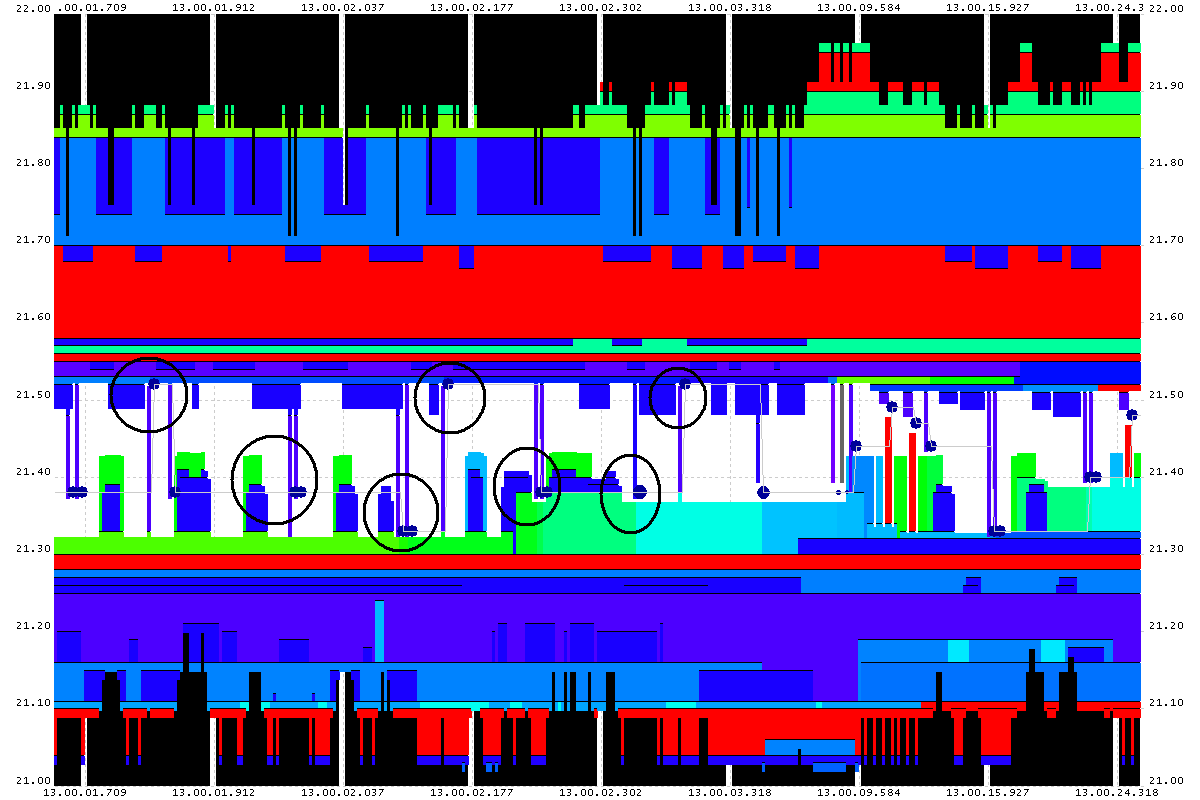
The areas marked by black circles are the trade executions to focus on. In each case,
better prices were available either the same millisecond or shortly before but were
canceled before the trade execution. Either the buy/sell
algo wasn't fast enough, or some other non-economic gaming of the system is occurring.
Download Trades for charts below
Download Quotes for charts below
|

Tick chart with 10 order book levels of FrontLine on November 22, 2011
This chart is a continuation in time from the chart above. |

Tick chart with 10 order book levels of FrontLine on November 22, 2011
This chart is a continuation in time from the chart above. |

Download Total Counts Spreadsheet
Download Total Counts Text File
Download Unusual Events (sorted by high quote counts)
We welcome comments or questions at: pr@nanex.net
Publication Date: 01/30/2012
http://www.nanex.net
| This report and all material shown on this
website is published by Nanex, LLC and may not be reproduced, disseminated, or
distributed, in part or in whole, by any means, outside of the recipient's
organization without express written authorization from Nanex. It is a
violation of federal copyright law to reproduce all or part of this publication
or its contents by any means. This material does not constitute a solicitation
for the purchase or sale of any securities or investments. The opinions
expressed herein are based on publicly available information and are considered
reliable. However, Nanex makes NO WARRANTIES OR REPRESENTATIONS OF ANY SORT
with respect to this report. Any person using this material does so solely at
their own risk and Nanex and/or its employees shall be under no liability
whatsoever in any respect thereof.
|
|
|


